What is a Natural Gas Power Plant Equipment Health Monitoring & Maintenance Dashboard?
A Natural Gas Power Plant Equipment Health Monitoring & Maintenance Dashboard is a centralized tool designed for plant managers, maintenance supervisors, and operational leads to monitor the health, performance, and maintenance activities of critical power plant equipment. It provides a clear view of key performance indicators such as equipment health index, unplanned downtime, MTBF, mean time to repair, critical alerts, and equipment availability. Unlike manual reports, this dashboard helps plant teams track maintenance efficiency, identify recurring issues, and improve equipment reliability in one intuitive view.
How to Create a Natural Gas Power Plant Equipment Health Monitoring & Maintenance Dashboard
You don’t need to build your dashboard from scratch—just start with a ready-to-use Natural Gas Power Plant Equipment Health Monitoring & Maintenance Dashboard template from Mokkup. Customize it with your data and export it with ease. Here’s how:
1. Create or Log in to Your Mokkup Account
Sign up on Mokkup.ai using your email address. Existing users can log in directly to get started.
2. Choose and Customize Your Dashboard Template
Locate the Natural Gas Power Plant Equipment Health Monitoring & Maintenance Dashboard template in the Templates gallery. Use the drag-and-drop editor to modify KPIs, adjust filters, or add new visual elements based on your plant’s data.
3. Export to Your BI Tool
Once your dashboard wireframe is finalized, use the BI Tool Export feature to transfer it to Power BI or Tableau for deeper analysis. You can also download the dashboard as a PDF, PNG, or JPEG, embed it on your platform, or invite team members to collaborate.
Note: This is a Pro template. A Mokkup Pro subscription is required to access and customize this dashboard wireframe.
Natural Gas Power Plant Equipment Health Monitoring & Maintenance Dashboard Example
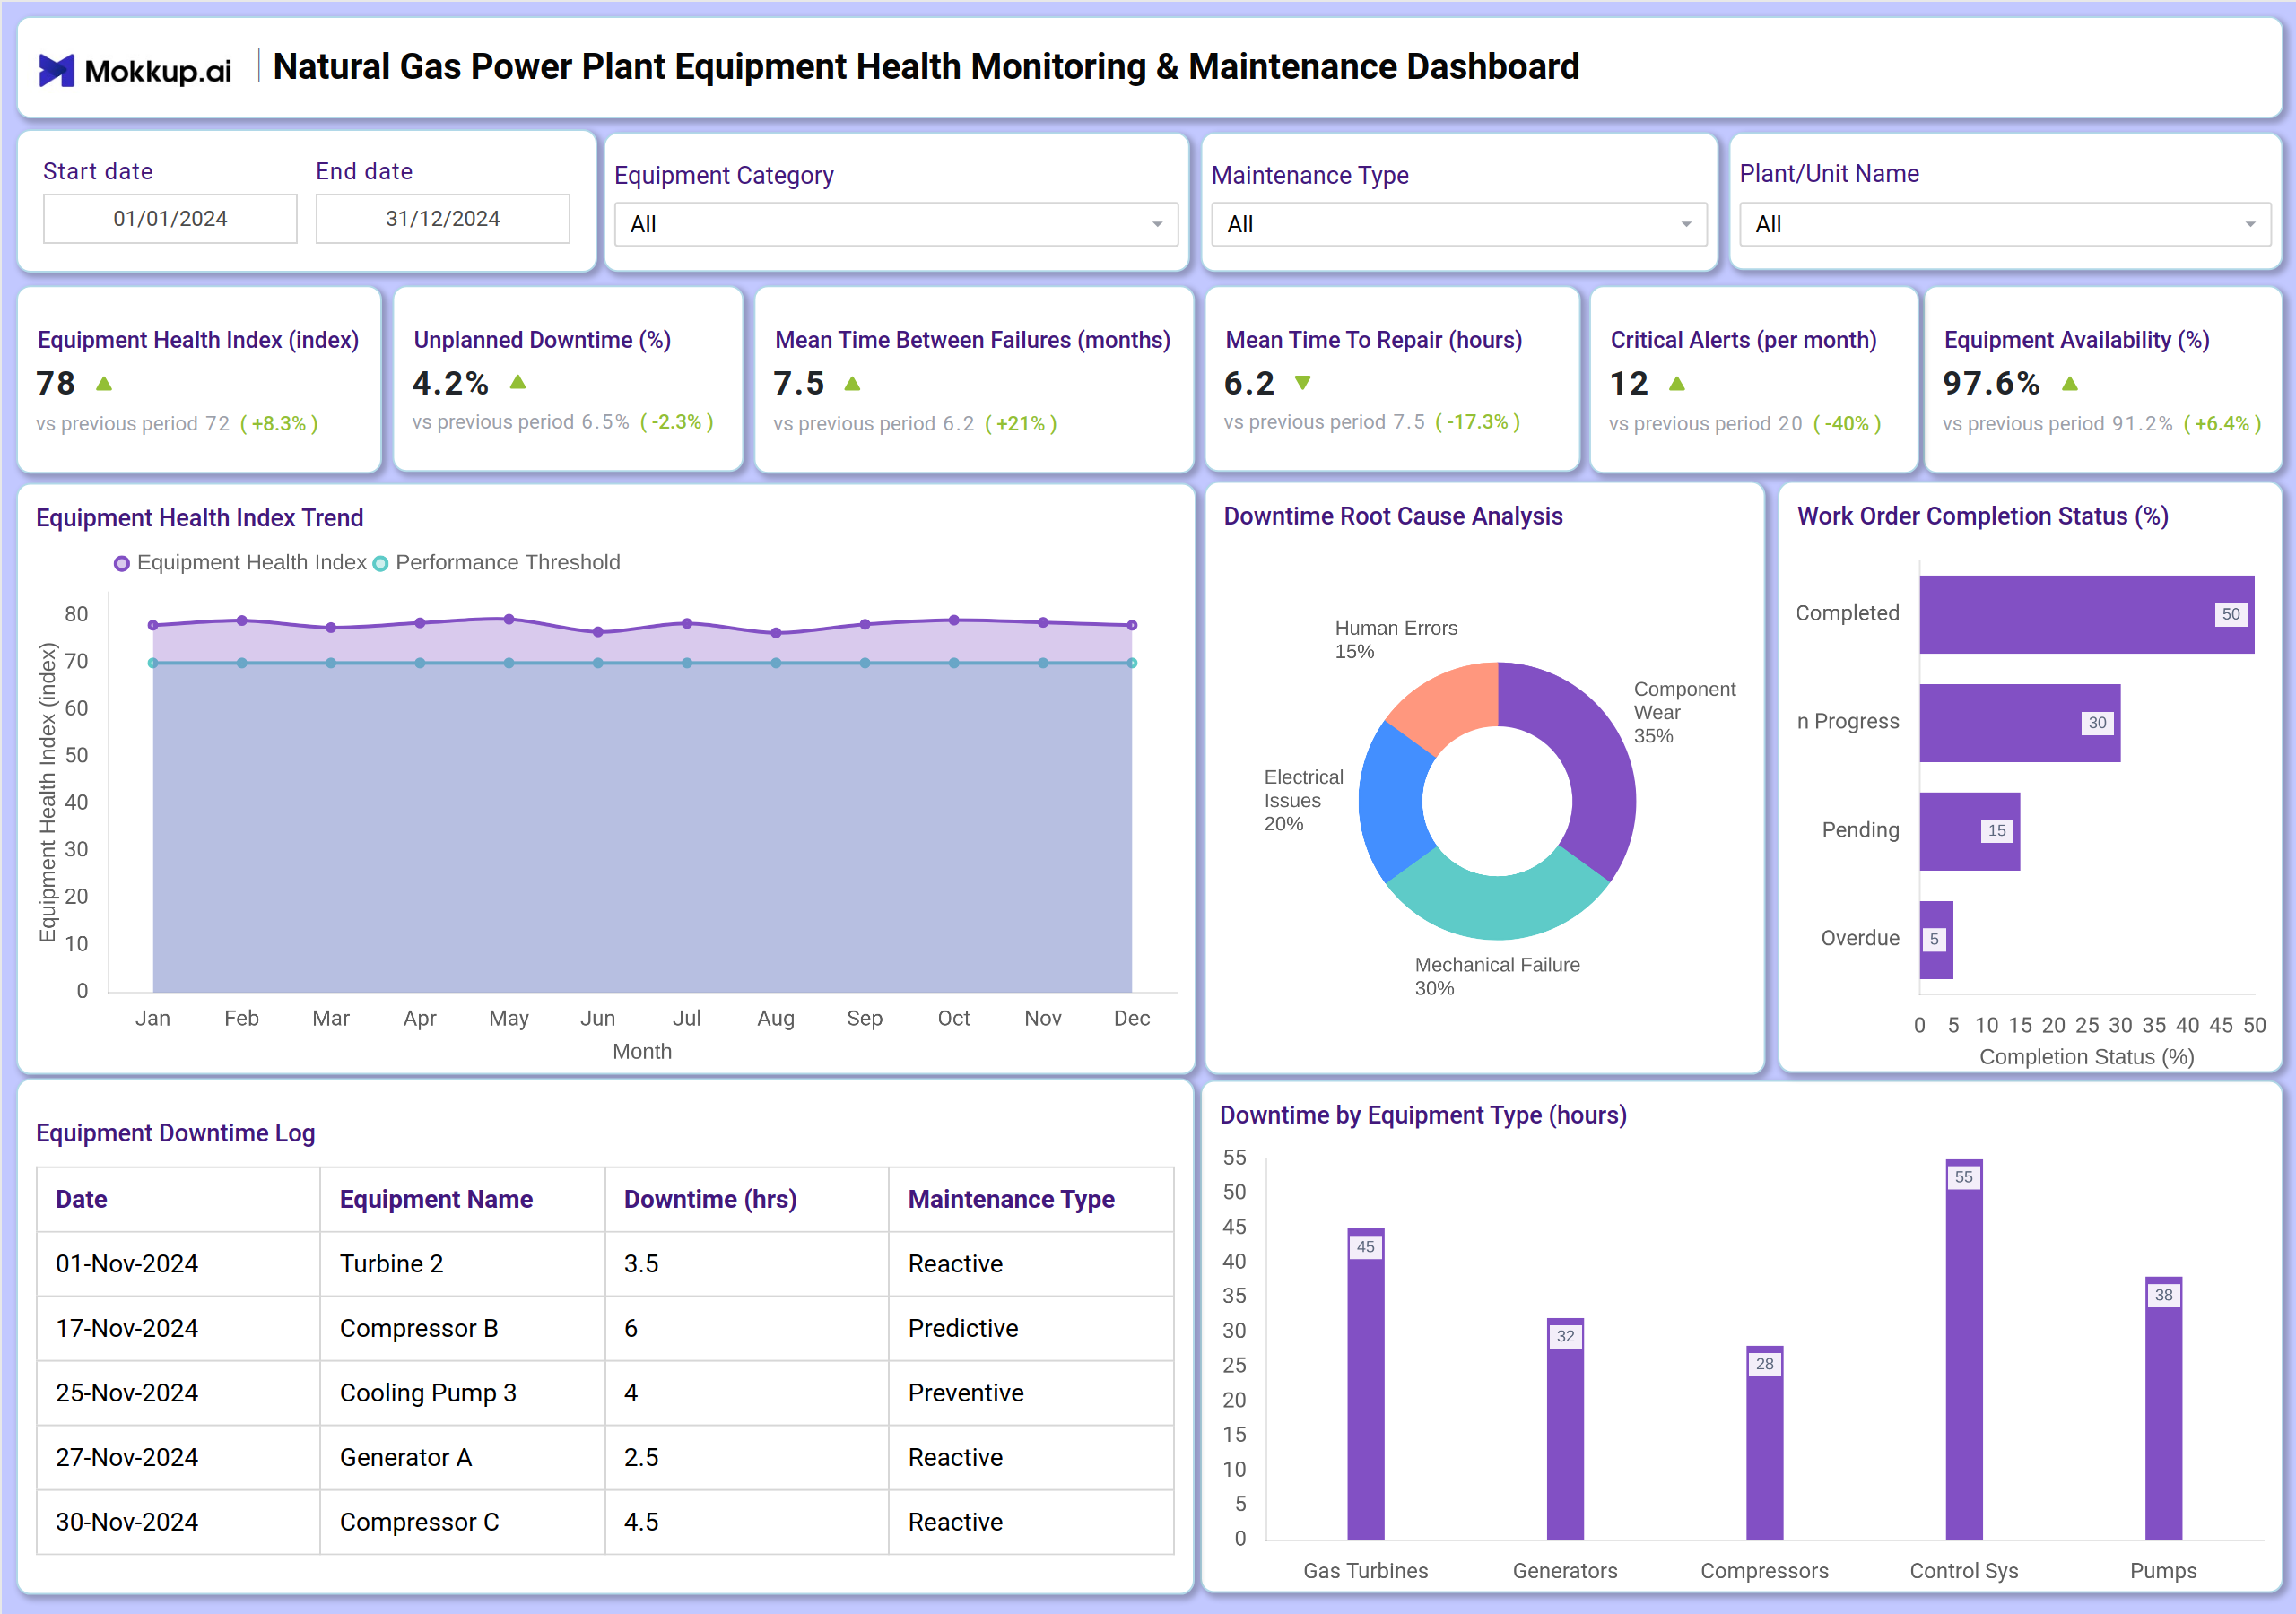
You can create a Natural Gas Power Plant Equipment Health Monitoring & Maintenance Dashboard using a combination of KPI tiles and visual widgets. At the top, KPI cards display essential metrics such as Equipment Health Index, Unplanned Downtime, MTBF, Mean Time To Repair, Critical Alerts, and Equipment Availability. Below, trend charts show the Equipment Health Index over time, while tables and pie charts break down downtime logs, root causes, and work order completion status. Bar charts also help visualize downtime by equipment type. Together, this dashboard serves as a tool for tracking natural gas power plant maintenance metrics, providing maintenance and operations teams with a clear picture of equipment performance and reliability.
How to Analyze Data in Natural Gas Power Plant Equipment Health Monitoring & Maintenance Dashboards
Here’s how plant operators and maintenance teams can leverage this dashboard:
- Monitor equipment health trends: Use the Equipment Health Index Trend chart to track performance against thresholds over time.
- Analyze downtime causes: Review the Downtime Root Cause Analysis to identify recurring issues, such as control system errors or mechanical failures.
- Track maintenance efficiency: Compare MTBF and Mean Time To Repair to evaluate repair speed and equipment reliability.
- Review work order progress: Check Work Order Completion Status to ensure timely maintenance actions.
- Evaluate equipment availability: Monitor availability percentages to assess operational readiness.
- Identify critical alerts: Utilize monthly critical alert data to prioritize urgent maintenance tasks.
Benefits of Natural Gas Power Plant Equipment Health Monitoring & Maintenance Dashboards
Typically, using this dashboard for tracking natural gas power plant maintenance metrics can give you benefits like:
- Improved equipment visibility: Clear KPIs for health, availability, and downtime across all equipment categories.
- Proactive maintenance planning: Trend analysis and root cause data support predictive and preventive strategies.
- Increased operational uptime: Tracks and helps reduce unplanned downtime, improving MTBF.
- Informed decision-making: Data on repair times and alert frequency aids in resource allocation.
- Compliance and reporting support: Works as a natural gas power plant maintenance and compliance dashboard for audits and performance reviews.
- Enhanced team collaboration: Centralized log of downtime and work orders improves coordination between teams.
Together, these components provide maintenance and operations leaders with the insights needed to enhance equipment reliability and reduce costly interruptions. That’s why many industry professionals consider it the best equipment health dashboard for natural gas power plants when aiming to boost performance and streamline maintenance workflows.
KPIs to Track in Natural Gas Power Plant Equipment Health Monitoring & Maintenance Dashboards
- Equipment Health Index: Overall score reflecting the condition of plant equipment.
- Unplanned Downtime (%): Percentage of time equipment is unexpectedly offline.
- MTBF (Mean Time Between Failures): Average operational time between equipment failures.
- Mean Time To Repair: Average time required to restore equipment after a failure.
- Critical Alerts: Number of high-priority alerts generated per month.
- Equipment Availability (%): Percentage of time equipment is operational and available.
- Downtime by Equipment Type: Hours of downtime categorized by asset type.
- Work Order Completion Status: Progress on scheduled maintenance tasks.
Frequently Asked Questions
1. Who should use a Natural Gas Power Plant Equipment Health Monitoring & Maintenance Dashboard?
Plant managers, maintenance supervisors, reliability engineers, and operations teams are responsible for equipment performance and upkeep.
2. Can this dashboard help reduce unplanned downtime?
Yes. By tracking downtime causes and equipment health trends, teams can address issues before they lead to failures.
3. How does it support maintenance planning?
It provides data on MTBF, repair times, and work order status to help schedule preventive and predictive maintenance.
4. Is this dashboard useful for compliance?
Yes. As a natural gas power plant maintenance and compliance dashboard, it supports reporting, audits, and governance requirements.