
What is a Urologic Cancer Care Dashboard?
A Urologic Cancer Care Dashboard is a centralized tool designed for urology department leadership, including oncologists, clinical directors, and department heads, to monitor and evaluate the performance and outcomes of urological cancer care. It provides a comprehensive view of treatment efficacy, patient outcomes, satisfaction, and complication management. Unlike static reports, this Urologic Cancer Care Dashboard enables institutions to track clinical success, patient recovery, and care quality in one place, serving as an essential tool for Urologic Cancer Care performance tracking.
How to Create a Urologic Cancer Care Dashboard
You don’t need to build your report from scratch—just start with a ready-to-use Urologic Cancer Care Dashboard template from Mokkup. Add in your data and export it however you like. Here’s how to do it:
1. Create or Log in to Your Mokkup Account
Start by signing up on Mokkup.ai using your email. If you already have an account, just log in, and you’ll be good to go.
2. Choose and Customize Your Dashboard Template
Find the Urologic Cancer Care Dashboard template in the Templates section. Use the drag-and-drop editor to adjust KPIs, edit filters, or add elements based on your data.
3. Export to Your BI Tool
Once your dashboard wireframe is ready, use the BI Tool Export feature to send it directly to Power BI or Tableau for further analysis and enhancements. You can also download the dashboard as a PDF, PNG, or JPEG, embed it on a platform, or invite your team to collaborate.
Note: This is a Pro template. You’ll need a Pro subscription on Mokkup to use and customize this dashboard wireframe. Upgrade anytime to unlock full access.
Urologic Cancer Care Dashboard Example
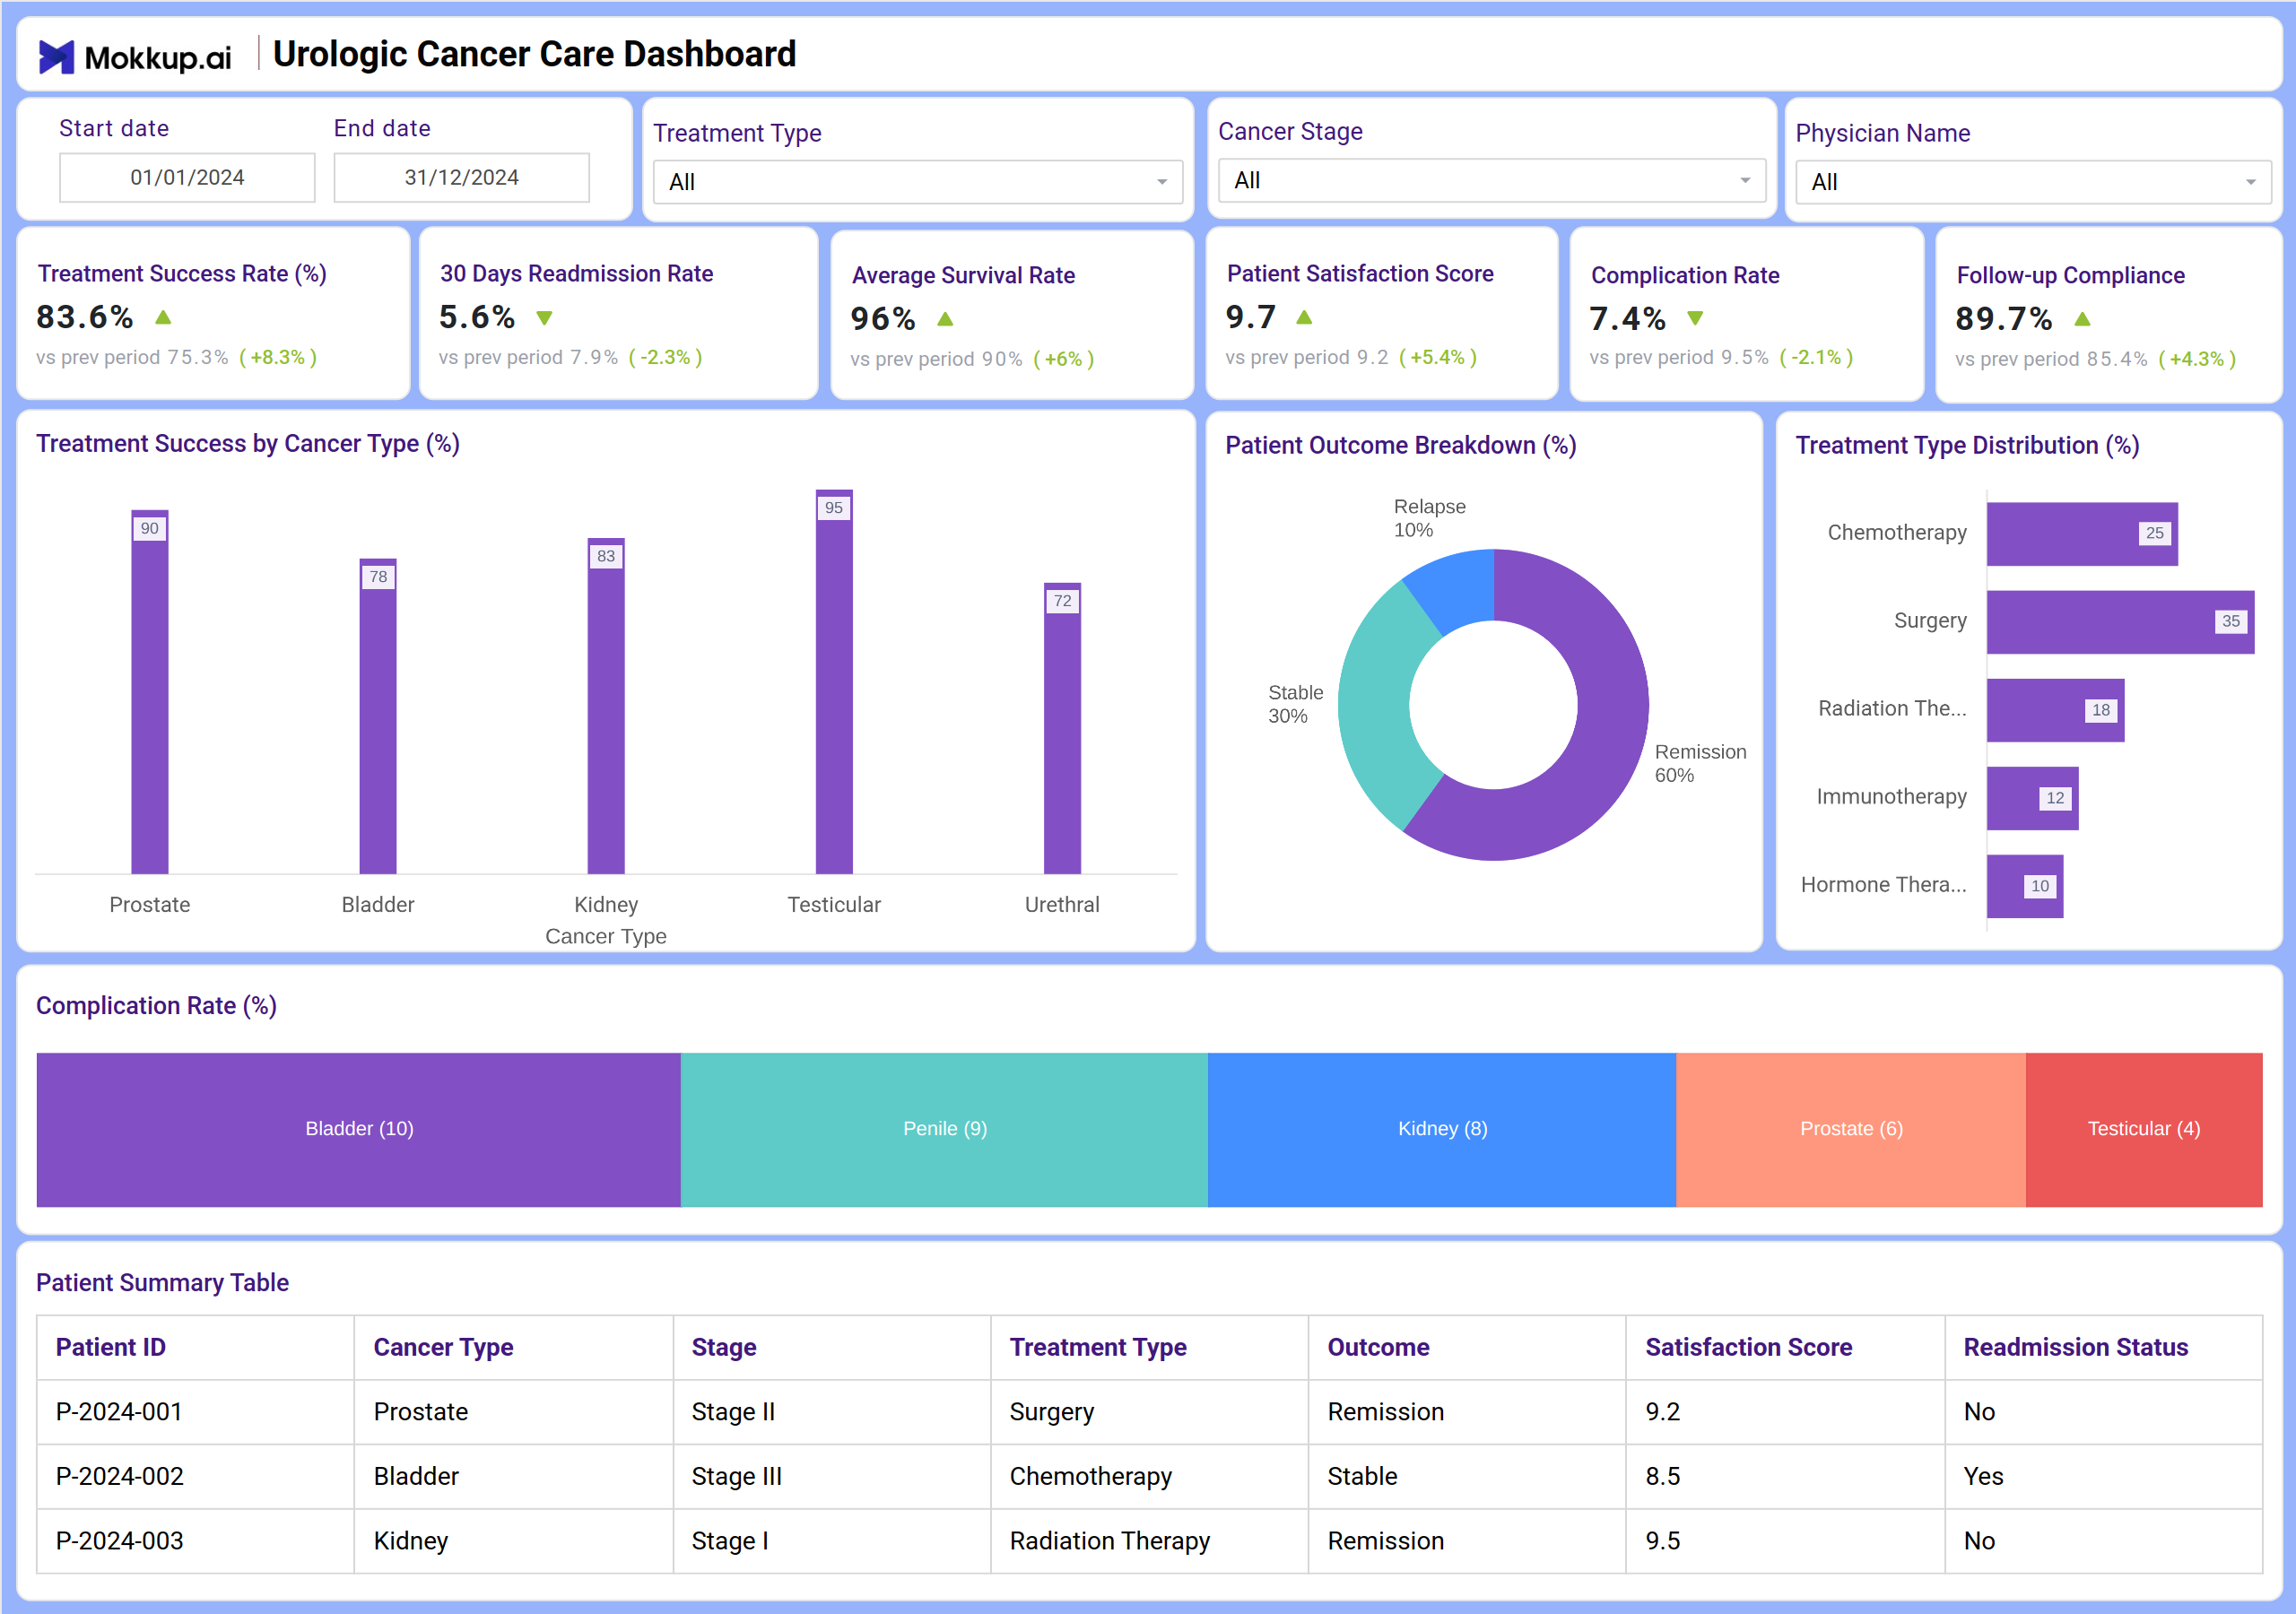
You can create a Urologic Cancer Care Dashboard that combines KPI tiles and visualizations. At the top, KPI cards track key metrics, including Treatment Success Rate, Readmission Rate, Survival Rate, Patient Satisfaction, Complication Rate, and Follow-up Compliance. Below that, charts display Treatment Success by Cancer Type, Patient Outcome Breakdown, Treatment Type Distribution, and Complication Rate by Cancer Type. A Patient Summary Table provides a granular view of individual patient journeys. Together, this dashboard serves as a urologic cancer care analytics and reporting tool, providing leadership with both clinical and patient-centric visibility.
How to Analyze Data in Urologic Cancer Care Dashboards
Here’s how urology departments can make the most of the data available on the Urologic Cancer Care Dashboard:
- Track Treatment Efficacy: Monitor the Treatment Success Rate to evaluate the overall effectiveness of care protocols.
- Monitor Patient Recovery: Analyze the 30-Day Readmission Rate to identify potential issues in post-treatment care.
- Assess Long-term Outcomes: Review the Average Survival Rate as a key indicator of long-term treatment success.
- Gauge Patient Experience: Use the Patient Satisfaction Score to understand the quality of care from the patient's perspective.
- Manage Risks: Track the Complication Rate to identify areas for improvement in treatment safety.
- Evaluate Continuity of Care: Monitor Follow-up Compliance to ensure patients are adhering to post-treatment plans.
- Compare Performance by Cancer Type: Use the Treatment Success by Cancer Type chart to see which areas need more focus.
- Review Individual Patient Cases: Use the Patient Summary Table for detailed case reviews and trend analysis.
Benefits of Urologic Cancer Care Dashboards
- Improved Clinical Visibility: Key metrics across treatment outcomes, complications, and patient recovery provide a clearer view of oncology centers.
- Enhanced Patient Outcomes: Tracks remission, relapse, and stability rates to improve care strategies.
- Performance Benchmarking: Compare current period performance with previous periods for trend analysis.
- Informed Decision-Making: Data on treatment type distribution and success rates guide resource allocation.
- Patient-Centric Care: Focus on satisfaction and compliance ensures a high standard of patient experience.
- Compliance & Reporting: Works as a urologic cancer care analytics and reporting dashboard for audits, governance, and accreditation.
Together, these elements provide healthcare leadership with clinical and operational visibility, making it easier to align treatment strategies with patient outcomes. That's why many healthcare leaders consider it the best care dashboard for urologic cancer care when optimizing cancer treatment effectiveness and patient care.
KPIs to Track in Urologic Cancer Care Dashboards
- Treatment Success Rate (%): Percentage of treatments achieving desired clinical outcomes.
- 30 Days Readmission Rate: Proportion of patients readmitted within 30 days of discharge.
- Average Survival Rate: The percentage of patients surviving over a defined period post-treatment.
- Patient Satisfaction Score: A numerical score reflecting patient feedback on their care experience.
- Complication Rate (%): The rate of complications arising from treatments or procedures.
- Follow-up Compliance (%): Percentage of patients adhering to scheduled follow-up appointments.
- Patient Outcome Breakdown (%): Distribution of patient outcomes, including Remission, Stable, and Relapse.
- Treatment Type Distribution (%): The proportion of different treatment modalities used (e.g., Surgery, Chemotherapy).
- Complication Rate by Cancer Type: Tracks complications specific to different urological cancers.
Frequently Asked Questions
1. Who should use a Urologic Cancer Care Dashboard?
Urologists, oncology department heads, clinical directors, and healthcare administrators are responsible for ensuring the performance and outcomes of urological cancer care.
2. Can this dashboard help improve treatment outcomes?
Yes. By tracking success rates, complications, and readmissions, care teams can identify best practices and areas needing improvement.
3. How does it support patient care quality?
It combines clinical outcome metrics with patient satisfaction and compliance data to provide a holistic view of care quality.
4. Is this dashboard useful for compliance?
Yes, because a urologic cancer care analytics and reporting dashboard supports governance, quality assurance, and compliance reporting.