
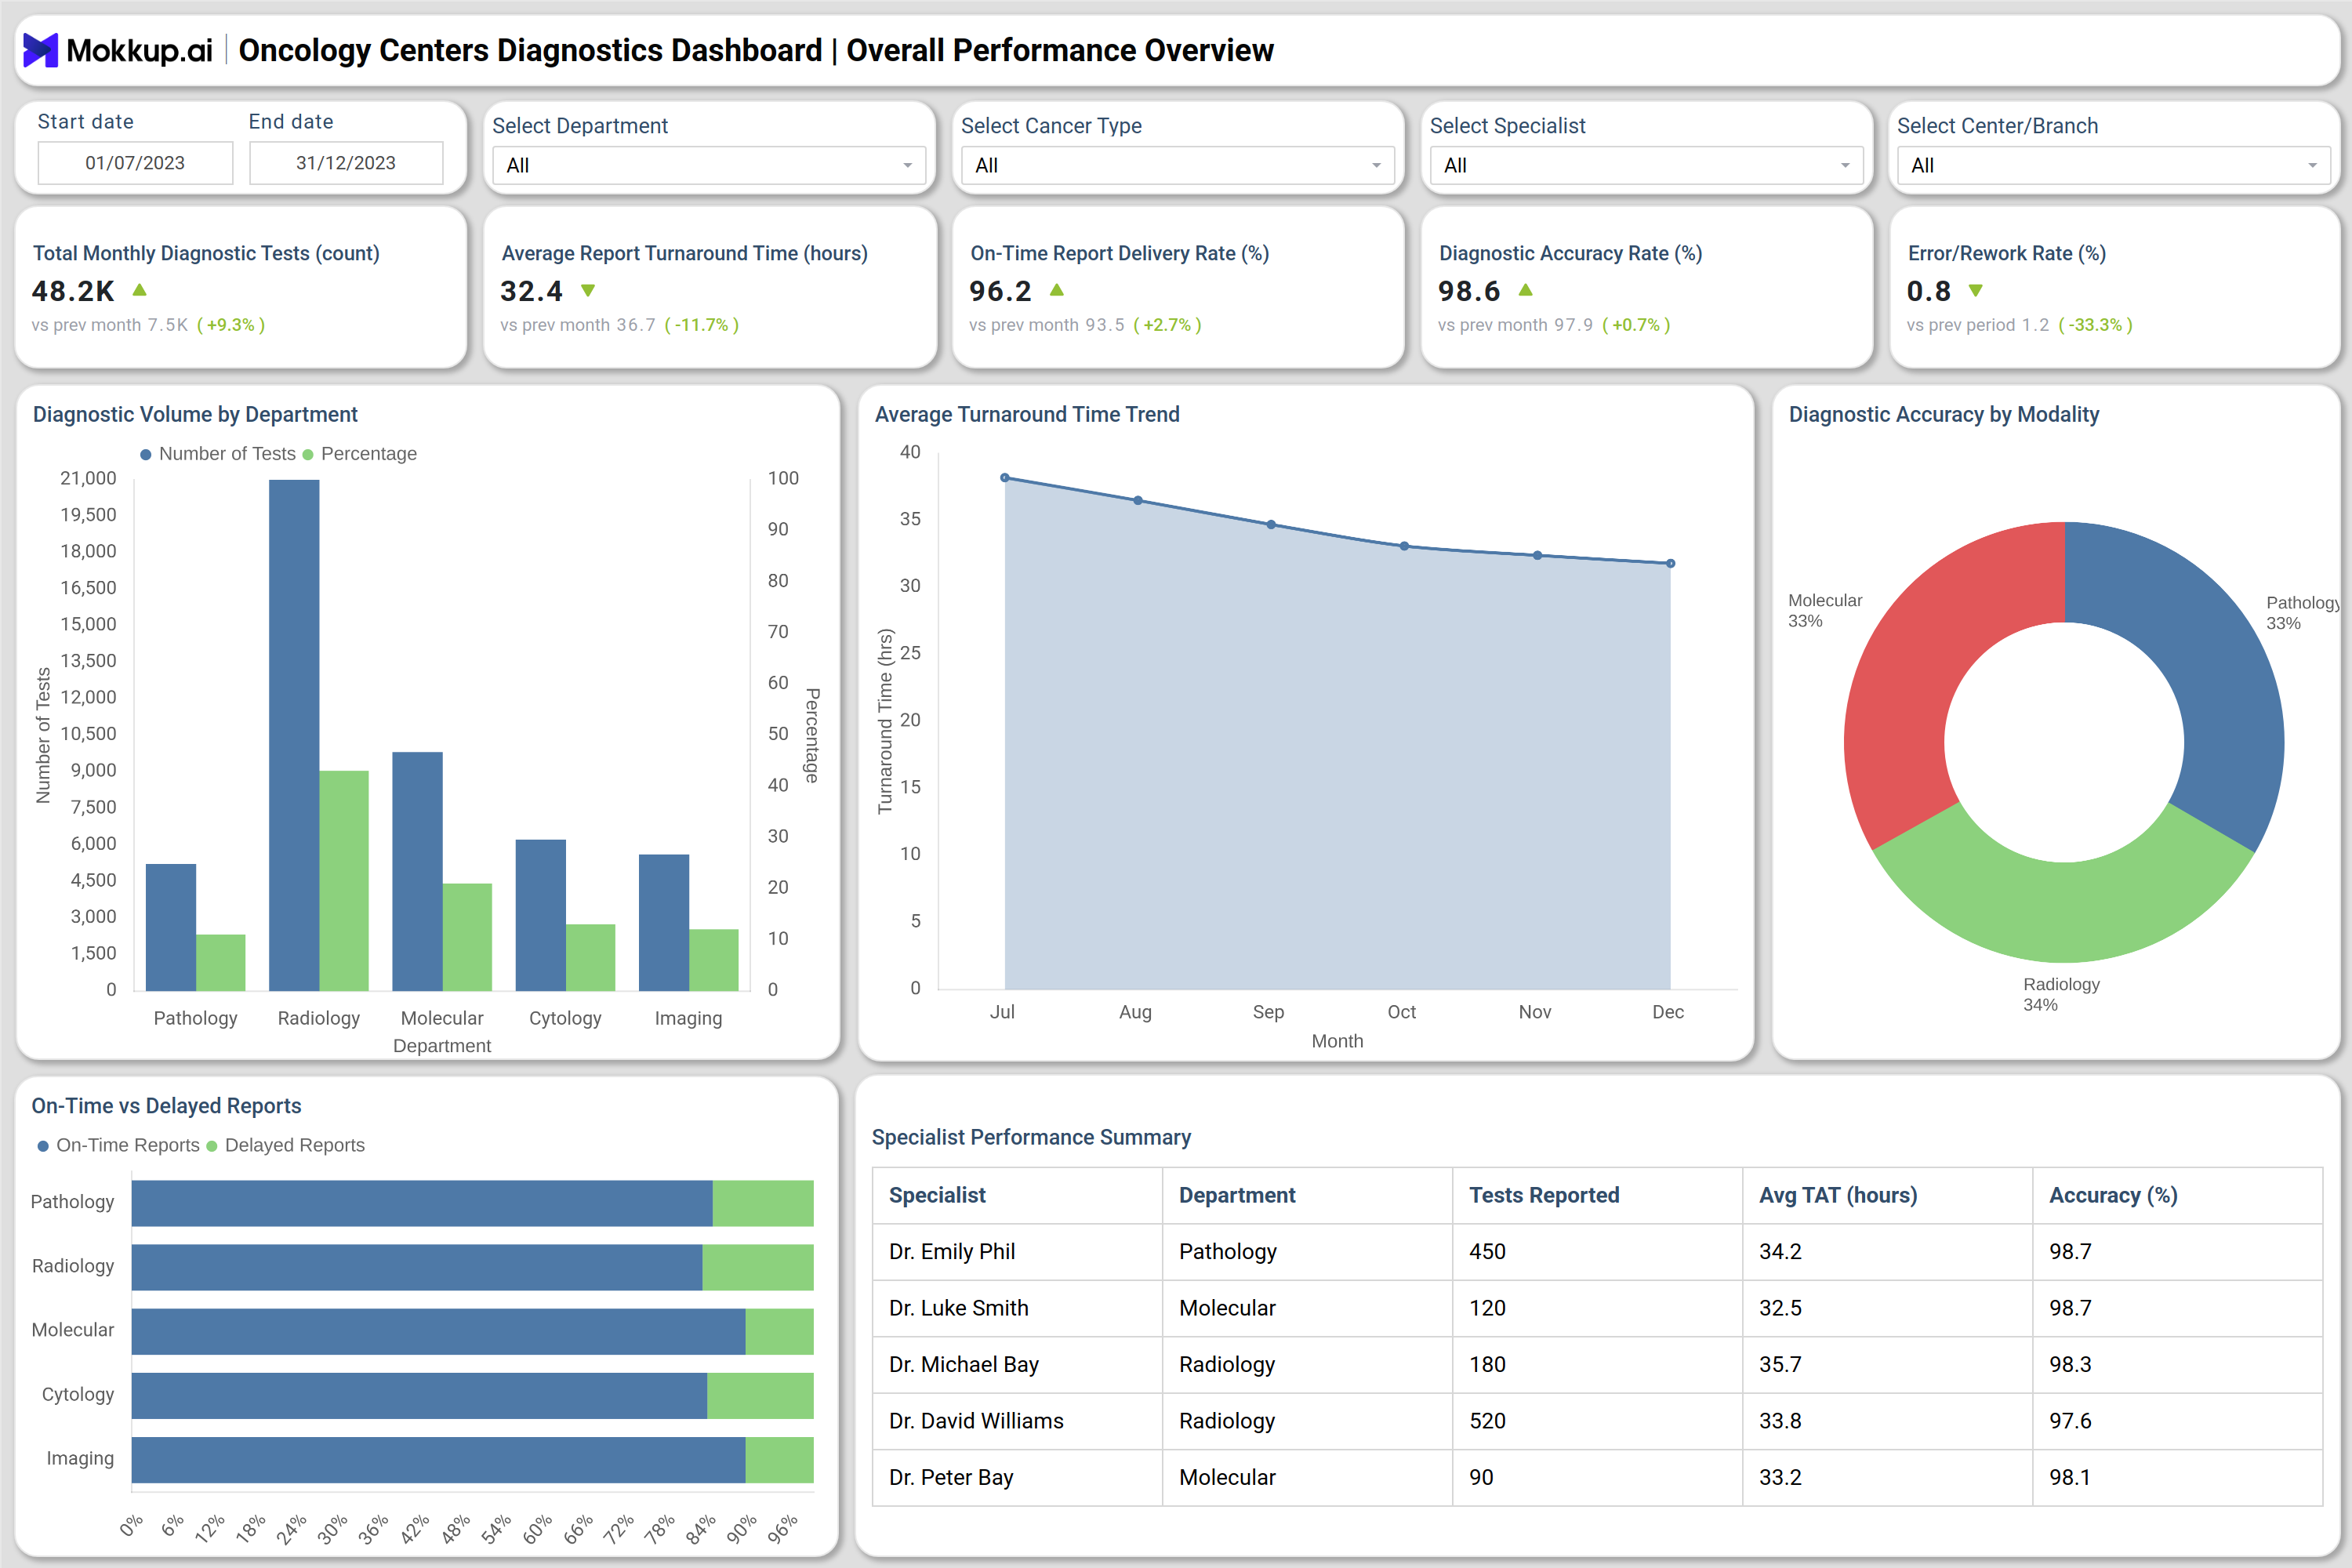
What is an Oncology Centers Diagnostics Dashboard?
An oncology center diagnostics performance dashboard is a specialized healthcare analytics platform designed to monitor, evaluate, and optimize cancer diagnostics operations. It brings together data from pathology, radiology, and molecular departments to help oncology teams measure performance, diagnostic accuracy, and turnaround time. This hospital oncology diagnostics analytics tool enables administrators and clinicians to analyze large volumes of diagnostic data to improve clinical efficiency and treatment outcomes. The dashboard provides detailed insights into test volumes, on-time reporting rates, rework percentages, and diagnostic precision, supporting data-driven decision-making in cancer care facilities.
How to Create an Oncology Centers Diagnostics Dashboard
You don’t need to build your report from scratch—just start with a ready-to-use dashboard template from Mokkup. Add in your data and export it however you like. Here’s how to do it:
1. Create or Log in to Your Mokkup Account
Start by signing up on Mokkup.ai using your email. If you already have an account, just log in, and you’ll be good to go.
2. Choose and Customize Your Dashboard Template
Find the Oncology Centers Diagnostics Dashboard template in the Templates section. Use the drag-and-drop editor to adjust KPIs, edit filters, or add elements based on your data.
3. Export to Your BI Tool
Once your dashboard wireframe is ready, use the BI Tool Export feature to send it directly to Power BI or Tableau for further analysis and enhancements. You can also download the dashboard as a PDF, PNG, or JPEG, embed it on a platform, or invite your team to collaborate.
Note: This is a Pro template. You’ll need a Pro subscription on Mokkup to use and customize this dashboard wireframe. Upgrade anytime to unlock full access.
Oncology Centers Diagnostics Dashboard Example
The Oncology Centers Diagnostics Dashboard visualizes key metrics, including total diagnostic tests, turnaround time, accuracy rate, and error percentage. It enables managers to evaluate department-level performance for pathology, molecular biology, cytology, and imaging. It focuses on mutation detection rates, test categories like NGS and PCR, and cross-tumor detection patterns. This view supports genomic medicine teams in identifying clinically significant mutations and improving testing consistency. This dashboard tracks imaging study volumes, scan turnaround times, and utilization rates across CT, MRI, and PET modalities. It measures departmental efficiency and highlights areas for operational improvement. Together, it serves as a unified oncology department efficiency tracking system, enabling oncology centers to deliver faster, more reliable, and higher-quality diagnostics that support timely cancer treatment decisions.
How to Analyze Data in Oncology Centers Diagnostics Dashboard
- Monitor diagnostic test volumes: Track the number of tests conducted by the department to understand capacity utilization and demand trends.
- Evaluate turnaround time performance: Review average report completion times to identify workflow delays and efficiency gaps.
- Track diagnostic accuracy: Measure error and rework rates to ensure diagnostic precision and compliance with clinical standards.
- Assess modality utilization: Examine how effectively imaging and molecular test modalities are used to balance resource allocation.
- Compare specialist performance: Evaluate individual doctor or technician performance based on case volume, turnaround time, and accuracy.
- Correlate mutation analysis data: In molecular diagnostics, analyze detection trends across cancer types for precision oncology insights.
- Visualize trends with dashboards: Use oncology treatment and diagnostics data visualization to uncover improvement areas through charts, trends, and KPIs.
Benefits of Oncology Centers Diagnostics Dashboard
- Streamlined diagnostics management: Centralizes cancer diagnostics operations across multiple departments for better coordination.
- Improved operational efficiency: Reduces turnaround time and error rates through data transparency and workflow monitoring.
- Enhanced diagnostic accuracy: Enables continuous quality tracking to maintain high accuracy standards.
- Informed resource planning: Provides insights into workload distribution, enabling better allocation of staff and equipment.
- Data-driven decision-making: Empowers oncology administrators with analytics for operational and clinical improvements.
- Supports personalized medicine: Tracks genetic mutation detection and molecular insights for tailored cancer therapies.
- Improved patient outcomes: Ensures faster and more accurate diagnostics that directly impact treatment effectiveness.
KPIs to Track in Oncology Centers Diagnostics Dashboard
- Total Diagnostic Tests Performed: Number of diagnostic tests conducted across all oncology departments.
- Average Turnaround Time (TAT): Measures efficiency in generating and delivering diagnostic reports.
- Diagnostic Accuracy Rate (%): Evaluates precision and reliability in test results.
- On-Time Report Delivery (%): Percentage of reports completed within the defined SLA.
- Error/Rework Rate (%): Indicates the proportion of tests requiring correction or repetition.
- Mutation Detection Rate (%): Percentage of molecular tests identifying clinically relevant mutations.
- Modality Utilization Rate (%): Utilization level of diagnostic equipment such as MRI, CT, or PET-CT.
- Specialist Performance Metrics: Monitors report counts, accuracy, and average turnaround time per specialist.
Frequently Asked Questions
1. What is the main purpose of an oncology center diagnostics performance dashboard?
It provides a centralized system to monitor diagnostic accuracy, operational efficiency, and test turnaround times in oncology centers.
2. How does a hospital oncology diagnostics analytics tool support clinical teams?
It offers visibility into test performance, department workloads, and accuracy trends, improving coordination and clinical outcomes.
3. Who can use the healthcare oncology diagnostic insights dashboard?
Oncology administrators, lab directors, pathologists, radiologists, and molecular specialists can use it for operational and clinical decision-making.