
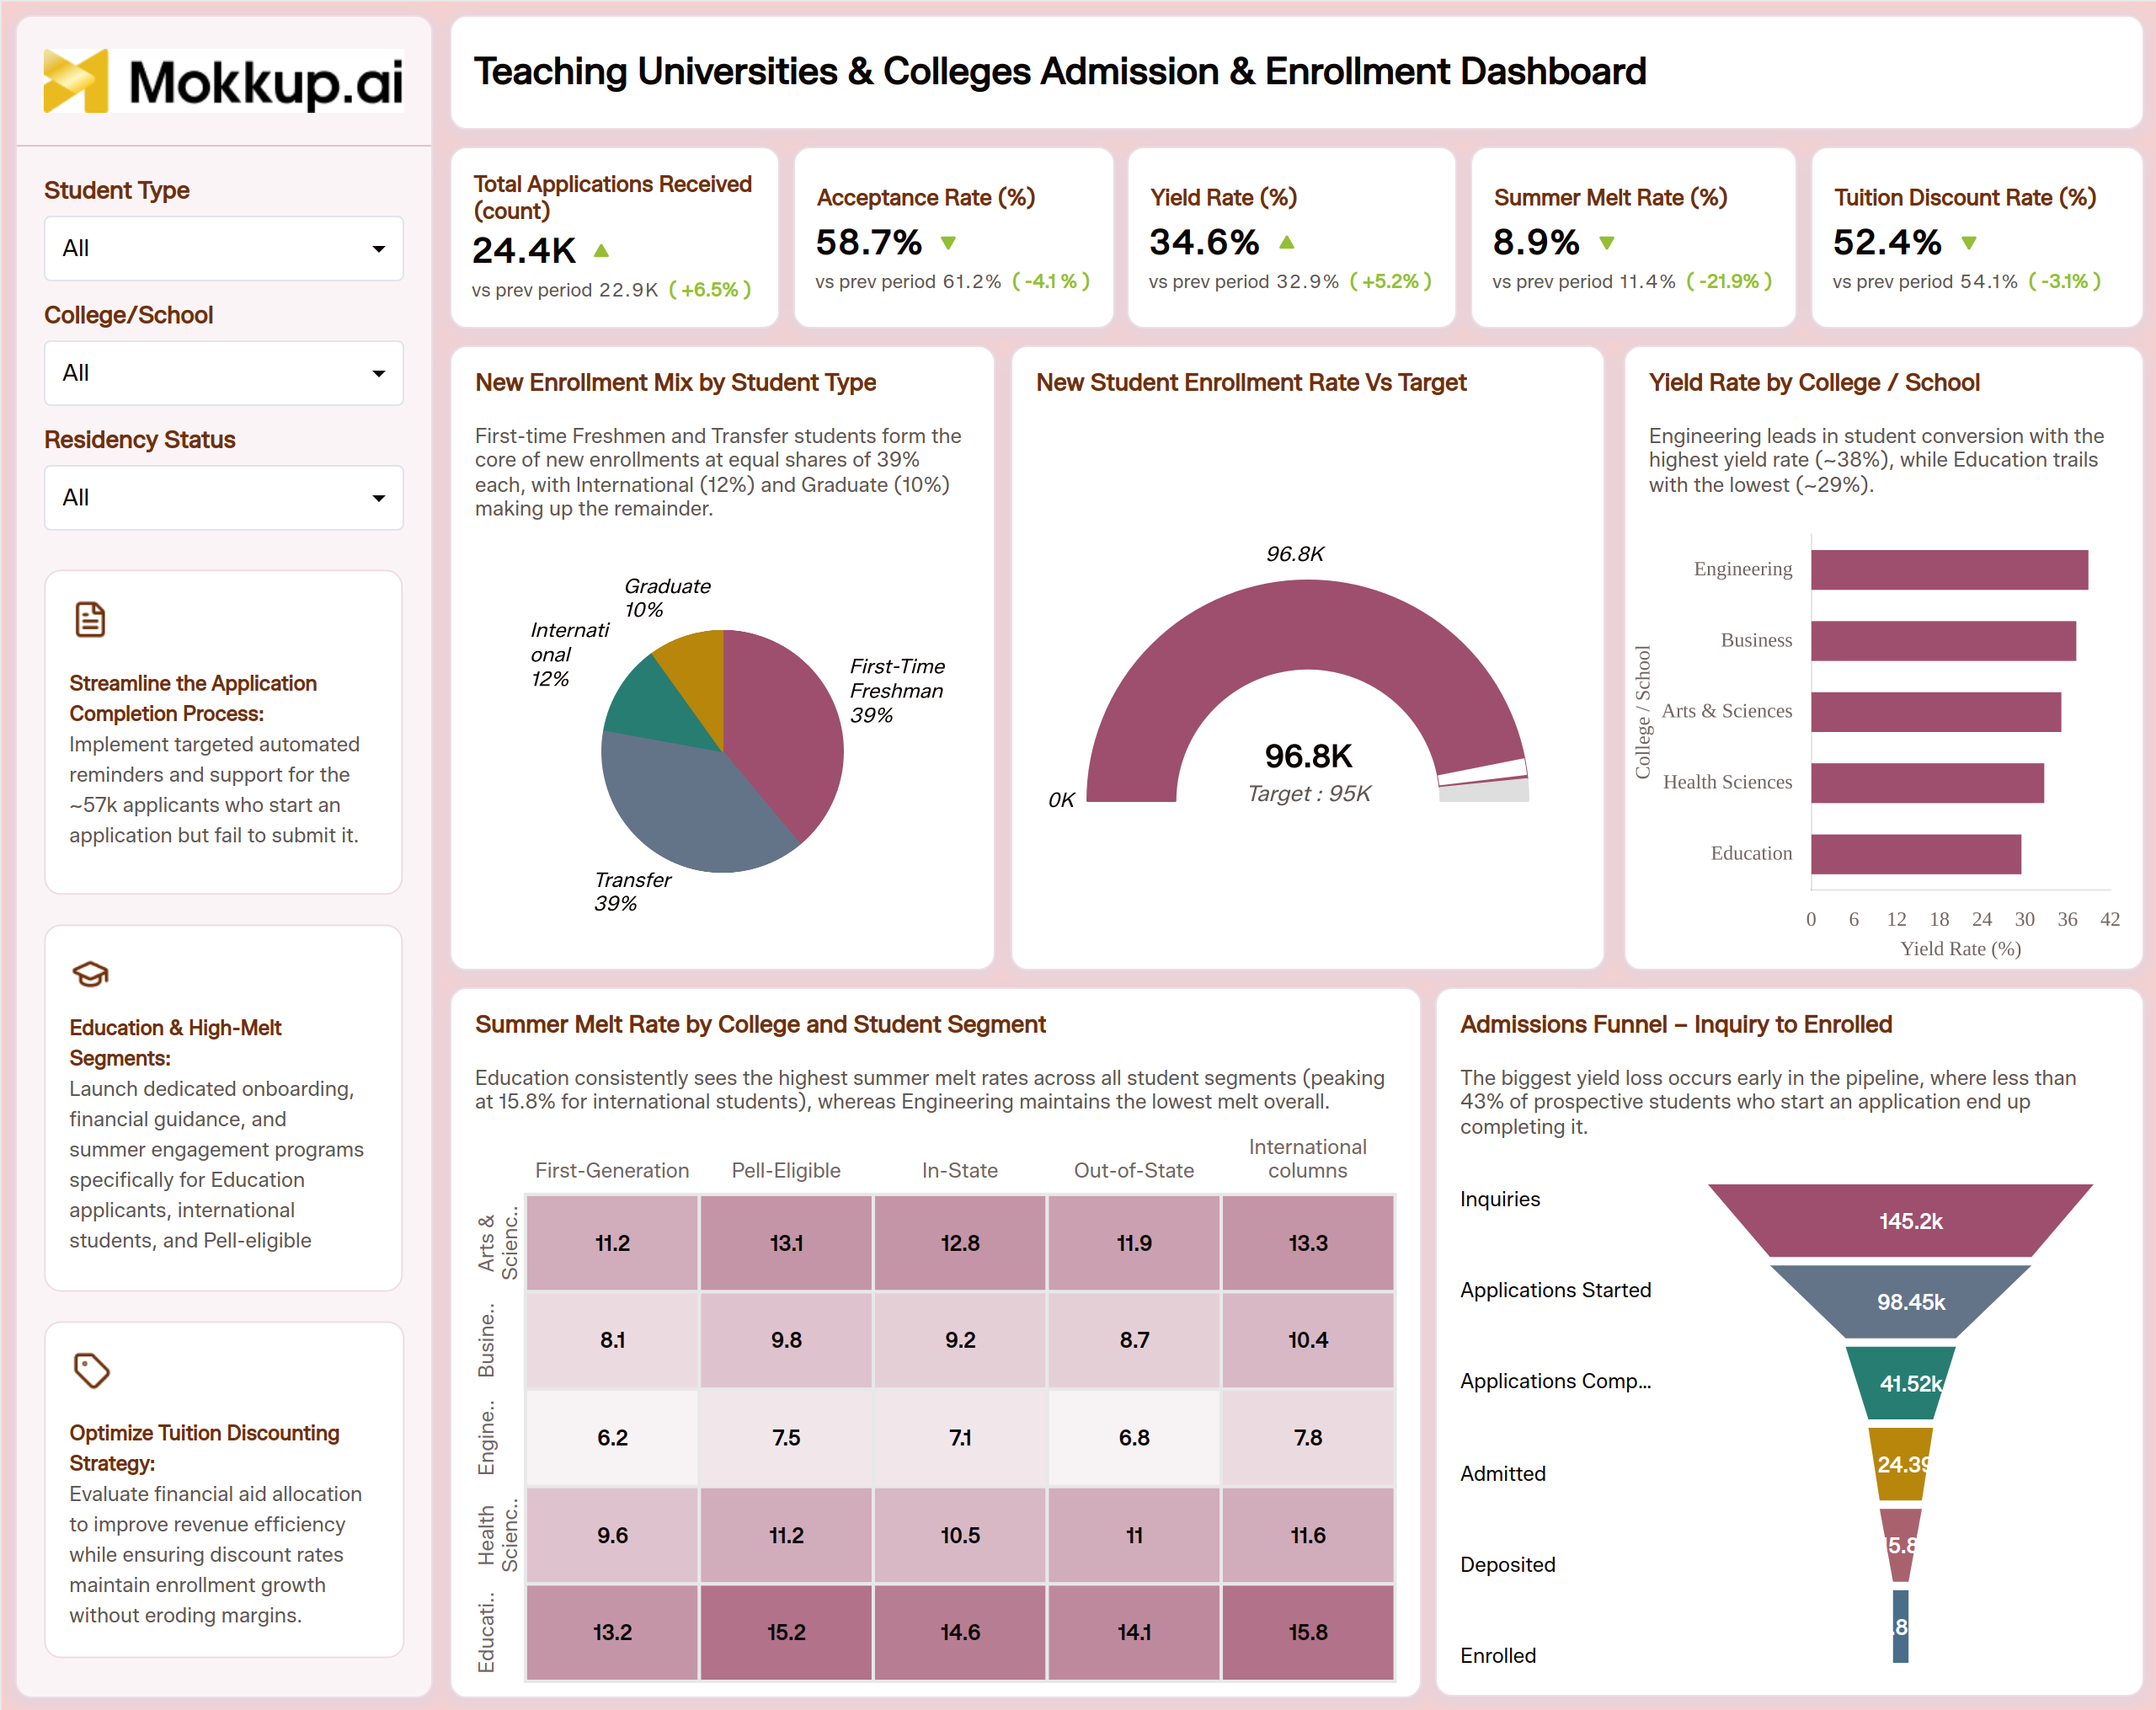
What is a Teaching Universities & Colleges Admission & Enrollment Dashboard?
A Teaching Universities & Colleges Admission & Enrollment Dashboard is a university admission and enrollment dashboard built for enrollment management teams, admissions directors, and institutional research offices that need one workspace covering the full path from inquiry to enrolled student. It tracks student yield rates for colleges by pairing yield with acceptance rate, summer melt rate, and tuition discount rate, so leadership can see conversion and cost side by side instead of pulling each number from a different report. Each KPI card compares the current value with the previous period. A short insight line on every chart explains the key pattern.
Filters for Student Type, college/school, and Residency Status let teams narrow into a specific applicant segment while keeping the full-funnel picture in view. Recommendation cards in the sidebar turn the findings into next steps, such as improving application completion, supporting high-melt segments, and refining tuition discounting. Because the dashboard also supports tuition discount rate monitoring alongside enrollment volume, financial aid and enrollment management offices can review the same numbers together instead of reconciling separate systems before every admissions committee meeting.
How to Create a Teaching Universities & Colleges Admission & Enrollment Dashboard
You don't need to build your report from scratch; just start with a ready-to-use dashboard template from Mokkup. Add in your data and export it however you like. Here's how to do it:
1. Create or Log in to Your Mokkup Account
Start by signing up on Mokkup.ai using your email. If you already have an account, just log in, and you'll be good to go.
2. Choose and Customize Your Dashboard Template
Find the Teaching Universities & Colleges Admission & Enrollment Dashboard template in the Templates section. Use the drag-and-drop editor to adjust KPIs, edit filters, or add elements based on your data.
3. Export to Your BI Tool
Once your dashboard wireframe is ready, use the BI Tool Export feature to send it directly to Power BI or Tableau for further analysis and enhancements. You can also download the dashboard as a PDF, PNG, or JPEG, embed it on a platform, or invite your team to collaborate.
Note: This is a Pro template. You'll need a Pro subscription on Mokkup to use and customize this dashboard wireframe. Upgrade anytime to unlock full access.
Teaching Universities & Colleges Admission & Enrollment Dashboard Example
An enrollment management team opens this university admission and enrollment dashboard at the start of a recruitment cycle to see where the funnel is gaining or losing prospective students before the next admissions committee meeting. Rather than pulling separate reports from the CRM and student information system, the team starts from one workspace. The KPI cards show at once whether applications, yield, and melt have improved since the last period. Admissions directors then use the Admissions Funnel, from Inquiries through Applications Started, Applications Completed, Admitted, Deposited, and Enrolled, for admissions funnel tracking from inquiry to enrollment and to pinpoint where the steepest drop-off happens.
Enrollment planners compare Yield Rate by College/School to see which programs convert admitted students best and which need more recruiting attention. They check the New Enrollment Mix by Student Type and New Student Enrollment Rate vs Target to confirm whether the incoming class is on track. When melt climbs for a particular segment, the team runs a summer melt rate analysis for universities using the heatmap across first-generation, Pell-eligible, in-state, out-of-state, and international students to decide where targeted outreach or aid makes the most sense.
The recommendation cards then turn these findings into clear next steps. The result is a shared, current picture that lets admissions, enrollment management, and financial aid teams make coordinated decisions. It helps the institution hit its incoming class targets without over-discounting tuition or losing admitted students to summer melt.
How to Analyze Data in a Teaching Universities & Colleges Admission & Enrollment Dashboard
Here is how you can analyze data from this dashboard:
- Apply Filters First: Filter by Student Type, College/School, and Residency Status to isolate the segments driving performance shifts.
- Read Period-over-Period KPI Changes: Compare Total Applications Received and other KPIs with the previous period to gauge demand and conversion. For Summer Melt Rate and Tuition Discount Rate, a decrease is usually a positive sign.
- Find Funnel Drop-Off: Review the Admissions Funnel stage by stage, from Inquiries to Enrolled, using admissions funnel tracking from inquiry to enrollment to find the biggest drop-off point.
- Compare Yield and Enrollment Mix: Cross-reference Yield Rate by College/School with New Enrollment Mix by Student Type for new enrollment mix tracking by student type and to prioritize recruiting effort.
- Spot High-Melt Segments: Use the Summer Melt Rate by College and Student Segment heatmap for a summer melt rate analysis for universities that flags cohorts needing outreach before term start.
- Check the Enrollment Target: Track the New Student Enrollment Rate vs Target to confirm whether the incoming class will meet its goal.
- Balance Aid and Selectivity: Monitor the tuition discount rate alongside the acceptance rate to keep aid spent in line with the enrollment strategy.
- Act on Recommendations: Use the sidebar recommendation cards to turn the insights into next steps for applications, high-melt segments, and tuition discounting.
Benefits of a Teaching Universities & Colleges Admission & Enrollment Dashboard
The following are the benefits of using this dashboard:
- Consolidated Admissions View: Replaces manual spreadsheet reconciliation with one consolidated admissions and enrollment view.
- Clear Performance Direction: Previous-period comparisons on every KPI show at a glance whether admissions results are improving.
- Early Drop-Off Detection: Brings out funnel drop-off points early enough for teams to act before the class closes.
- Aid Strategy Alignment: Supports tuition discount rate monitoring for colleges, so aid strategy stays tied to enrollment goals.
- Comparable Yield Benchmarks: Gives every college or school a comparable yield benchmark, useful as a student yield rate tracking tool for colleges.
- Melt Risk Alerts: Flags rising melt in specific student segments, so retention teams can respond before deposits are lost.
- Built-In Next Steps: Recommendation cards give leadership clear actions without extra analysis.
- Faster Committee Reviews: Filters built for student type and residency status speed up admissions committee reviews.
- Shared Numbers: Keeps recruiting, financial aid, and enrollment management working from the same numbers.
KPIs to Track in a Teaching Universities & Colleges Admission & Enrollment Dashboard
The following key KPIs can be tracked by using this dashboard:
- Total Applications Received (count): overall application volume for the cycle, compared with the previous period.
- Acceptance Rate (%): share of applicants offered admission, showing how selective the cycle is running.
- Yield Rate (%): share of admitted students who enroll, the core metric behind any student yield rate tracking tool for colleges.
- Summer Melt Rate (%): share of deposited students who fail to show up for the term, flagging where retention outreach is needed. A decrease compared with the previous period is a positive sign.
- Tuition Discount Rate (%): average share of tuition revenue given back as institutional aid, central to tuition discount rate monitoring for colleges.
- New Student Enrollment vs Target: new student enrollment compared with the cycle’s target, shown as a gauge.
Frequently Asked Questions
1. What is a Teaching Universities & Colleges Admission & Enrollment Dashboard used for?
It gives admissions and enrollment management teams one view of applications, acceptance, yield, and melt so they can track the incoming class from inquiry to enrollment. Teams use it to spot funnel drop-off, compare program-level yield, and act on melt risk before term start.
2. How is Yield Rate different from Acceptance Rate?
Acceptance Rate measures how many applicants are offered admission, while Yield Rate measures how many of those admitted students actually enroll. Tracking both together shows whether an admit strategy is converting into a filled incoming class.
3. Can I customize this university admission and enrollment dashboard for my institution?
Yes. Start from the Mokkup template, adjust the KPIs, filters, and charts to match your own data, and export the finished wireframe to Power BI or Tableau.