
What is a Specialized Program School Enrollment Dashboard?
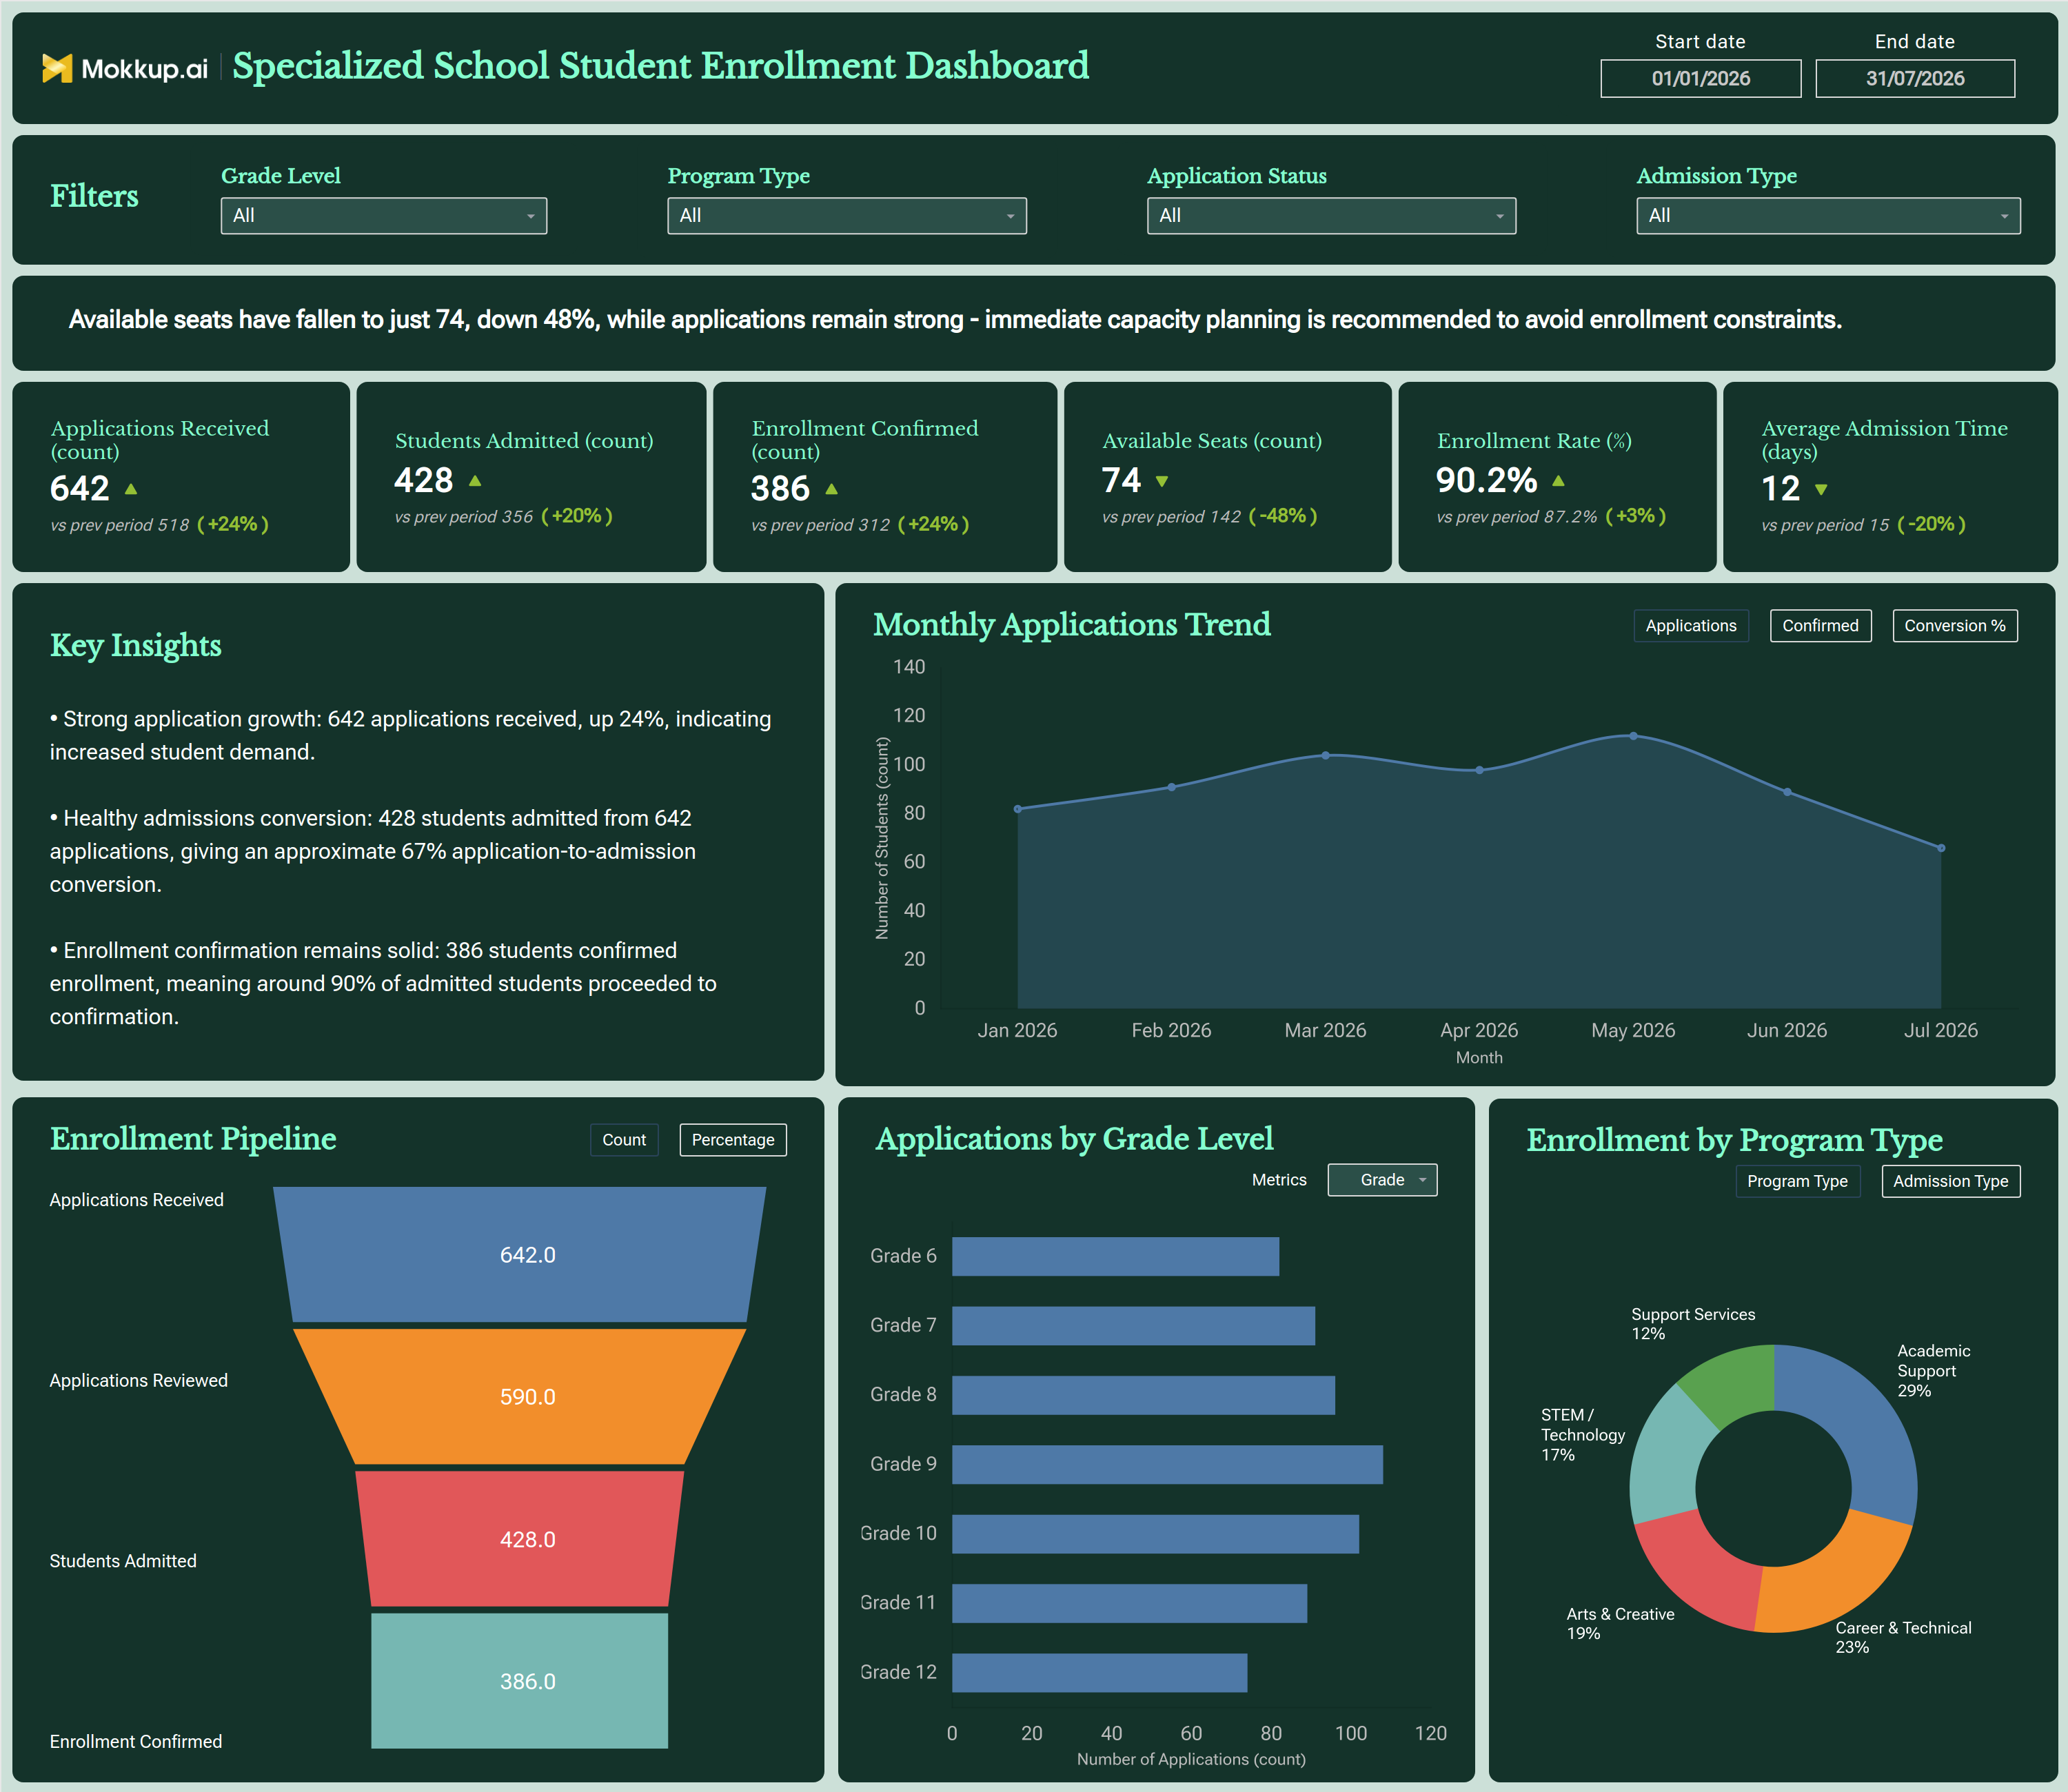
The Specialized Program School Enrollment Dashboard is a student enrollment dashboard template for admissions teams and school administrators who manage applications across multiple grade levels and specialized programs. It brings the full admissions funnel into one view through an enrollment pipeline tracking dashboard, so coordinators, program directors, and school leadership can follow how prospective students move from application to confirmed seat. Filters for start and end date, grade level, program type, application status, and admission type let staff isolate performance for a specific cohort or track without digging through spreadsheets.
Each KPI card compares the current value with the previous period and shows the % change. An alert banner flags urgent issues such as falling seat availability, and a Key Insights panel sums up application growth, admission conversion, and enrollment confirmation in plain language. By combining pipeline visibility with a school program enrollment distribution view across tracks such as Academic Support, STEM/Technology, and Career & Technical, this dashboard gives specialized schools a structured way to evaluate capacity, demand, and admissions efficiency in one place.
How to Create a Specialized Program School Enrollment Dashboard
You don't need to build your report from scratch; just start with a ready-to-use dashboard template from Mokkup. Add in your data and export it however you like. Here's how to do it:
1. Create or Log in to Your Mokkup Account
Start by signing up on Mokkup.ai using your email. If you already have an account, just log in, and you'll be good to go.
2. Choose and Customize Your Dashboard Template
Find the Specialized Program School Enrollment Dashboard template in the Templates section. Use the drag-and-drop editor to adjust KPIs, edit filters, or add elements based on your data.
3. Export to Your BI Tool
Once your dashboard wireframe is ready, use the BI Tool Export feature to send it directly to Power BI or Tableau for further analysis and enhancements. You can also download the dashboard as a PDF, PNG, or JPEG, embed it on a platform, or invite your team to collaborate.
Note: This is a Pro template. You'll need a Pro subscription on Mokkup to use and customize this dashboard wireframe. Upgrade anytime to unlock full access.
Specialized Program School Enrollment Dashboard Example
An admissions director at a specialized school opens this dashboard during the enrollment cycle to see how applications are turning into confirmed seats across grade levels and programs. The alert banner flags the most urgent issue first, such as available seats dropping sharply while applications stay strong. The KPI cards and Key Insights panel then show whether applications, admissions and confirmations are up on the previous period.
The Enrollment Pipeline funnel, viewed by count or percentage, works as a student application tracking dashboard. It follows every submission through review, admission, and final confirmation, so staff can see exactly where drop-off happens and step in before the enrollment window closes. The Monthly Applications Trend can switch between applications, confirmed enrollments, and conversion %. This tells planners whether outreach is turning into filled seats or whether interest is cooling as the cycle goes on.
Using the grade level, program type, and admission type views, staff can follow up with families in lagging grades and confirm that high-demand tracks such as STEM/Technology or Career & Technical have enough seats. Ultimately, this enrollment pipeline tracking dashboard helps admissions teams move from reactive record-keeping to proactive planning. Every stakeholder stays aligned on where the school stands against its enrollment targets.
How to Analyze Data in a Specialized Program School Enrollment Dashboard
Here is how you can analyze data from this dashboard:
- Set the Admissions Cycle: Adjust the Start date and End date range to focus on a specific admissions cycle.
- Filter by Grade Level: Isolate application and enrollment trends for a specific grade.
- Filter by Program Type: Compare demand across Academic Support, Career & Technical, Arts & Creative, STEM/Technology, and Support Services.
- Filter by Application Status: Review where applications currently stand in the process.
- Filter by Admission Type: Compare performance across different admission routes.
- Start with the Alert and Key Insights: Read the alert banner and Key Insights panel first for the most urgent issue and a quick summary of conversion performance.
- Read Period-over-Period KPI Changes: Check the "vs prev period" value and % change on each KPI card. For Available Seats, a sharp drop signals a capacity risk. For Average Admission Time, a drop is a positive sign.
- Find Pipeline Drop-Off: Use the Enrollment Pipeline funnel, the core of this enrollment pipeline tracking dashboard, and switch between Count and Percentage to find where the largest drop-off occurs.
- Track Monthly Trends: Use the Monthly Applications Trend and switch between Applications, Confirmed, and Conversion % to compare submission volume with confirmed seats over time.
- Compare Grades: Check the Applications by Grade Level chart, with its Metrics dropdown, for grade level enrollment analysis of which grades generate the most applications.
- Review Enrollment Mix: Use the Enrollment by Program Type donut, and switch to Admission Type to assess school program enrollment distribution.
Benefits of a Specialized Program School Enrollment Dashboard
The following are the benefits of using this dashboard:
- Centralized Admissions View: Brings applications, admissions, and confirmed enrollment data together in one specialized school admission rate tracking view.
- Less Manual Reconciliation: Works as a student application tracking dashboard that removes the need to reconcile admissions spreadsheets by hand.
- Early Capacity Alerts: The alert banner flags capacity risks, such as falling seat availability, before they become urgent.
- Ready-Made Insights: The Key Insights panel sums up application growth, conversion, and confirmation for quick leadership updates.
- Pipeline Bottleneck Detection: Brings out bottlenecks in the enrollment pipeline before they affect seat availability.
- Grade and Program Analysis: Gives program directors clear grade-level enrollment analysis by grade, program type, and admission type.
- Capacity Planning: Supports capacity planning by comparing available seats with confirmed enrollment.
- Faster Admissions: Helps admissions staff track how quickly applications move from submission to confirmation.
- Shared Performance View: Gives leadership a shared, up-to-date view of enrollment performance against previous periods.
KPIs to Track in a Specialized Program School Enrollment Dashboard
The following key KPIs can be tracked by using this dashboard:
- Applications Received (count): Tracks total student applications submitted, the starting point for any grade level enrollment analysis.
- Students Admitted (count): Measures how many applicants were offered admission after review.
- Enrollment Confirmed (count): Tracks how many admitted students finalized their seat, showing true conversion.
- Available Seats (count): remaining capacity across grades and programs for ongoing planning. A sharp fall compared with the previous period signals a need for capacity planning.
- Enrollment Rate (%): share of admitted students who confirm enrollment, a core measure for specialized school admission rate tracking.
- Average Admission Time (days): how long it takes to move an application from submission to an admission decision. A decrease means faster admissions.
Frequently Asked Questions
1. What is the Specialized Program School Enrollment Dashboard used for?
It helps admissions teams at Specialized schools use a student enrollment dashboard template to track applications, admissions, and confirmed enrollment across grade levels and programs. Administrators use it to spot pipeline bottlenecks and plan seat capacity for each admissions cycle.
2. Can this dashboard track enrollment across different program types?
Yes. The Program Type filter lets users compare enrollment across tracks such as Academic Support, STEM/Technology, Career & Technical, Arts & Creative and Support Services. The Enrollment by Program Type chart shows each track's share of total enrollment and can also switch to an Admission Type view.
3. Does the dashboard support school program enrollment distribution analysis by grade?
Yes. The Applications by Grade Level chart shows how applications vary from Grade 6 through Grade 12, and the Grade Level filter applies the same view to every other chart. This helps administrators find which grades need more outreach or capacity planning.