
What Is a Taxi Fare & Demand Intelligence Dashboard?
A Taxi Fare & Demand Intelligence Dashboard is a data-driven analytics tool designed for ride-hailing operators, taxi fleet managers, and urban mobility businesses. It consolidates fare pricing trends, demand patterns, trip utilization, and revenue metrics into a single interface. By analyzing historical and predictive data, this dashboard helps businesses optimize pricing strategies, improve fleet efficiency, and maximize profitability. Unlike traditional reporting tools, a taxi fare prediction dashboard for fleet managers provides actionable insights on peak demand periods, high revenue zones, and fare elasticity. Fleet operators can adjust pricing dynamically, allocate drivers efficiently, and reduce idle time, leading to better resource utilization and higher earnings.
How to Create a Taxi Fare & Demand Intelligence Dashboard
You don't need to build your report from scratch, just start with a ready to use dashboard template from Mokkup. Add in your data and export it however you like. Here's how to do it:
1. Create or Log in to Your Mokkup Account
Start by signing up on Mokkup.ai using your email. If you already have an account, just log in, and you'll be good to go.
2. Choose and Customize Your Dashboard Template
Find the Taxi Fare & Demand Intelligence Dashboard template in the Templates section. Use the drag and drop editor to adjust KPIs, edit filters, or add elements based on your data.
3. Export to Your BI Tool
Once your dashboard wireframe is ready, use the BI Tool Export feature to send it directly to Power BI or Tableau for further analysis and enhancements. You can also download the dashboard as a PDF, PNG, or JPEG, embed it on a platform, or invite your team to collaborate.
Note: This is a Pro template. You'll need a Pro subscription on Mokkup to use and customize this dashboard wireframe. Upgrade anytime to unlock full access.
Taxi Fare & Demand Intelligence Dashboard Example
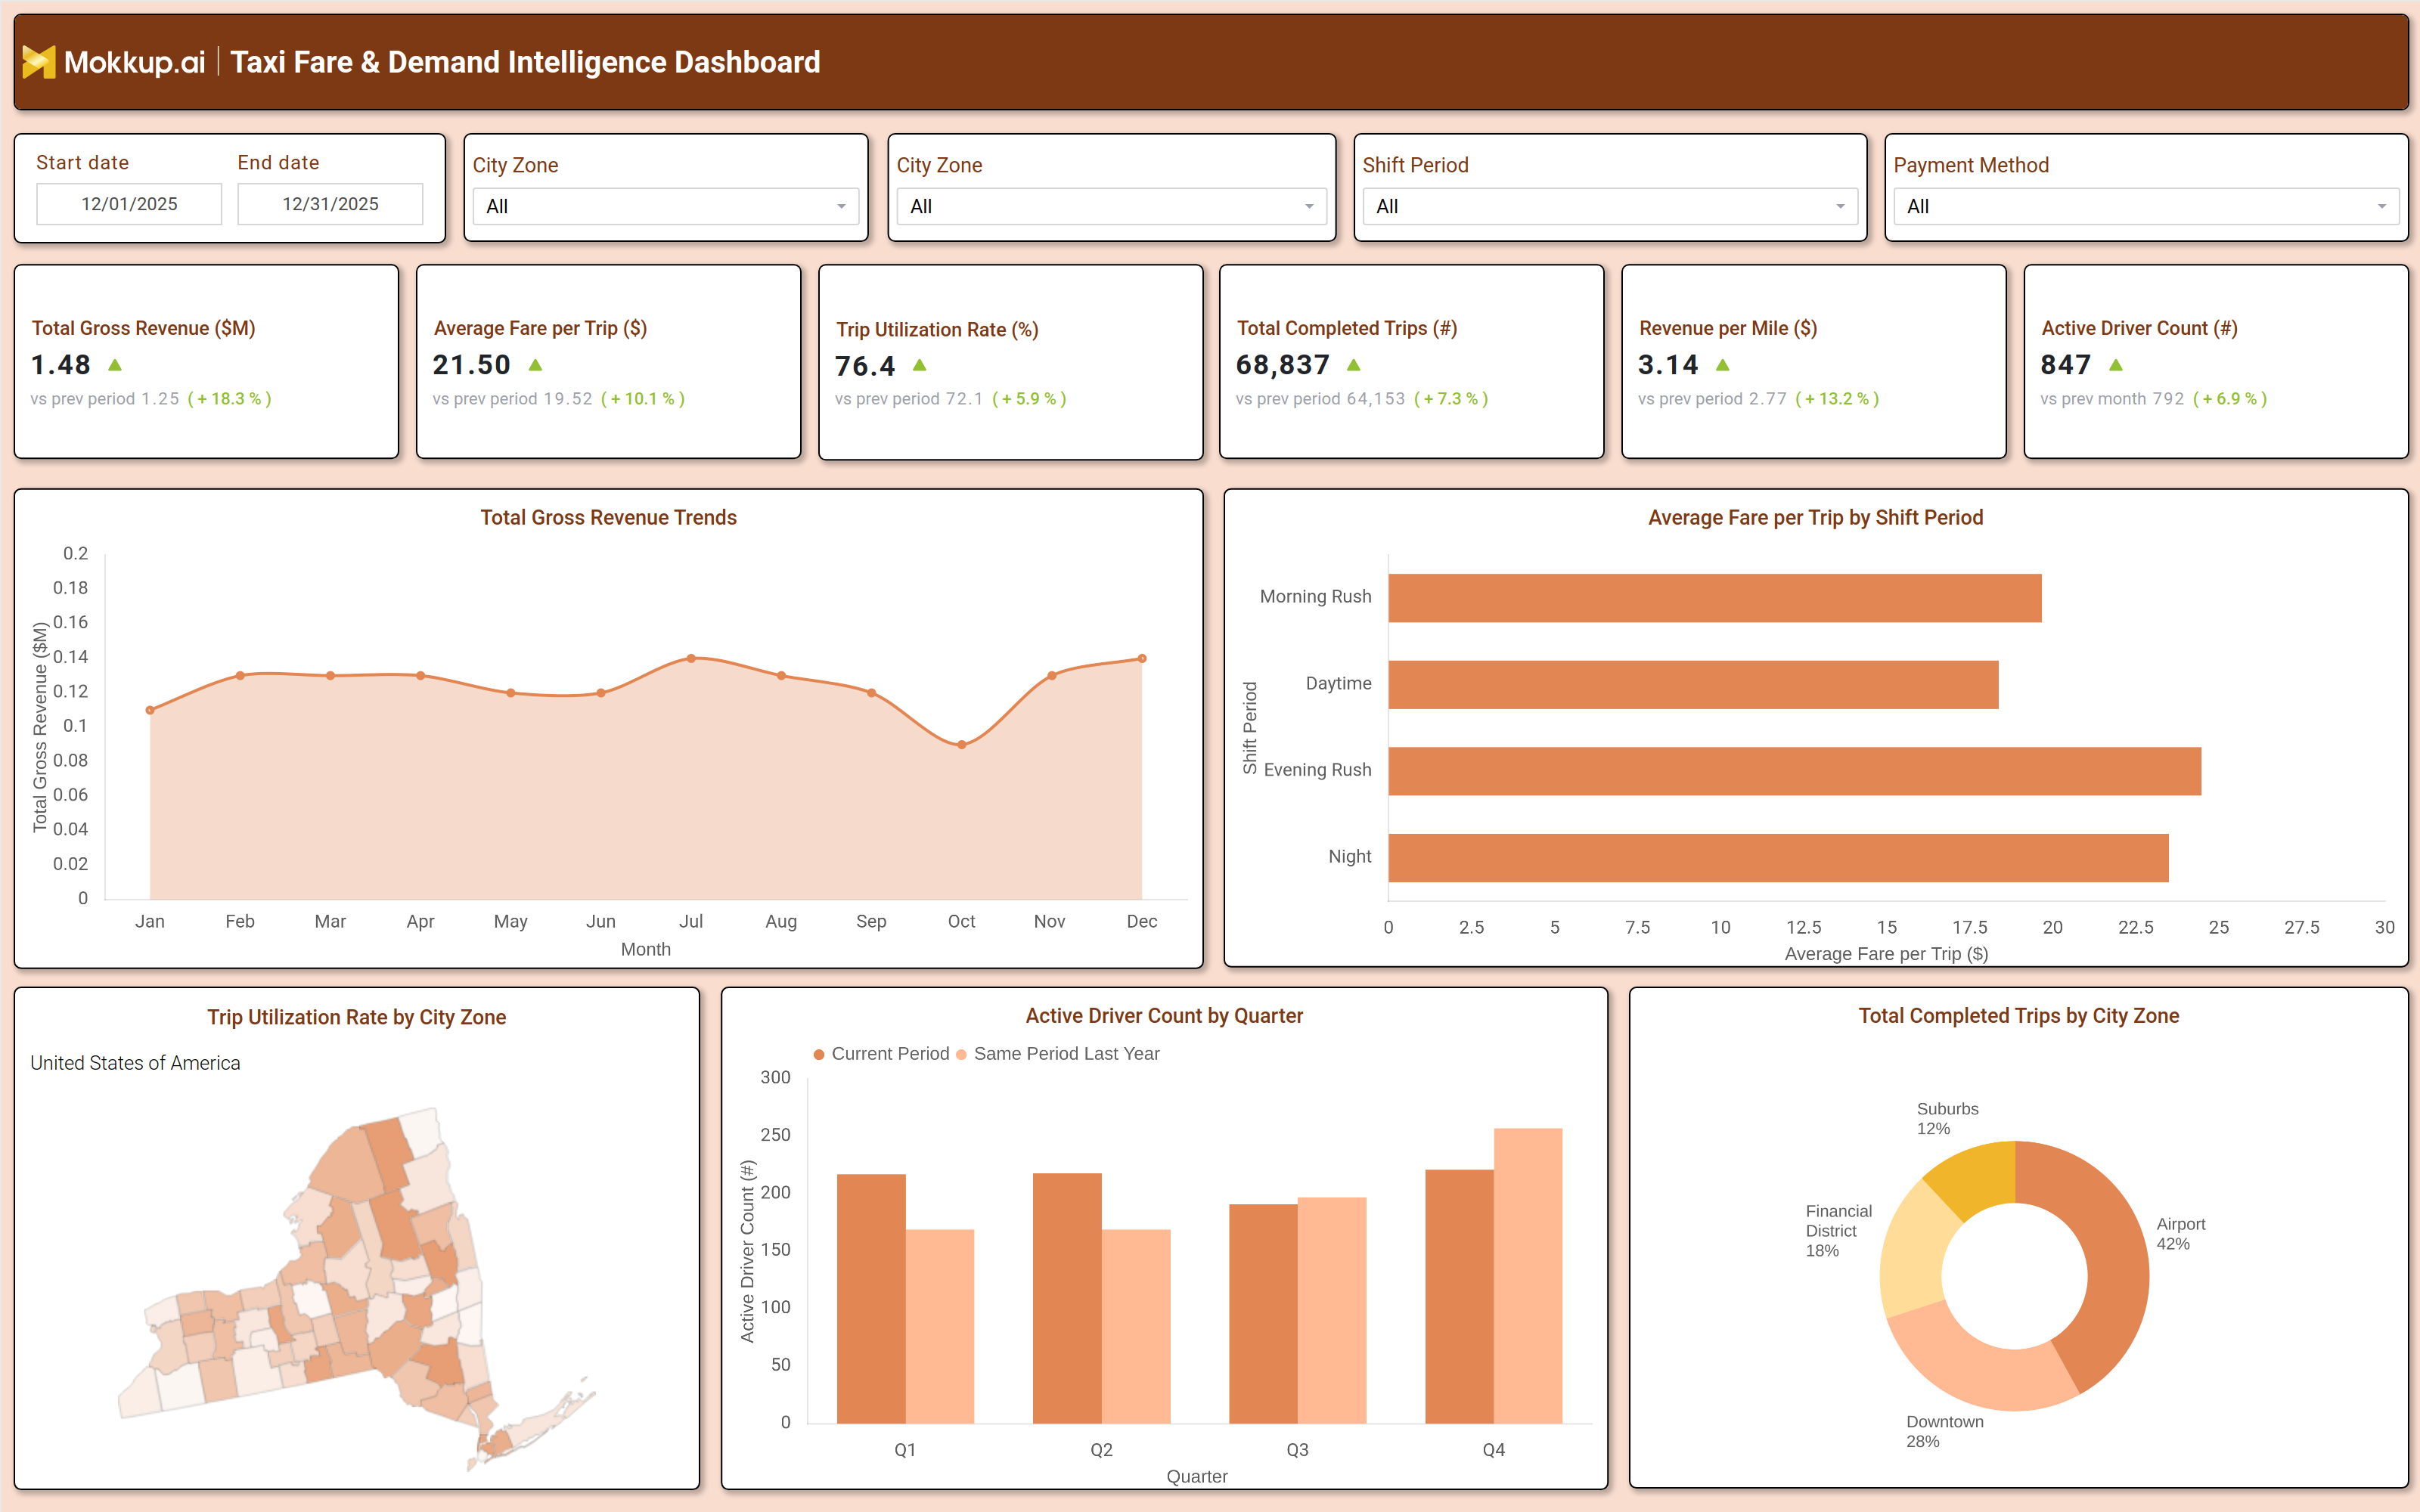
A well-designed trip utilization rate dashboard includes interactive filters for date ranges, city zones, shift periods, and payment methods. Key performance tiles display total gross revenue, average fare per trip, trip utilization rate, completed trips, revenue per mile, and active driver count, all compared against previous periods for trend analysis. Visualizations like monthly revenue trends, shift-based fare comparisons, and city zone demand distribution help operators identify high-yield opportunities. For example, the dashboard may reveal that evening rush hours generate 30% higher fares than daytime shifts, allowing fleet managers to adjust driver schedules accordingly. A geospatial heatmap highlights high-demand zones (e.g., downtown, airports, financial districts), enabling smarter driver deployment. Additionally, active driver count by quarter and trip completion breakdowns provide insights into workforce efficiency, helping businesses scale operations during peak seasons.
How to Analyze Data in a Taxi Fare & Demand Intelligence Dashboard
Here is how you can analyze data from this shift-based fare trends dashboard:
- Track total gross revenue trends to identify seasonal demand fluctuations and revenue growth opportunities.
- Monitor average fare per trip to assess pricing effectiveness and adjust surge pricing strategies.
- Analyze trip utilization rates to determine fleet efficiency and reduce idle time.
- Compare completed trips across city zones to prioritize high-demand areas for driver allocation.
- Review revenue per mile to optimize route planning and minimize unprofitable trips.
- Assess active driver count trends to ensure workforce capacity matches demand.
- Break down fares by shift period (morning, evening, night) to align pricing with peak demand.
- Use payment method insights to refine cashless transaction strategies and reduce payment friction.
Benefits of a Taxi Fare & Demand Intelligence Dashboard
The following are the benefits of using this dashboard:
- Optimizes Fare Pricing: Uses data-driven insights to improve fare pricing strategies and increase revenue generated per trip.
- Improves Fleet Efficiency: Identifies high-demand zones and reduces vehicle idle time to maximize fleet utilization and operational performance.
- Enhances Driver Allocation: Matches driver availability with passenger demand to improve service coverage and reduce wait times.
- Reduces Operational Costs: Minimizes unprofitable trips and optimizes route planning to improve cost efficiency across operations.
- Supports Dynamic Pricing Strategies: Enables real-time pricing adjustments during peak demand periods to maximize earnings and profitability.
- Provides Competitive Intelligence: Analyzes fare trends and market benchmarks to help businesses stay competitive within the transportation industry.
- Enables Data-Driven Fleet Expansion: Supports strategic decisions for fleet growth and scaling based on demand patterns and operational analytics.
KPIs to Track in a Taxi Fare & Demand Intelligence Dashboard
The following key KPIs can be tracked by using this dashboard:
- Total Gross Revenue ($M): Measures overall earnings from taxi operations.
- Average Fare per Trip ($): Indicates pricing effectiveness and customer willingness to pay.
- Trip Utilization Rate (%): Shows how efficiently the fleet is being used.
- Total Completed Trips (count): Tracks operational volume and demand trends.
- Revenue per Mile ($): Evaluates profitability per distance traveled.
- Active Driver Count (count): Monitors workforce capacity and availability.
Frequently Asked Questions
1. How does a taxi fare intelligence dashboard improve fleet management?
It provides data-driven insights on demand patterns, fare trends, and driver efficiency, helping operators optimize pricing and resource allocation.
2. What data sources feed into a ride-hailing demand analytics dashboard?
Trip logs, fare records, GPS tracking, payment systems, and driver performance metrics.
3. Can this fleet management revenue dashboard help with dynamic pricing?
Yes, by analyzing demand trends and fare elasticity, it enables surge pricing adjustments for maximum revenue.