
What is a Stormwater Utility Smart Leak Detection & Control Dashboard?
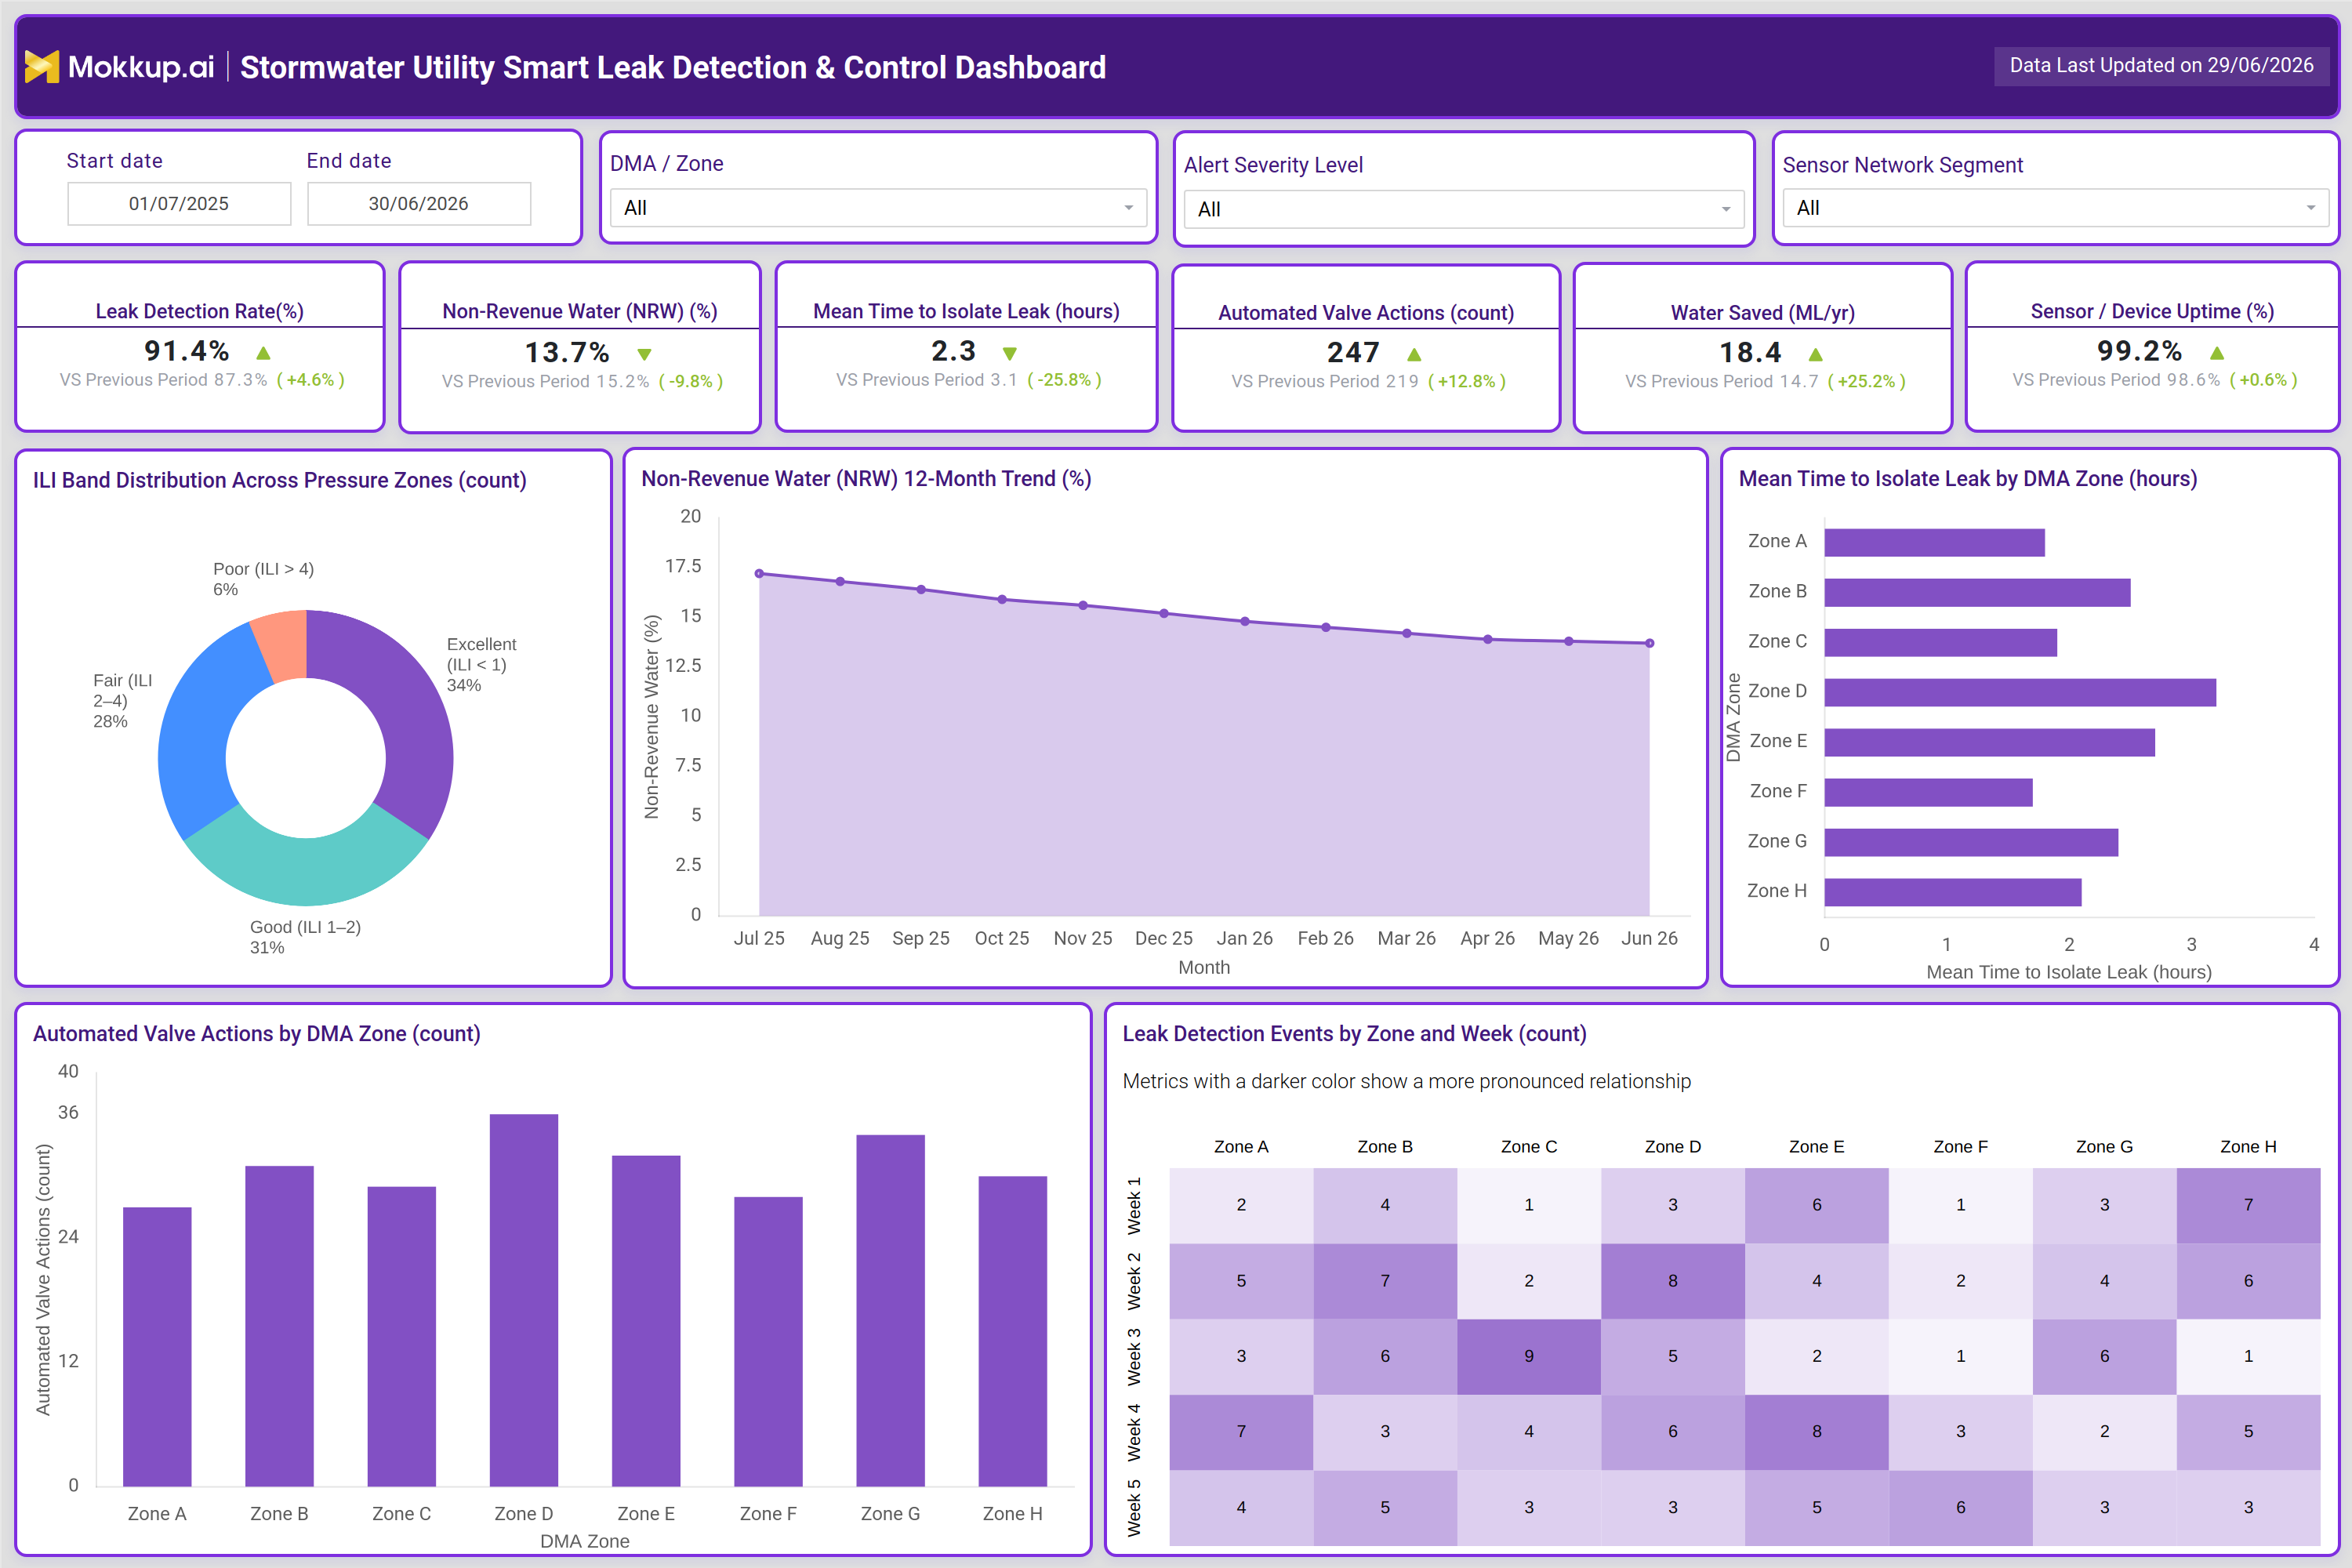
The Stormwater Utility Smart Leak Detection & Control Dashboard is a purpose-built analytics template for water utility managers, infrastructure engineers, and network operations teams who need a structured view of their leak detection and pressure zone performance. It centralizes data across sensor networks, DMA zones, and operational controls into a single screen, giving teams a clear picture of where leaks are occurring, how fast they are being isolated, and how much non-revenue water is being lost across the network. The dashboard tracks core operational indicators such as leak detection rate, mean time to isolate leaks, automated valve actions, sensor uptime, and water saved, alongside trend and distribution charts that show how these figures shift over time and across geographic zones. This stormwater utility leak detection dashboard template is designed for teams that need to move from detection to action without switching between systems or waiting for manual reports.
How to Create a Stormwater Utility Smart Leak Detection & Control Dashboard
You don't need to build your report from scratch, just start with a ready-to-use dashboard template from Mokkup. Add in your data and export it however you like. Here's how to do it:
1. Create or Log in to Your Mokkup Account
Start by signing up on Mokkup.ai using your email. If you already have an account, just log in, and you'll be good to go.
2. Choose and Customize Your Dashboard Template
Find the Stormwater Utility Smart Leak Detection & Control Dashboard template in the Templates section. Use the drag-and-drop editor to adjust KPIs, edit filters, or add elements based on your data.
3. Export to Your BI Tool
Once your dashboard wireframe is ready, use the BI Tool Export feature to send it directly to Power BI or Tableau for further analysis and enhancements. You can also download the dashboard as a PDF, PNG, or JPEG, embed it on a platform, or invite your team to collaborate.
Note: This is a Pro template. You'll need a Pro subscription on Mokkup to use and customize this dashboard wireframe. Upgrade anytime to unlock full access.
Stormwater Utility Smart Leak Detection & Control Dashboard Example
A network operations manager at a regional water utility opens this dashboard at the start of a shift to review overnight performance across pressure zones. The primary question they are trying to answer is whether any zones showed elevated leak detection events that need escalation, and whether automated valve actions responded as expected. With filters for DMA zone, alert severity level, and sensor network segment, they can isolate exactly the part of the network that concerns them without scrolling through raw sensor logs. Once the relevant zone is in view, teams can identify which pressure zones fall into poor ILI bands, where mean time to isolate leaks is longer than the network average, and which weeks have seen the highest concentration of leak detection events. Planners can compare zone-by-zone valve action counts against isolation response times to decide whether additional field crew deployment is warranted.
The NRW 12-month trend line gives operations leads a longitudinal view so they can track whether infrastructure improvements are actually reducing non-revenue water loss over time — a key metric in any stormwater utility infrastructure monitoring program. The overall outcome this dashboard supports is a tighter feedback loop between detection, isolation, and control. By surfacing ILI band distribution across pressure zones alongside automated control activity, the dashboard helps utility teams prioritize maintenance investment, justify capital expenditure on sensor networks, and report performance against regulatory targets. It is a practical tool for any team running a smart leak detection program for water utilities that needs to move from weekly manual reporting to continuous operational awareness.
How to Analyze Data in a Stormwater Utility Smart Leak Detection & Control Dashboard
Here is how you can analyze data from this dashboard:
- DMA Zone and Alert Severity Filtering – Filter dashboard data by District Metered Area (DMA) and alert severity to quickly focus on high-priority zones requiring immediate attention.
- Leak Detection Rate Monitoring – Compare the Leak Detection Rate KPI with previous reporting periods to identify sudden declines in sensor coverage and address potential monitoring gaps.
- Non-Revenue Water (NRW) Trend Analysis – Review the 12-month NRW trend to evaluate whether water loss is decreasing over time and measure the effectiveness of leakage reduction initiatives.
- ILI Band Distribution Analysis – Use the Infrastructure Leakage Index (ILI) distribution to assess the proportion of pressure zones in poor, fair, or optimal condition and prioritize improvement efforts.
- Leak Isolation Performance Assessment – Cross-reference Mean Time to Isolate Leaks by DMA zone with Automated Valve Actions to identify areas where manual intervention remains necessary and automation can be improved.
- Leak Detection Hotspot Analysis – Analyze the Leak Detection Events heatmap by zone and week to identify recurring leakage hotspots and prioritize preventive maintenance activities.
- Sensor and Device Uptime Monitoring – Verify sensor and device availability before interpreting leak detection performance, ensuring decisions are based on reliable operational data.
- Sensor Network Segment Analysis – Filter performance by sensor network segment to compare infrastructure reliability across different asset ages, network sections, or geographic regions.
Benefits of a Stormwater Utility Smart Leak Detection & Control Dashboard
The following are the benefits of using this water utility pressure zone performance tracking dashboard:
- Reduced Manual Reporting Effort – Eliminate the need to manually compile zone-level leak data from multiple sensor systems by consolidating it into a single operational view.
- Unified Leak Management Visibility – Provide operations teams with a centralized dashboard to monitor leak detection, isolation, and control performance in one place.
- Early Detection of Infrastructure Degradation – Surface Infrastructure Leakage Index (ILI) degradation trends early, enabling proactive maintenance before water losses increase.
- Improved Regulatory Reporting – Maintain visible, auditable non-revenue water (NRW) trend data to simplify compliance reporting and support regulatory requirements.
- Faster Field Crew Dispatch – Identify zones with longer leak isolation times to prioritize field response, improve resource allocation, and reduce service disruptions.
- Data-Driven Sensor Network Investment – Demonstrate the value of sensor infrastructure by tracking improvements in water savings, leak detection rates, and overall network performance.
- Shared Operational Reference – Serve as a centralized source of operational information for shift handovers, management reviews, and cross-functional decision-making, ensuring consistent visibility across teams.
KPIs to Track in a Stormwater Utility Smart Leak Detection & Control Dashboard
The following key KPIs can be tracked by using this DMA zone leak isolation time analytics dashboard:
- Key Performance Indicators (KPIs) are quantifiable metrics that measure how well an operation is achieving its defined objectives. In a stormwater utility leak detection and control program, KPIs connect sensor data to operational outcomes and infrastructure health.
- Leak Detection Rate (%): Measures the percentage of leaks detected by the sensor network, indicating how effective the monitoring infrastructure is at identifying pipe failures.
- Non-Revenue Water (NRW) (%): Tracks the share of water that enters the distribution system but is not billed, making it the primary financial and operational loss metric for any water utility.
- Mean Time to Isolate Leak (hours): Measures how quickly the team or automated systems can isolate a confirmed leak after detection, directly affecting total water loss per event.
- Automated Valve Actions (count): Counts the number of times automated valve controls were triggered in the selected period, indicating how actively the control layer is responding to detected events.
- Water Saved (ML/yr): Quantifies the volume of water preserved as a result of detection and isolation activity, used to demonstrate program impact and justify infrastructure spend.
- Sensor / Device Uptime (%): Tracks the availability of the sensor network, ensuring that detection rate figures are based on complete data coverage rather than gaps in monitoring.
- ILI Band Distribution (count): Shows how many pressure zones fall into each Infrastructure Leakage Index band (Excellent, Good, Fair, Poor), helping planners prioritize rehabilitation efforts.
- Mean Time to Isolate Leak by DMA Zone (hours): A zone-level breakdown of isolation speed that teams can use to identify where response protocols or automation need improvement.
- Leak Detection Events by Zone and Week (count): A heatmap showing event concentration across zones and time periods, used to detect recurring problem areas in the network.
Frequently Asked Questions
1. What does this dashboard measure?
The Stormwater Utility Smart Leak Detection & Control Dashboard tracks detection rate, non-revenue water loss, isolation response time, valve control activity, and sensor uptime across pressure zones and DMA segments. It is designed for water utility operations teams managing smart leak detection programs across distributed sensor networks.
2. Can this dashboard be filtered by specific zones or alert types?
Yes. The dashboard includes filters for DMA zone, alert severity level, sensor network segment, and date range. These filters let teams focus the view on the most operationally relevant part of the network without changing the underlying data.
3. How does this dashboard support non-revenue water reduction programs?
The NRW 12-month trend chart, combined with the ILI band distribution and isolation time metrics, gives utility managers a continuous view of whether their smart leak detection program for water utilities is producing measurable reductions in water loss. The Water Saved KPI ties detection activity directly to volume outcomes.