
What is a Stormwater Management Utility Cost & Budget Dashboard?
A Stormwater Management Utility Cost & Budget Dashboard is a purpose-built financial reporting tool that helps utility managers, public works directors, and municipal finance teams track spending, monitor program compliance, and assess the overall fiscal health of stormwater operations. Unlike generic finance dashboards, this tool is structured around the specific cost drivers and regulatory requirements that shape stormwater utility budget tracking from capital project expenditures to NPDES reporting obligations. The dashboard brings together operational and financial data across service districts and spending categories, giving decision-makers a consolidated view of where the utility stands against its approved budget. It supports municipal stormwater cost management by surfacing variances, liquidity indicators, and program-level spending rates in a single interface. Teams can filter by year, quarter, or drainage zone to focus analysis on what matters most at any given reporting cycle. By connecting Capital Improvement Program progress to fund reserves and day-to-day operating costs, the dashboard helps utilities plan ahead rather than react. It is particularly valuable during budget review periods, council presentations, and audits, where clear evidence of MS4 compliance budget monitoring and responsible resource allocation is essential.
How to Create a Stormwater Management Utility Cost & Budget Dashboard
You don't need to build your report from scratch, just start with a ready-to-use dashboard template from Mokkup. Add in your data and export it however you like. Here's how to do it:
1. Create or Log in to Your Mokkup Account
Start by signing up on Mokkup.ai using your email. If you already have an account, just log in, and you'll be good to go.
2. Choose and Customize Your Dashboard Template
Find the Stormwater Management Utility Cost & Budget Dashboard template in the Templates section. Use the drag-and-drop editor to adjust KPIs, edit filters, or add elements based on your data.
3. Export to Your BI Tool
Once your dashboard wireframe is ready, use the BI Tool Export feature to send it directly to Power BI or Tableau for further analysis and enhancements. You can also download the dashboard as a PDF, PNG, or JPEG, embed it on a platform, or invite your team to collaborate.
Note: This is a Pro template. You'll need a Pro subscription on Mokkup to use and customize this dashboard wireframe. Upgrade anytime to unlock full access.
Stormwater Management Utility Cost & Budget Dashboard Example
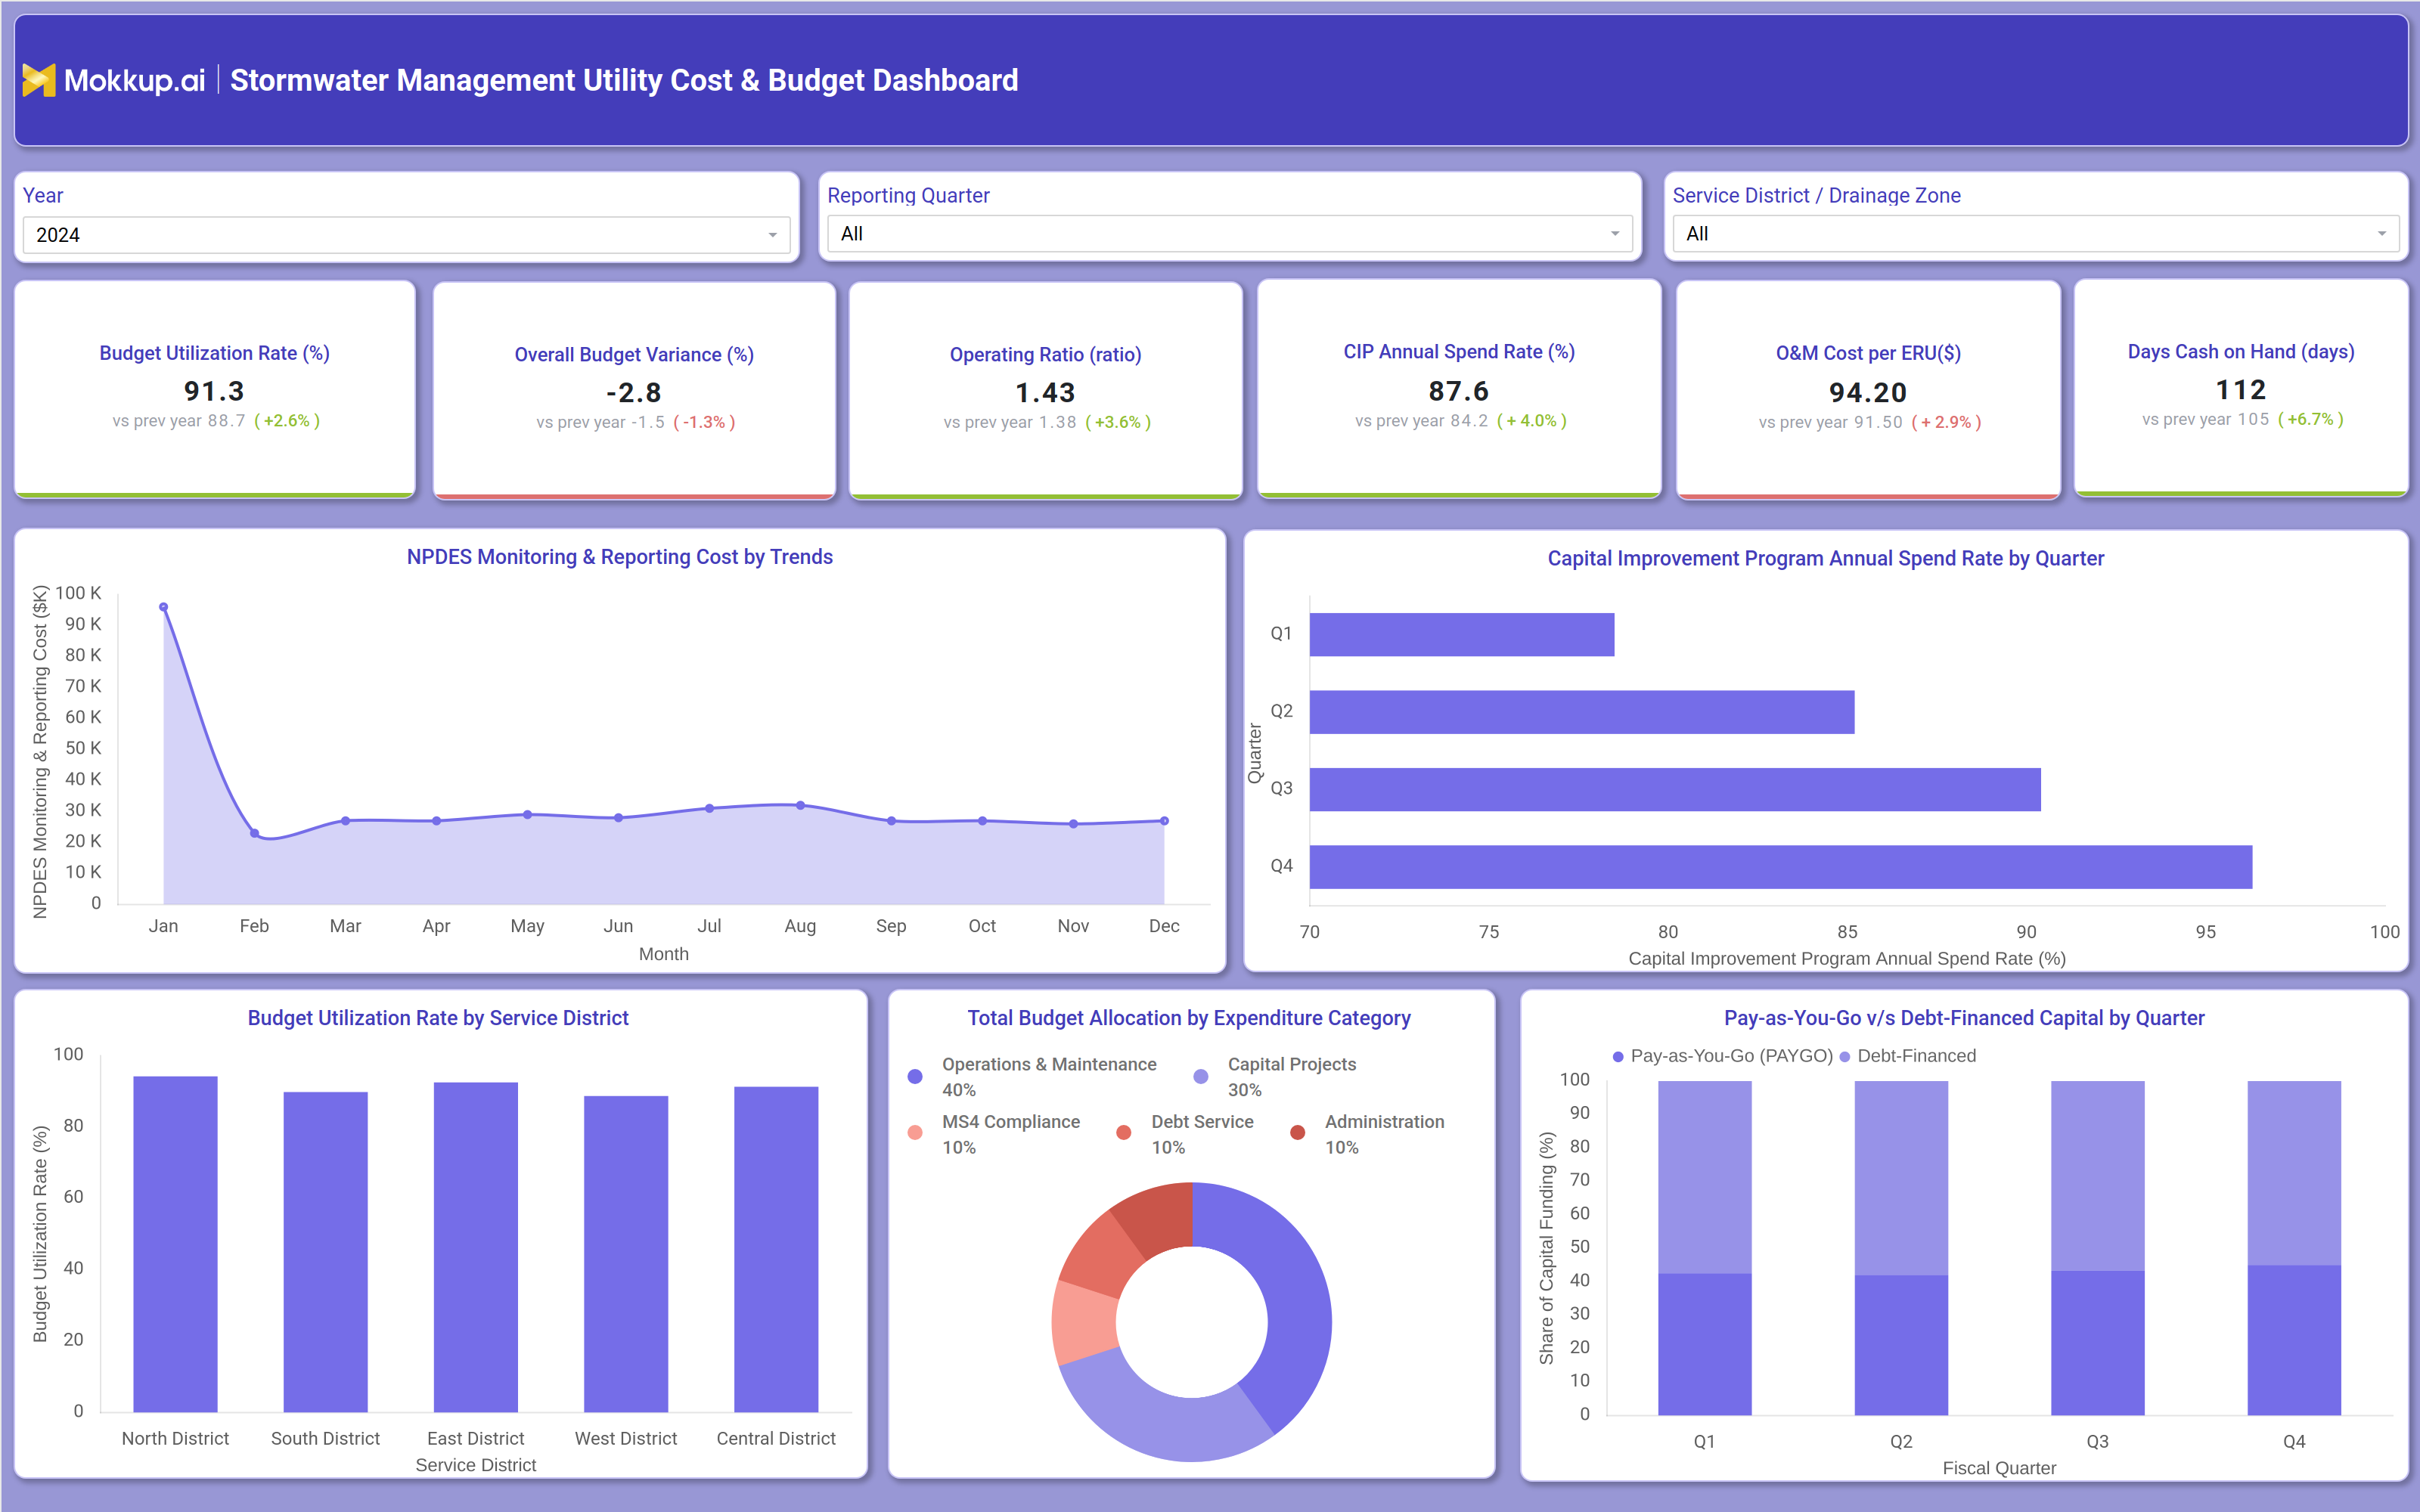
A stormwater utility finance manager opens this dashboard at the start of the quarter to evaluate how well the fund is tracking against the annual plan. The immediate question is straightforward: is spending aligned with budget, and are reserves sufficient to cover near-term obligations? Rather than pulling separate reports from multiple systems, they use this dashboard to identify pressure points across the entire operation in a single session. The KPI tiles at the top of the dashboard allow the manager to quickly assess the utility's financial posture — how much of the budget has been consumed, how far actual spending deviates from the plan, and whether cash reserves can sustain operations through the current cycle. These indicators are especially useful for stormwater fund financial performance dashboard reviews with finance directors or elected officials, where concise, evidence-based summaries are expected.
Drilling into district-level data, the team can compare budget utilization across service areas to identify which drainage zones are consuming resources faster than expected, and which may have capacity to absorb additional capital improvement program spending analysis. The CIP quarterly spend rate view helps program managers assess whether project delivery is on schedule and whether the pace of capital draws aligns with the fund's cash position. This informs decisions about PAYGO versus debt-financed capital, a trade-off that affects long-term stormwater utility budget tracking and rate-setting strategies. The overall outcome is a more disciplined and transparent planning process. The dashboard helps the team monitor NPDES compliance costs over time, evaluate the sustainability of stormwater operations and maintenance cost per ERU, and make the case for budget adjustments before problems escalate. It converts raw financial data into decisions, reducing the time spent on manual reconciliation and improving confidence in every reporting deliverable.
How to Analyze Data in a Stormwater Management Utility Cost & Budget Dashboard
Here is how you can analyze data from this dashboard:
- Track the Budget Utilization Rate by service district to identify which zones are over- or underspending relative to plan
- Use the NPDES Monitoring & Reporting Cost trend line to assess how MS4 compliance budget monitoring obligations are shifting month over month
- Evaluate the Capital Improvement Program Annual Spend Rate by quarter to determine whether capital improvement program spending analysis is on pace with project schedules
- Compare Pay-as-You-Go versus Debt-Financed capital across quarters to inform stormwater utility budget tracking and long-term financing decisions
- Review the Total Budget Allocation donut to assess how expenditure categories are proportioned across the fund
- Monitor Days Cash on Hand as an early indicator of liquidity risk within your stormwater fund financial performance dashboard review
- Filter by service district or reporting quarter to isolate variances and support municipal stormwater cost management at the zone level
Benefits of a Stormwater Management Utility Cost & Budget Dashboard
The following are the benefits of using this dashboard:
- Centralized Budget Visibility – Consolidate stormwater utility budget data across districts, programs, and fiscal periods into a single dashboard for comprehensive financial oversight.
- Improved MS4 Compliance Monitoring – Track NPDES reporting and compliance-related expenditures throughout the year to support effective MS4 budget management and regulatory reporting.
- Faster Budget Variance Detection – Identify budget overruns and underspending quickly without relying on manual spreadsheet reconciliation, enabling timely corrective actions.
- Enhanced Capital Improvement Program (CIP) Analysis – Link capital improvement program draw rates with fund liquidity to evaluate project spending efficiency and support informed investment decisions.
- Stronger Financial Performance Reviews – Provide a comprehensive stormwater fund financial dashboard that supports decision-making for councils, auditors, and rate study consultants.
- Reduced Reporting Preparation Time – Streamline financial reporting by centralizing municipal stormwater cost management data into a single, filterable interface.
- Support for Equitable Rate Planning – Analyze stormwater operations and maintenance costs per Equivalent Residential Unit (ERU) to evaluate cost recovery and develop fair, data-driven rate structures.
KPIs to Track in a Stormwater Management Utility Cost & Budget Dashboard
The following key KPIs can be tracked by using this dashboard:
- Budget Utilization Rate (%) measures how effectively the allocated budget is being consumed across the fund period; essential for stormwater utility budget tracking
- Overall Budget Variance (%) measures the deviation between planned and actual spending, helping teams flag over- or under-expenditure early
- Operating Ratio measures operating expenses relative to operating revenues, indicating the fund's operational self-sufficiency; central to municipal stormwater cost management analysis
- CIP Annual Spend Rate (%) measures the pace of Capital Improvement Program disbursements against the annual capital budget; supports capital improvement program spending analysis
- O&M Cost per ERU ($) measures Operations & Maintenance costs divided by Equivalent Residential Units, a standard benchmark for stormwater operations and maintenance cost per ERU equity assessments
- Days Cash on Hand measures how many days of operating expenses the fund can cover with available cash; a key liquidity indicator in any stormwater fund financial performance dashboard
Frequently Asked Questions
1. What makes a stormwater utility budget dashboard different from a general finance dashboard?
A stormwater utility dashboard is structured around program-specific cost drivers such as NPDES compliance, CIP spending, and ERU-based cost allocation. It is designed for MS4 compliance budget monitoring and fund-level reporting rather than enterprise-wide finance. General dashboards lack these regulatory and service-delivery dimensions.
2. How often should stormwater utility teams review this dashboard?
Most utilities review financial performance monthly or quarterly to align with reporting cycles and budget amendment windows. More frequent monitoring supports proactive municipal stormwater cost management, especially when CIP project timelines or compliance obligations shift mid-year.
3. Can this dashboard support rate study and long-term financial planning?
Yes — metrics like O&M Cost per ERU, Days Cash on Hand, and CIP spend rates are standard inputs for rate adequacy studies. The dashboard's ability to track stormwater utility budget tracking trends over time makes it a useful reference for consultants preparing long-term financial plans or revenue sufficiency analyses.