
What is an LNG Supply Chain Cost & Contract Governance Report
An LNG Supply Chain Cost & Contract Governance Report is a structured analytics framework used by natural gas utilities to monitor procurement costs, supplier performance, contract compliance, and financial risk across the LNG value chain. This report consolidates operational and financial metrics into a centralized LNG contract governance dashboard for natural gas utilities. It tracks delivered cost per MMBtu, contracted volumes, supplier reliability, fulfillment performance, and cost variance against budget.
The report functions as both an LNG delivered cost per MMBtu monitoring report and an LNG cost variance vs budget analysis dashboard, enabling decision-makers to identify pricing deviations, freight impacts, regasification costs, and contractual exposure. It also integrates an LNG on-time delivery rate-monitoring system to evaluate supplier execution and logistics reliability. By combining financial governance and operational KPIs, this report supports LNG utilities supply chain cost optimization analytics.
How to Create an LNG Supply Chain Cost & Contract Governance Report
You don't need to build your report from scratch, just start with a ready-to-use dashboard template from Mokkup. Add in your data and export it however you like. Here's how to do it:
1. Create or Log in to Your Mokkup Account
Start by signing up on Mokkup.ai using your email. If you already have an account, just log in, and you'll be good to go.
2. Choose and Customize Your Dashboard Template
Find the LNG Supply Chain Cost & Contract Governance Report template in the Templates section. Use the drag-and-drop editor to adjust KPIs, edit filters, or add elements based on your data.
3. Export to Your BI Tool
Once your dashboard wireframe is ready, use the BI Tool Export feature to send it directly to Power BI or Tableau for further analysis and enhancements. You can also download the dashboard as a PDF, PNG, or JPEG, embed it on a platform, or invite your team to collaborate.
Note: This is a Pro template. You'll need a Pro subscription on Mokkup to use and customize this dashboard wireframe. Upgrade anytime to unlock full access.
LNG Supply Chain Cost & Contract Governance Report Example
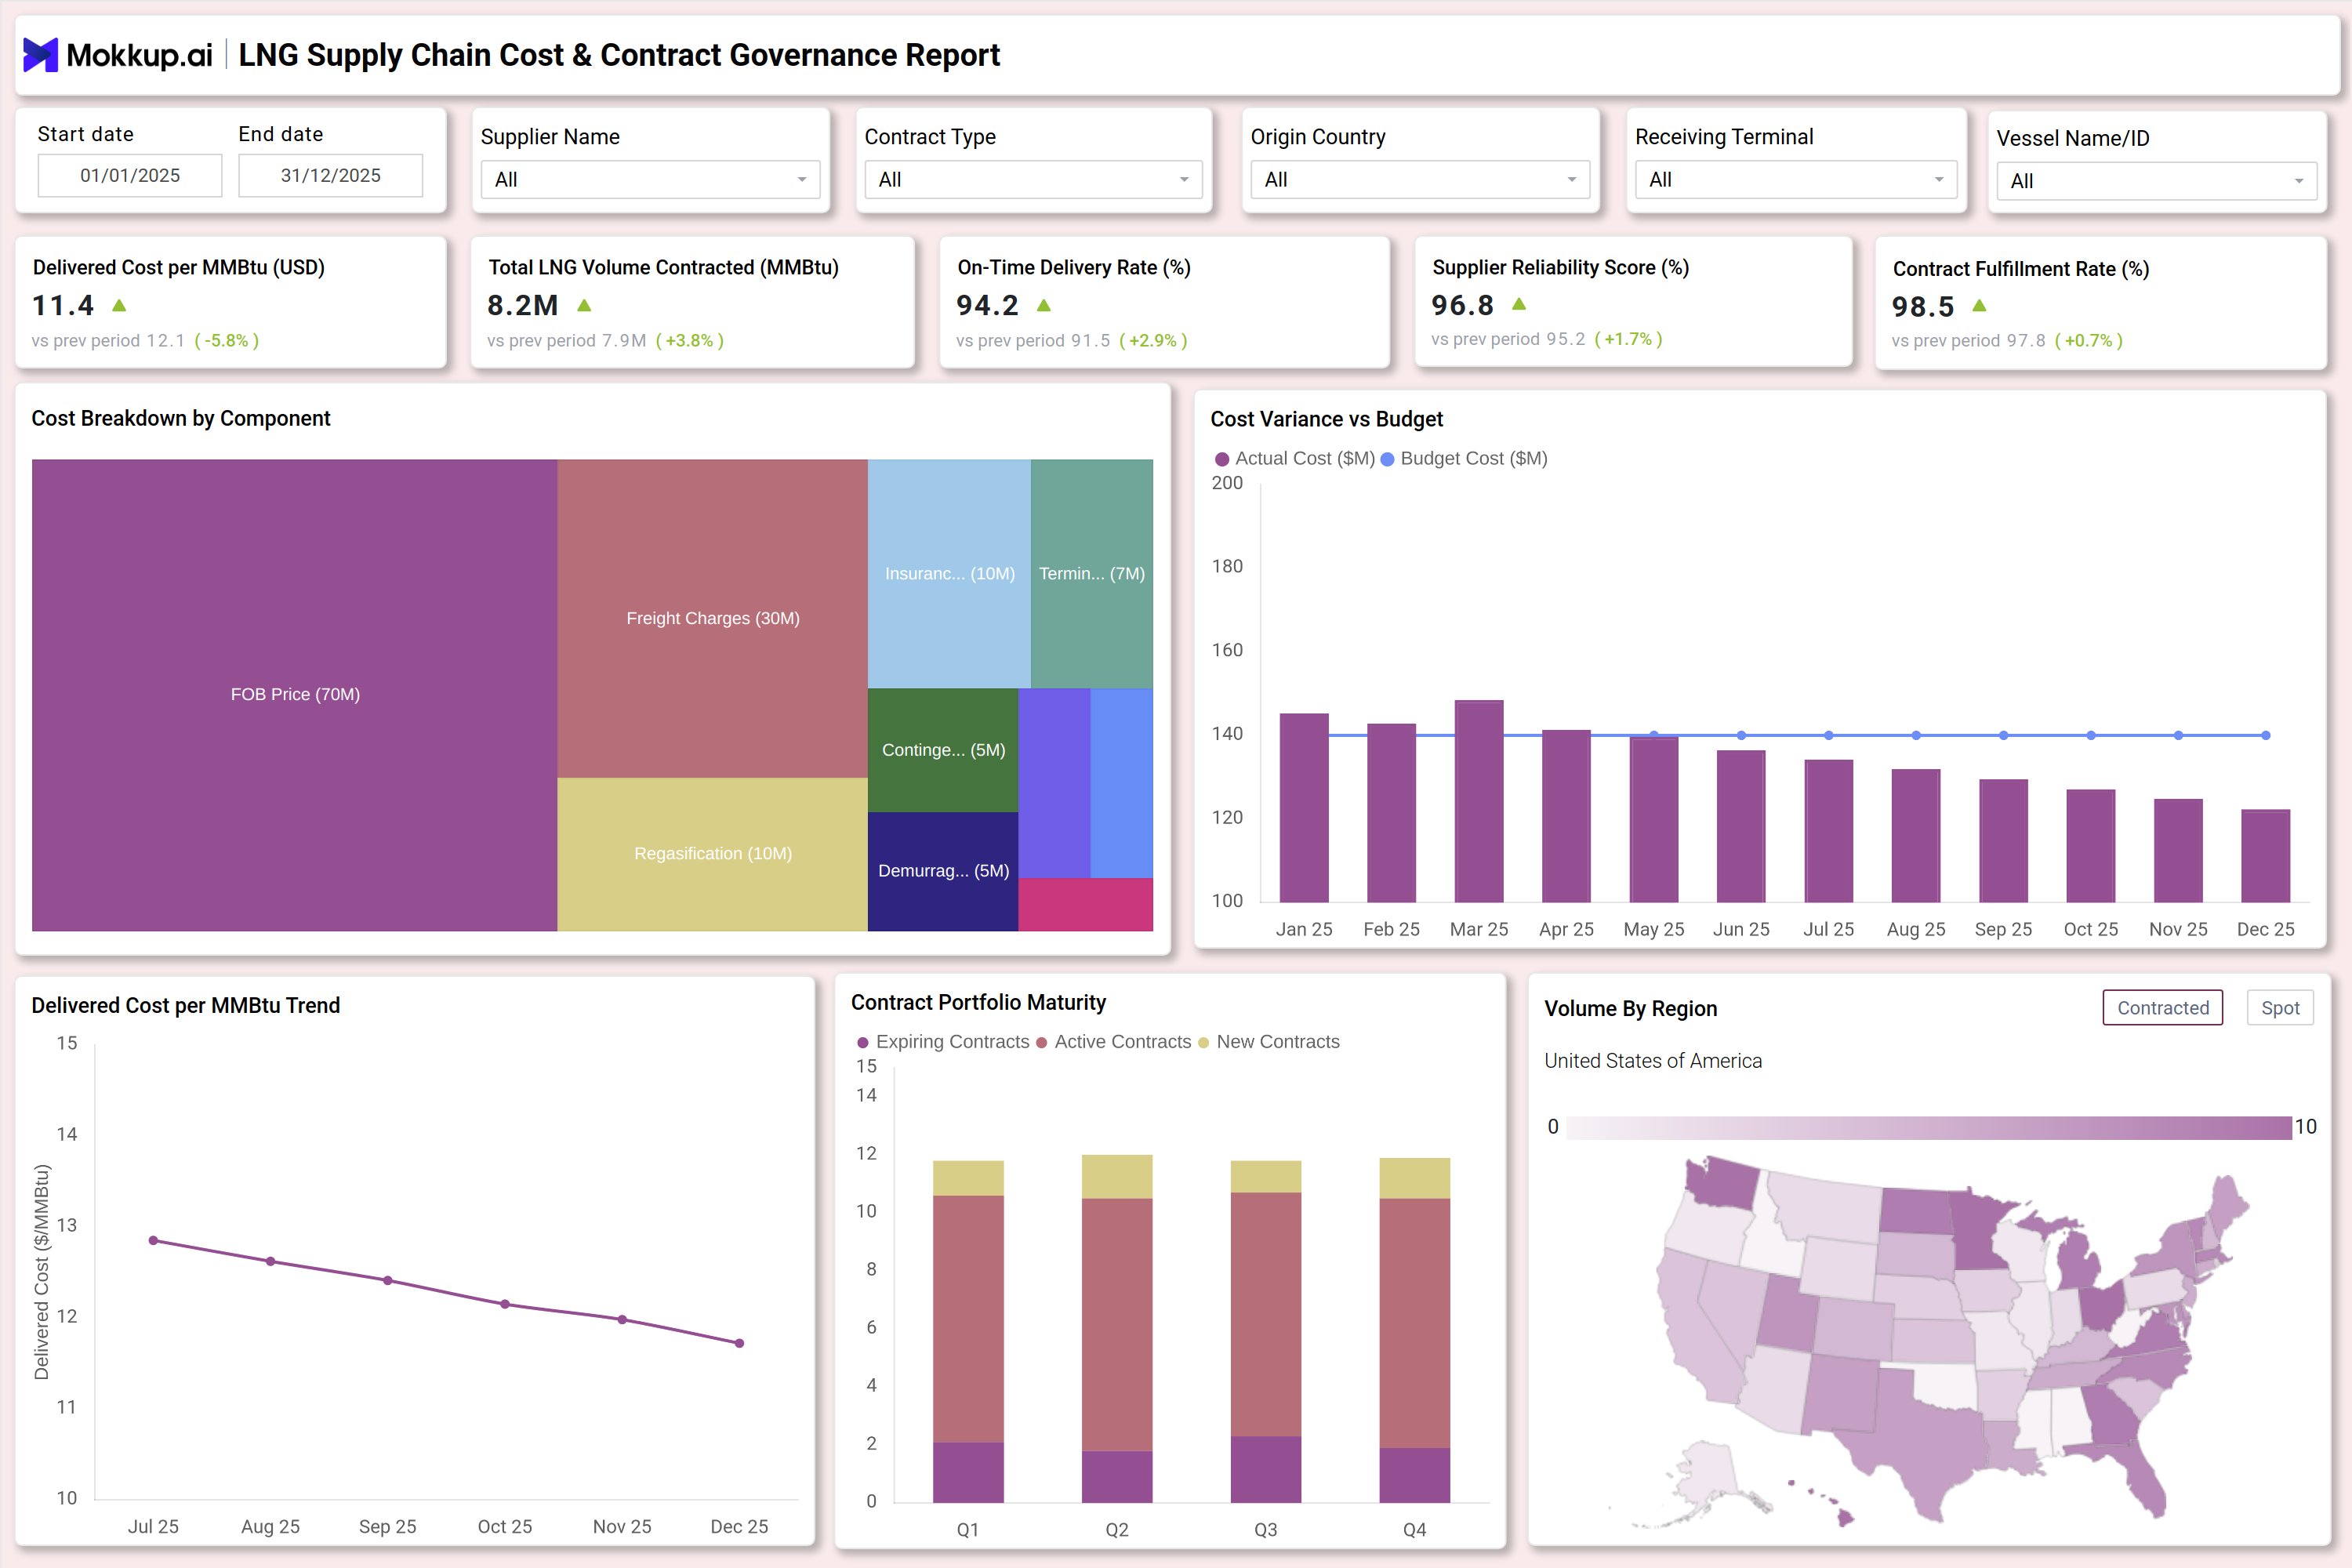
A typical LNG Supply Chain Cost & Contract Governance Report includes filters for supplier, contract type, origin country, receiving terminal, and vessel identification. The dashboard presents high-level KPIs such as Delivered Cost per MMBtu, Total LNG Volume Contracted (MMBtu), On-Time Delivery Rate, Supplier Reliability Score, and Contract Fulfillment Rate. The cost structure is visualized through a component-level breakdown, including FOB price, freight charges, regasification fees, insurance, terminal costs, and demurrage. This allows procurement teams to understand landed cost composition in detail.
A monthly LNG cost variance vs budget analysis dashboard compares actual cost against planned budget to highlight financial deviations. Trend analysis tracks fluctuations in delivered cost per MMBtu over time. Contract portfolio maturity visuals classify contracts into active, expiring, and new agreements to assess renewal risk. Additionally, an LNG regional volume distribution and cost analytics dashboard maps contracted volumes geographically to monitor supply concentration and regional exposure.
How to Analyze Data in an LNG Supply Chain Cost & Contract Governance Report
Here is how you can analyze data from this dashboard:
- Identify cost movement over time: Tracks trends to detect inflationary pressures or supplier pricing changes.
- Evaluate cost components (FOB, freight, regas, etc.): Pinpoints major cost drivers impacting total landed LNG cost.
- Analyze cost variance vs. budget: Identifies overspending or savings against planned procurement budgets.
- Review contract execution levels: Flags low fulfillment rates indicating delays or supplier issues.
- Monitor on-time delivery performance: Measures schedule adherence to ensure consistent supply operations.
- Identify expiring contracts and renewal risks: Prevents supply disruptions through proactive contract management.
- Assess regional volume distribution and cost: Highlights geographic concentration risks and diversification opportunities.
- Analyze exposure to market price volatility: Optimizes sourcing strategy between long-term and spot purchases.
Benefits of an LNG Supply Chain Cost & Contract Governance Report
The following are the benefits of using this dashboard:
- Improves LNG procurement cost visibility: Provides clear insights into cost structures for better financial control.
- Strengthens contract compliance monitoring: Ensures adherence to contract terms and reduces compliance risks.
- Enhances supplier performance accountability: Tracks supplier metrics to improve reliability and service quality.
- Reduces budget overruns through variance tracking: Identifies deviations early to control procurement spending.
- Supports risk-based contract renewal planning: Helps prioritize renewals based on performance and risk exposure.
- Enables data-driven negotiation strategies: Uses cost and performance data to strengthen supplier negotiations.
- Improves logistics and delivery reliability: Enhances supply chain consistency through performance monitoring.
- Optimizes regional supply allocation: Balances supply distribution to reduce risk and improve efficiency.
- Increases transparency across finance and operations teams: Aligns stakeholders with shared, data-driven insights.
- Supports LNG utilities supply chain cost optimization analytics: Enables end-to-end cost optimization across procurement and operations.
KPIs to Track in a LNG Supply Chain Cost & Contract Governance Report
The following key KPIs can be tracked by using this dashboard:
- Delivered Cost per MMBtu (USD): Measures total landed cost of LNG including procurement and logistics components.
- Total LNG Volume Contracted (MMBtu): Tracks contracted supply volume to ensure alignment with demand planning.
- On-Time Delivery Rate (%): Percentage of shipments delivered as scheduled; reflects logistics efficiency.
- Supplier Reliability Score (%): Composite metric evaluating supplier performance across delivery, quality, and compliance.
- Contract Fulfillment Rate (%): Measures the percentage of contracted volume actually delivered.
- Cost Variance vs Budget ($M): Identifies deviations between planned procurement budget and actual spending.
- Cost Breakdown by Component: Tracks FOB, freight, regasification, insurance, terminal, and demurrage costs individually.
- Contract Portfolio Maturity: Classifies contracts into expiring, active, and new categories to manage renewal risk.
- Regional Volume Distribution: Measures geographic concentration of LNG supply to reduce exposure risk.
Frequently Asked Questions
1. Why is an LNG Supply Chain Cost & Contract Governance Report important for utilities?
It ensures cost control, supplier accountability, and contract compliance while reducing financial and operational risk.
2. How does this report help in cost optimization?
It provides LNG utilities supply chain cost optimization analytics by identifying cost drivers, variance patterns, and inefficiencies.
3. What makes this different from a standard procurement dashboard?
It integrates financial governance, contract lifecycle management, delivery performance tracking, and regional risk analytics in one system.
4. Can this dashboard support regulatory compliance?
Yes. It improves audit readiness through structured contract performance monitoring and budget tracking.
5. Who should use this report?
Procurement managers, supply chain analysts, finance controllers, contract managers, and LNG operations teams within natural gas utilities.