
What is a Natural Gas Financial Performance Dashboard?
A natural gas financial performance dashboard for utilities is a centralized reporting solution that tracks revenue, cost structure, margins, profitability, and capital efficiency across natural gas transmission, distribution, and Liquefied Natural Gas (LNG) operations. It consolidates financial and operational data into a structured analytics interface designed for CFOs, finance teams, and executive leadership. This dashboard integrates key financial indicators such as sales revenue, cost per MMBtu, regasification margin, gross margin percentage, EBITDA margin, and capacity utilization. It acts as both a natural gas transmission financial reporting dashboard and a natural gas distribution financial KPI dashboard, enabling end-to-end visibility across upstream procurement, midstream transportation, and downstream customer billing.
For LNG operators, it functions as an LNG financial performance KPI dashboard template, tracking liquefaction costs, shipping expenses, storage charges, and regasification economics. The dashboard supports variance analysis, budget vs. actual tracking, and margin monitoring, making it a critical component of a broader natural gas business performance analytics dashboard strategy.
How to Create a Natural Gas Financial Performance Dashboard
You don't need to build your report from scratch, just start with a ready-to-use Natural Gas Financial Performance dashboard template from Mokkup. Add in your data and export it however you like. Here's how to do it:
1. Create or Log in to Your Mokkup Account
Start by signing up on Mokkup.ai using your email. If you already have an account, just log in, and you'll be good to go.
2. Choose and Customize Your Dashboard Template
Find the Natural Gas Financial Performance Dashboard template in the Templates section. Use the drag-and-drop editor to adjust KPIs, edit filters, or add elements based on your data.
3. Export to Your BI Tool
Once your dashboard wireframe is ready, use the BI Tool Export feature to send it directly to Power BI or Tableau for further analysis and enhancements. You can also download the dashboard as a PDF, PNG, or JPEG, embed it on a platform, or invite your team to collaborate.
Note: This is a Pro template. You'll need a Pro subscription on Mokkup to use and customize this dashboard wireframe. Upgrade anytime to unlock full access.
Natural Gas Financial Performance Dashboard Example
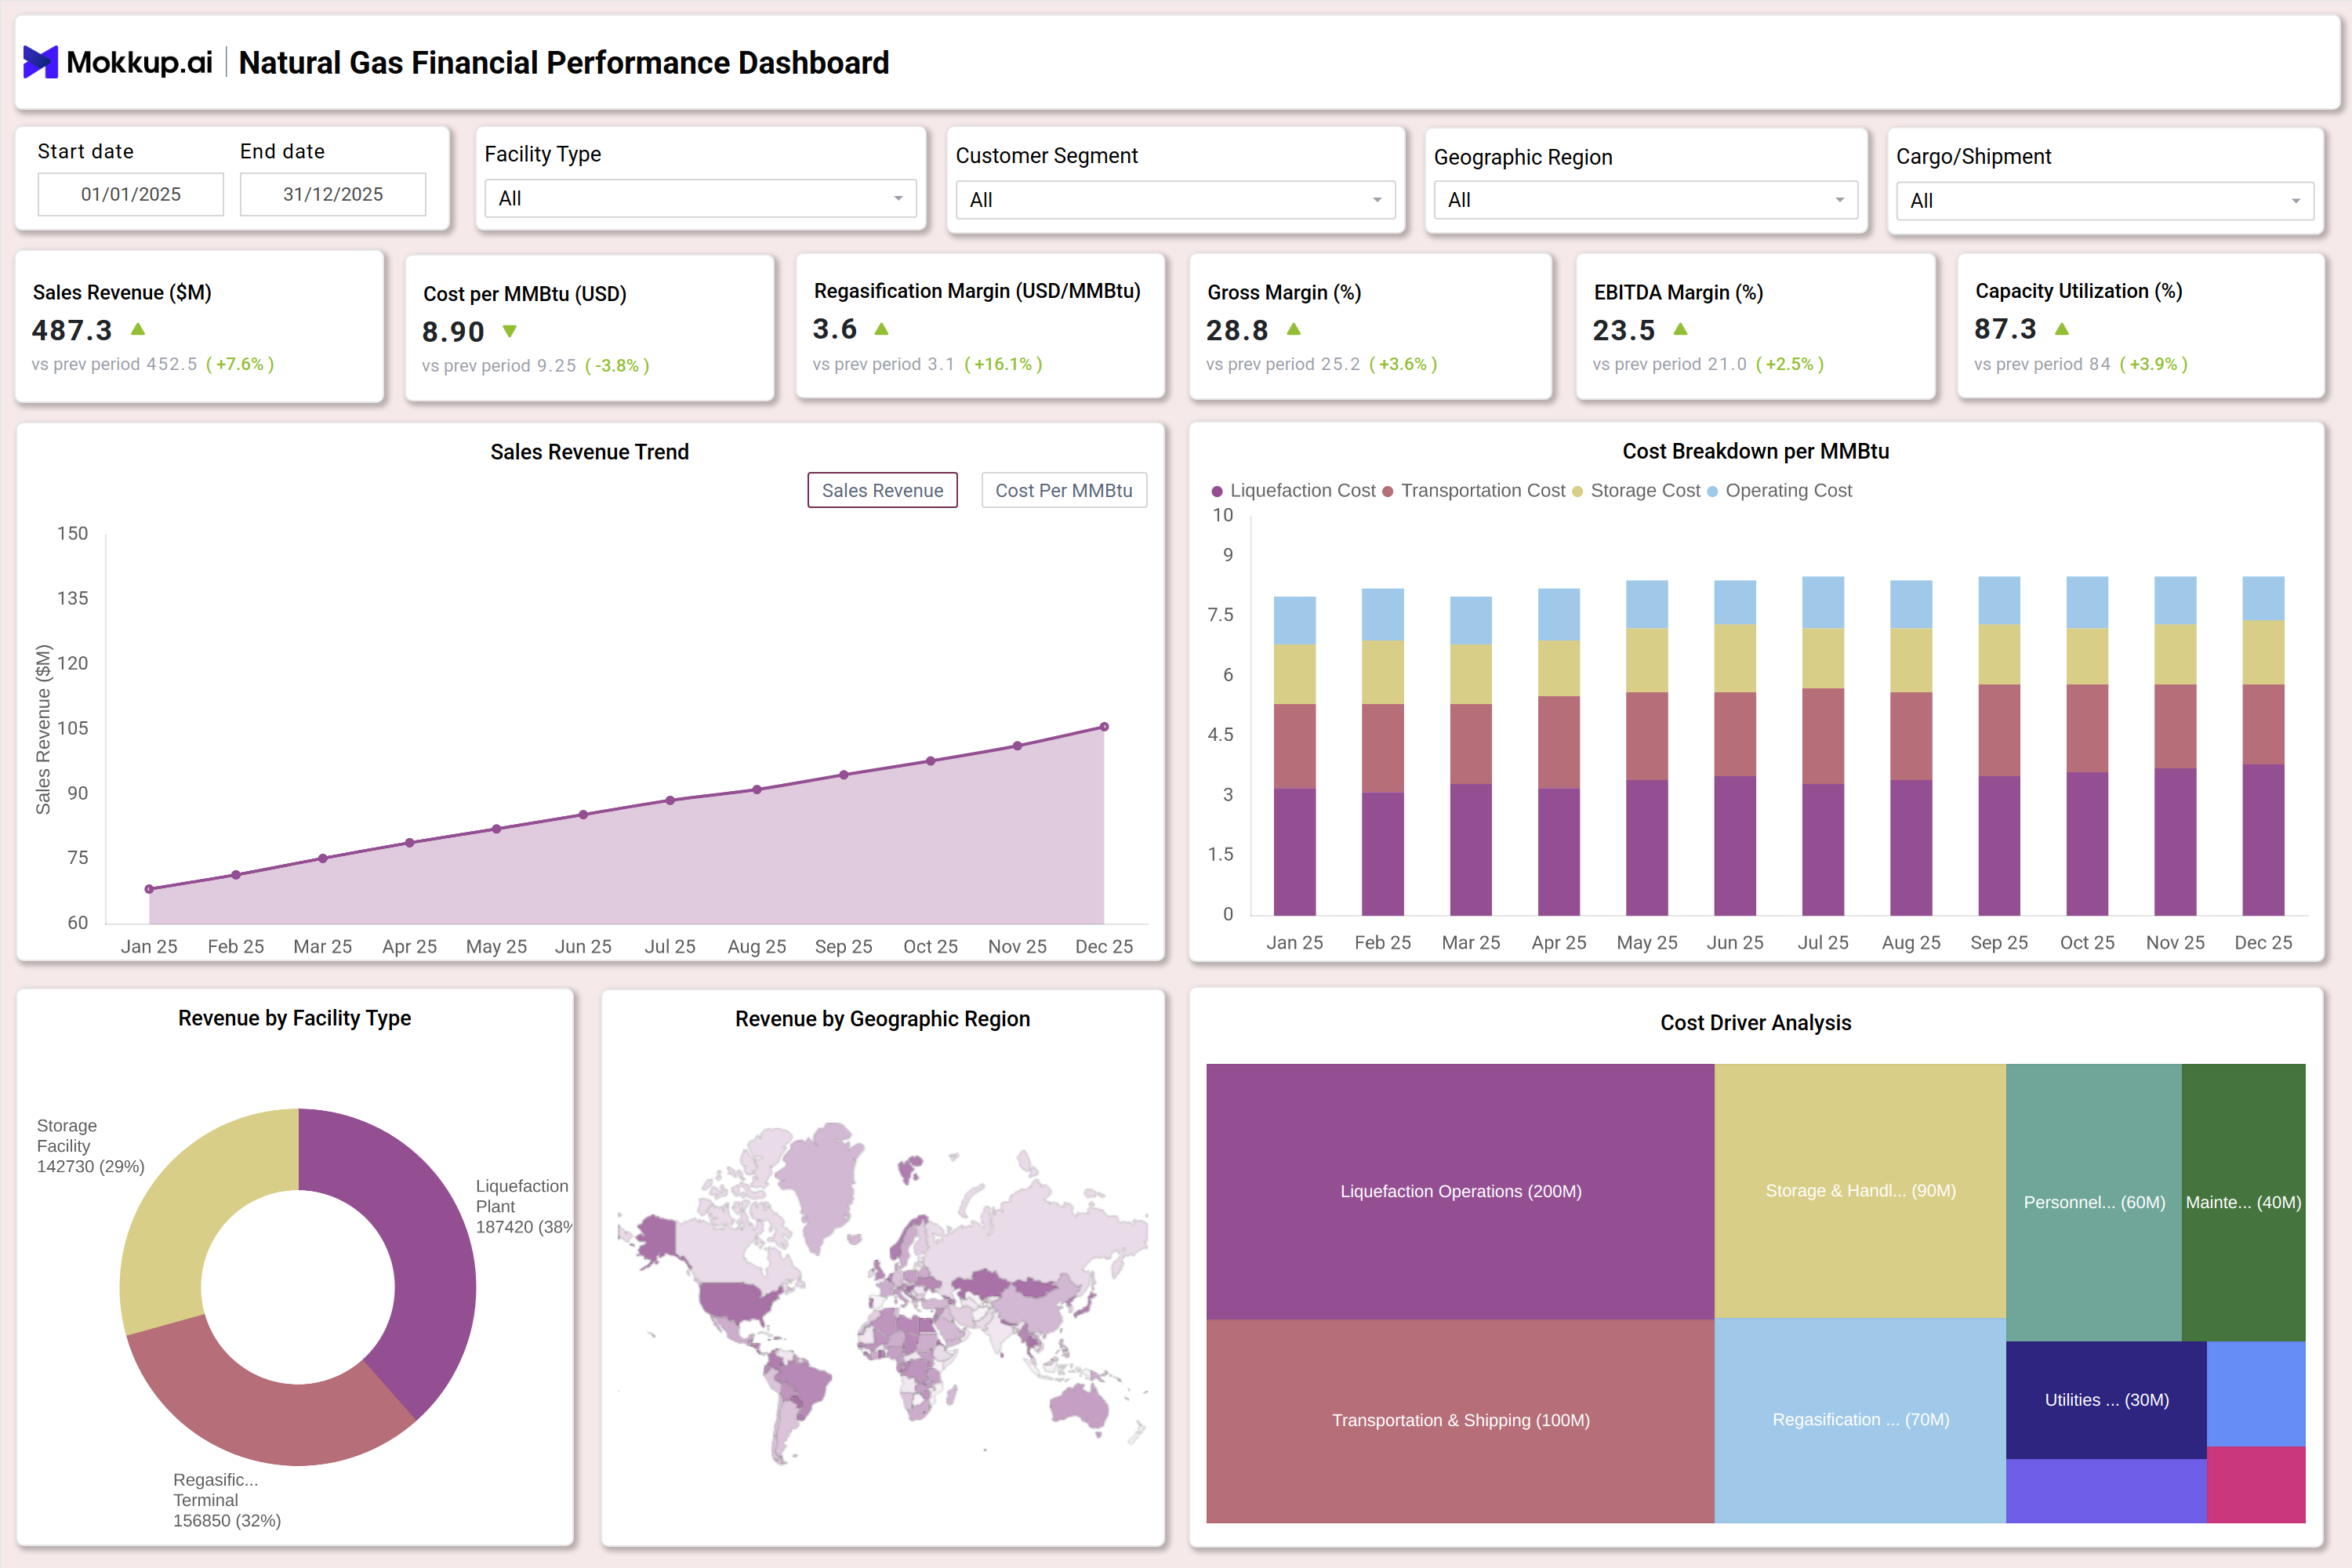
The dashboard example presented includes financial KPIs at the top level, trend analysis in the middle section, and cost breakdown and geographic performance visuals at the bottom. The KPI cards highlight metrics such as Sales Revenue ($M), Cost per MMBtu (USD), Regasification Margin (USD/MMBtu), Gross Margin (%), EBITDA Margin (%), and Capacity Utilization (%). Each metric compares current performance against the previous period to support variance analysis. This design enables quick identification of revenue growth, cost escalation, or margin compression.
The Sales Revenue Trend chart displays monthly performance, allowing finance teams to assess seasonality, demand shifts, and tariff impacts. The Cost Breakdown per MMBtu visual separates liquefaction, transportation, storage, and operating costs, which is essential for LNG margin analysis. The Revenue by Facility Type donut chart distinguishes between liquefaction plants, regasification terminals, and storage facilities, while the geographic map visual supports regional profitability tracking. The Cost Driver Analysis treemap shows major expense categories such as liquefaction operations, transportation and shipping, regasification, personnel, maintenance, and utilities. Combined, these components form a structured natural gas gross margin and net profit KPI dashboard and a natural gas cash flow monitoring dashboard for executives.
How to Analyze Data in a Natural Gas Financial Performance Dashboard
Here is how you can analyze data from this dashboard:
- Revenue & Margin Analysis: Compare Sales Revenue with Cost per MMBtu to evaluate contribution margins.
- Contract Profitability Review: Assess Regasification Margin to understand LNG contract performance.
- Efficiency Tracking: Monitor Gross Margin (%) and EBITDA Margin (%) for operational efficiency insights.
- Asset Utilization Monitoring: Evaluate Capacity Utilization to measure asset productivity and cost absorption.
- Cost Driver Analysis: Analyze Cost Breakdown per MMBtu to identify key expense contributors.
- Regional Performance Comparison: Use geographic revenue maps to detect underperforming regions.
- Asset-Level Profitability: Review facility-type revenue to assess performance across asset categories.
- Trend & Variance Analysis: Perform MoM and YoY comparisons to identify financial trends.
- Budget vs Actual Evaluation: Compare planned vs actual results to improve forecasting accuracy.
- Optimization Prioritization: Assess cost drivers to focus on high-impact expense reduction areas.
Benefits of a Natural Gas Financial Performance Dashboard
The following are the benefits of using this dashboard:
- Centralized Financial Visibility: Consolidates financial metrics across all operations in one view.
- Margin Control Improvement: Enables real-time monitoring of cost and profitability drivers.
- Faster Decision-Making: Supports quicker executive decisions with unified KPI insights.
- Enhanced Profitability Analysis: Provides detailed performance tracking across regions and assets.
- Capital Planning Support: Aids in better investment and resource allocation decisions.
- Operational Accountability: Tracks financial performance at facility and unit levels.
- Contract Negotiation Support: Strengthens LNG contract decisions with margin visibility.
- Financial Governance: Standardizes KPIs for consistent reporting and control.
- Reduced Reporting Effort: Automates financial tracking and reduces manual workload.
- Scalable Analytics Framework: Supports enterprise-wide financial monitoring and growth.
KPIs to Track in a Natural Gas Financial Performance Dashboard
The following key KPIs can be tracked by using this dashboard:
- Sales Revenue ($M): Total revenue generated from gas sales and LNG contracts.
- Cost per MMBtu (USD): Total cost incurred per unit of gas handled or sold.
- Regasification Margin (USD/MMBtu): Margin generated from LNG regasification activities.
- Gross Margin (%): Revenue minus direct costs as a percentage of revenue.
- EBITDA Margin (%): Operating profitability before depreciation and financing costs.
- Capacity Utilization (%): Utilization rate of liquefaction, storage, or transmission assets.
- Operating Cost Breakdown: Liquefaction, transportation, storage, utilities, and personnel costs.
- Revenue by Facility Type: Financial performance by asset category.
- Regional Revenue Contribution: Geographic profitability analysis.
- Cash Flow Position: Net operating cash generated during the reporting period.
Frequently Asked Questions
Q1. Who should use a Natural Gas Financial Performance Dashboard?
CFOs, finance managers, operations heads, LNG commercial teams, and executive leadership in natural gas utilities and LNG companies.
Q2. How is this different from a standard financial dashboard?
It integrates energy-specific metrics such as MMBtu cost structure, regasification margins, capacity utilization, and LNG shipping economics.
Q3. Can this dashboard support transmission and distribution reporting?
Yes. It works as a natural gas transmission financial reporting dashboard and also supports distribution-level financial tracking.
Q4. Does it help in LNG profitability analysis?
Yes. It acts as an LNG financial performance KPI dashboard template, tracking liquefaction costs, shipping charges, and regasification margins.
Q5. How does it support executive decision-making?
It functions as a natural gas cash flow monitoring dashboard for executives, providing consolidated profitability and margin insights.
Q6. Can it support budgeting and forecasting?
Yes. The dashboard enables variance analysis, budget comparison, and forward-looking financial planning.