
What Is a Stormwater Management Utility Regulatory Permit Compliance Dashboard?
A stormwater permit compliance dashboard for utilities is a centralized analytics platform designed to help water and wastewater utilities track, manage, and report regulatory compliance under the Clean Water Act (CWA) and EPA stormwater regulations. This EPA stormwater management compliance tracking tool consolidates inspection data, violation records, corrective actions, and training metrics into a single interface, enabling utilities to monitor NPDES permit compliance, reduce violations, and streamline reporting. The dashboard integrates data from stormwater utility inspection and audit management software, providing visibility into compliance status across different watershed zones, permit types, and regional operations. By automating data collection and reporting, utilities can ensure adherence to stormwater permit monitoring requirements, minimize regulatory risks, and improve operational efficiency.
How to Create a Stormwater Management Utility Regulatory Permit Compliance Dashboard
You don’t need to build your report from scratch, just start with a ready-to-use dashboard template from Mokkup. Add in your data and export it however you like. Here’s how to do it:
1. Create or Log in to Your Mokkup Account
Start by signing up on Mokkup.ai using your email. If you already have an account, just log in, and you’ll be good to go.
2. Choose and Customize Your Dashboard Template
Find the Stormwater Management Utility Regulatory Permit Compliance Dashboard template in the Templates section. Use the drag and drop editor to adjust KPIs, edit filters, or add elements based on your data.
3. Export to Your BI Tool
Once your dashboard wireframe is ready, use the BI Tool Export feature to send it directly to Power BI or Tableau for further analysis and enhancements. You can also download the dashboard as a PDF, PNG, or JPEG, embed it on a platform, or invite your team to collaborate.
Note: This is a Pro template. You’ll need a Pro subscription on Mokkup to use and customize this dashboard wireframe. Upgrade anytime to unlock full access.
Stormwater Management Utility Regulatory Permit Compliance Dashboard Example
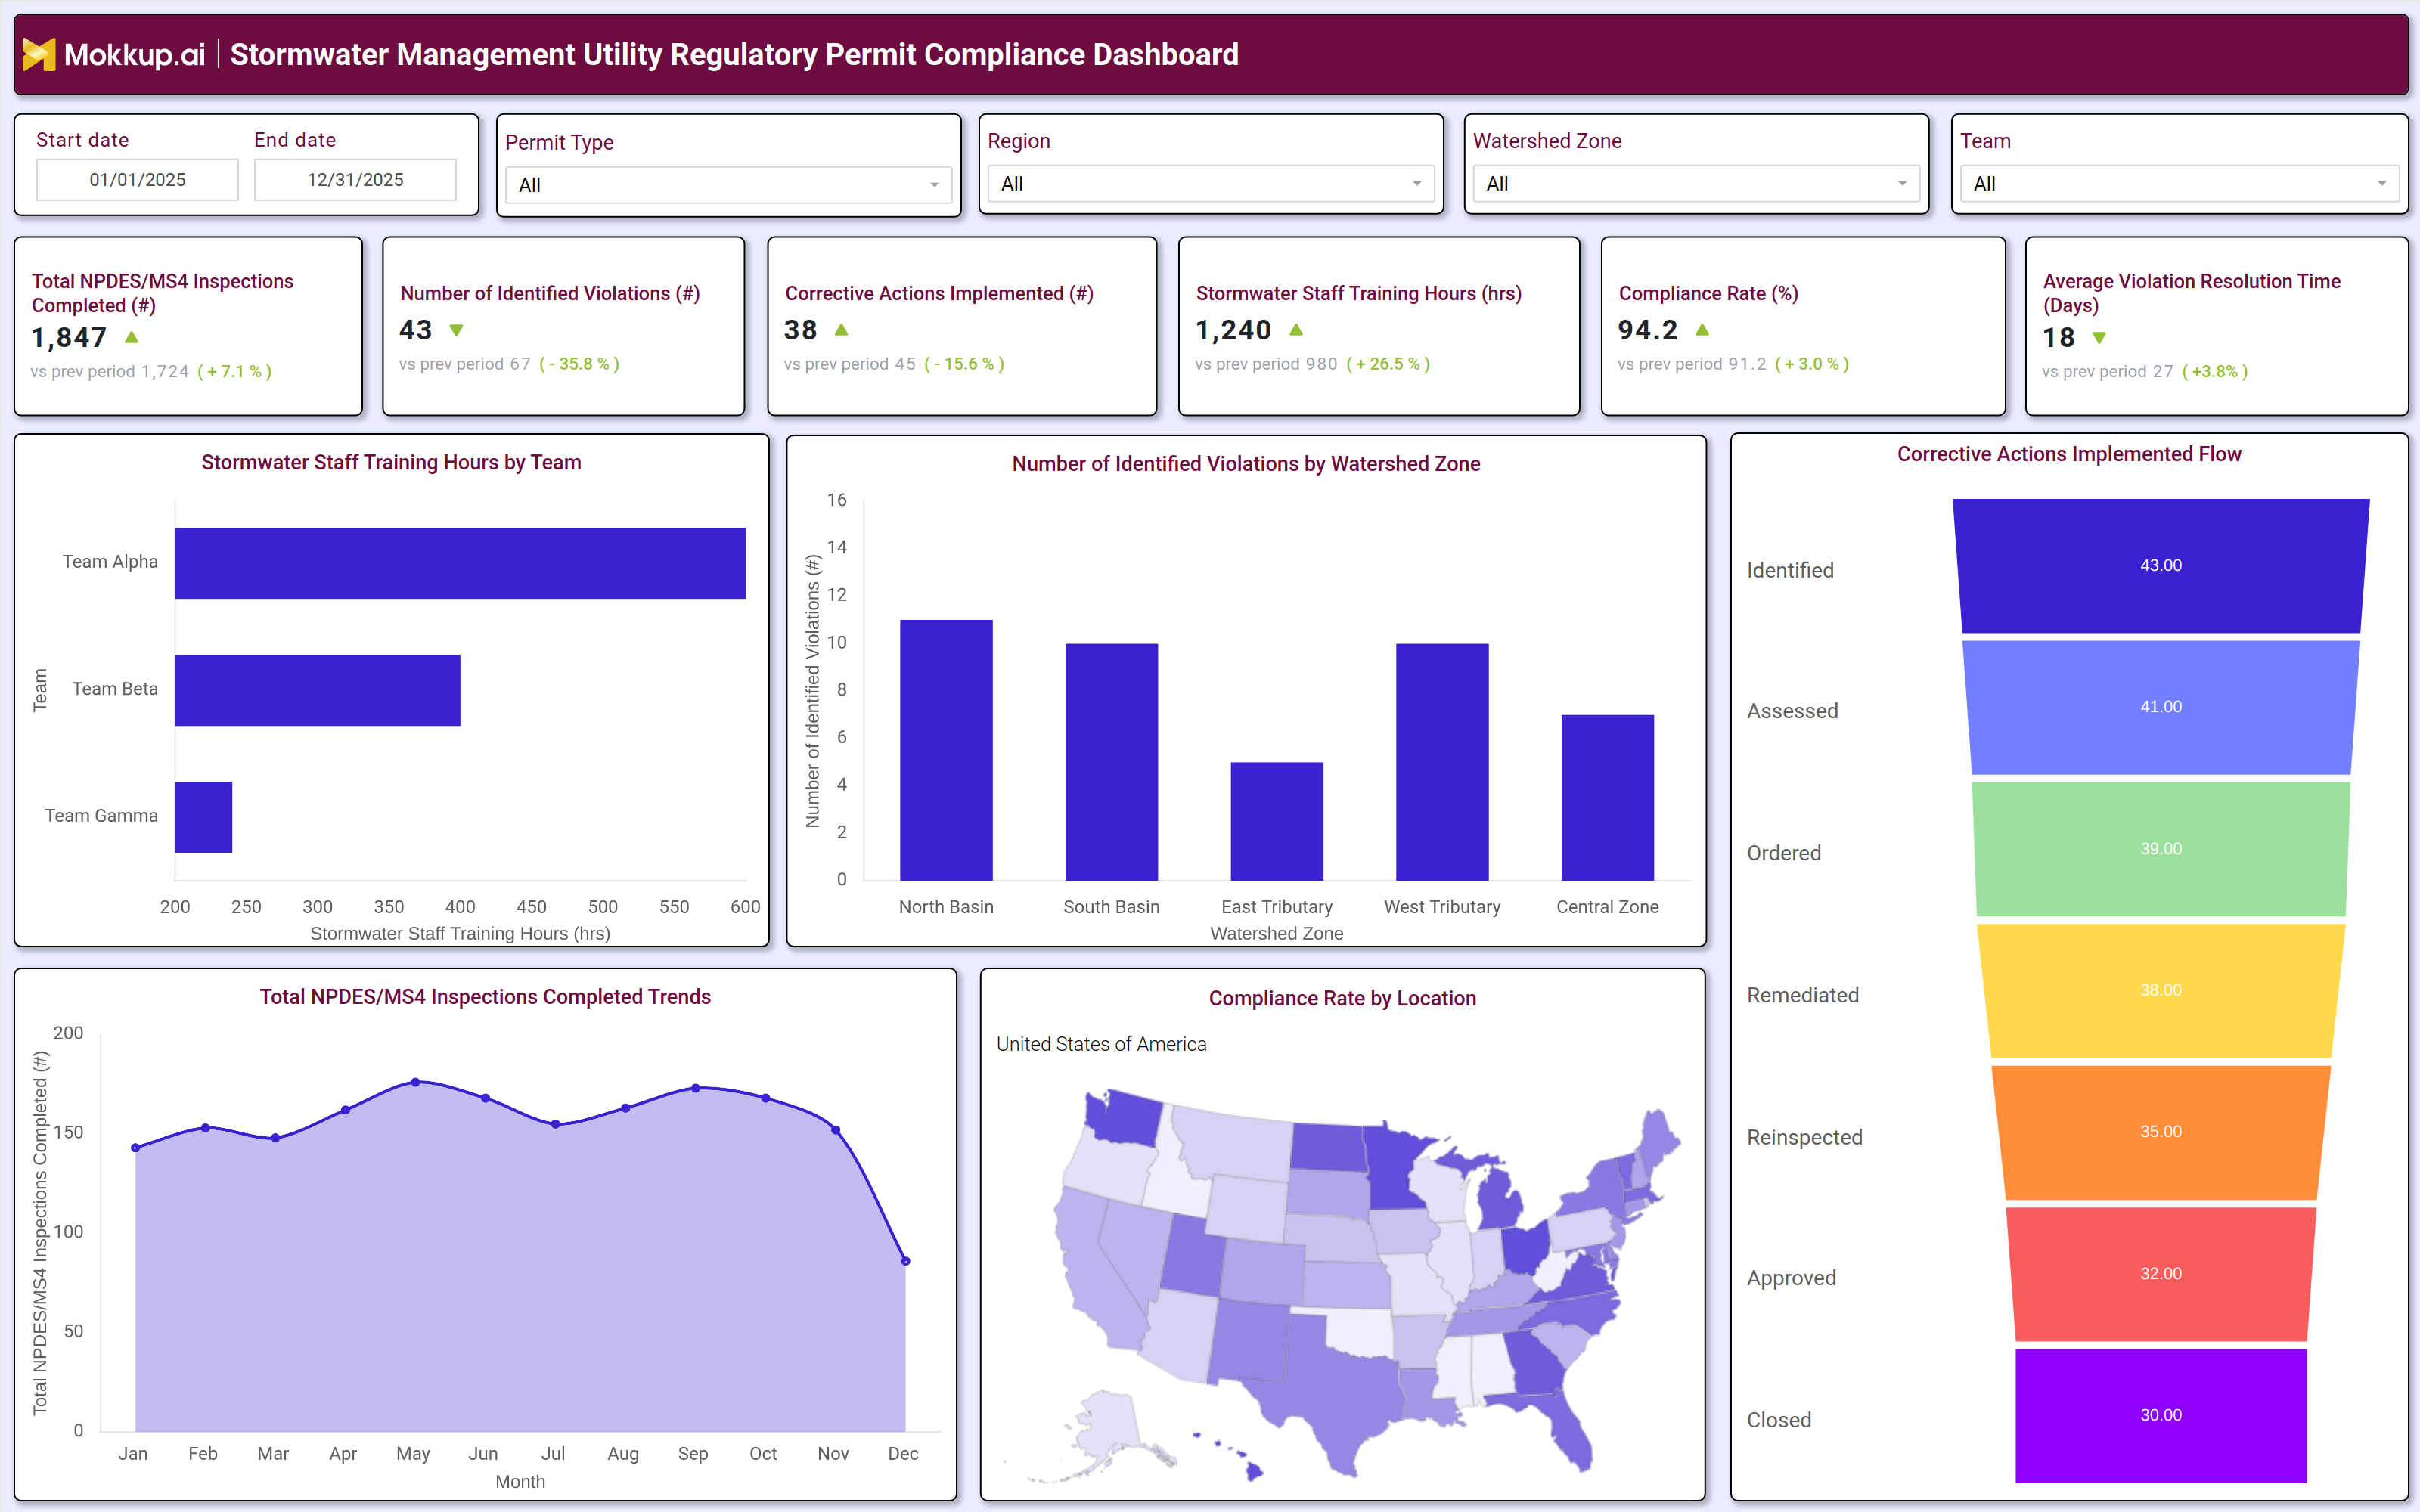
A typical stormwater permit compliance dashboard for municipalities includes interactive filters for date ranges, permit types, regions, and watershed zones. Key performance tiles display total NPDES/MS4 inspections completed, number of identified violations, corrective actions implemented, stormwater staff training hours, compliance rate, and average violation resolution time. Trend charts show inspection completion rates over time, while bar graphs break down violations by watershed zone. The corrective actions implemented flow visualizes the progression from identification to remediation, ensuring transparency in compliance efforts. Geographic heatmaps highlight compliance rates by location, helping utilities identify high risk areas. Together, these components form a water utility stormwater regulatory compliance dashboard that enables data driven decisionmaking for regulatory adherence.
How to Analyze Data in an Stormwater Management Utility Regulatory Permit Compliance Dashboard
Here is how you can analyze data from this water dashboard:
- Review total NPDES/MS4 inspections completed to assess inspection coverage and identify gaps in monitoring.
- Track the number of identified violations to measure compliance performance and detect recurring issues.
- Monitor corrective actions implemented to ensure timely resolution of violations and prevent regulatory penalties.
- Analyze stormwater staff training hours to evaluate workforce readiness and compliance with training requirements.
- Compare compliance rates across regions and watershed zones to identify high risk areas needing intervention.
- Assess average violation resolution time to improve response efficiency and reduce regulatory exposure.
- Use trend analysis to detect patterns in violations and corrective actions over time.
- Evaluate compliance rate trends to measure progress toward regulatory targets.
Benefits of a Stormwater Management Utility Regulatory Permit Compliance Dashboard
The following are the benefits of using this stormwater inspection monitoring dashboard:
- Enhances workforce productivity by tracking task completion rates and identifying inefficiencies.
- Improves emergency response times with data-driven insights into crew performance.
- Reduces operational costs by optimizing labor allocation and minimizing overtime.
- Ensures regulatory compliance through automated tracking of inspection and maintenance tasks.
- Supports data-driven decision-making with visual analytics and trend analysis.
- Boosts training effectiveness by correlating training hours with field productivity.
- Increases transparency with centralized performance metrics for management and field teams.
- Helps adapt to weather-related challenges by analyzing how conditions affect workflows.
KPIs to Track in a Stormwater Management Utility Regulatory Permit Compliance Dashboard
The following key KPIs can be tracked by using this utility regulatory permit dashboard:
- Total NPDES/MS4 Inspections Completed (#): Measures the number of regulatory inspections conducted.
- Number of Identified Violations (#): Tracks the total violations detected during inspections.
- Corrective Actions Implemented (#): Monitors the number of violations resolved.
- Stormwater Staff Training Hours (hrs): Evaluates workforce readiness through training completion.
- Compliance Rate (%): Measures the percentage of inspections meeting regulatory standards.
- Average Violation Resolution Time (Days): Tracks how quickly violations are addressed.
Frequently Asked Questions
1. What is an EPA stormwater management dashboard?
A stormwater permit compliance dashboard is a digital tool that helps utilities track, manage, and report compliance with EPA stormwater regulations, including NPDES and MS4 permits.
2. What data sources feed into this NPDES MS4 compliance tracking dashboard?
Inspection records, violation reports, corrective action logs, training databases, and GIS watershed data.
3. How does this water utility stormwater regulatory compliance dashboard improve compliance?
By automating data collection, tracking violations, and streamlining reporting, utilities can reduce regulatory risks and improve response times.