
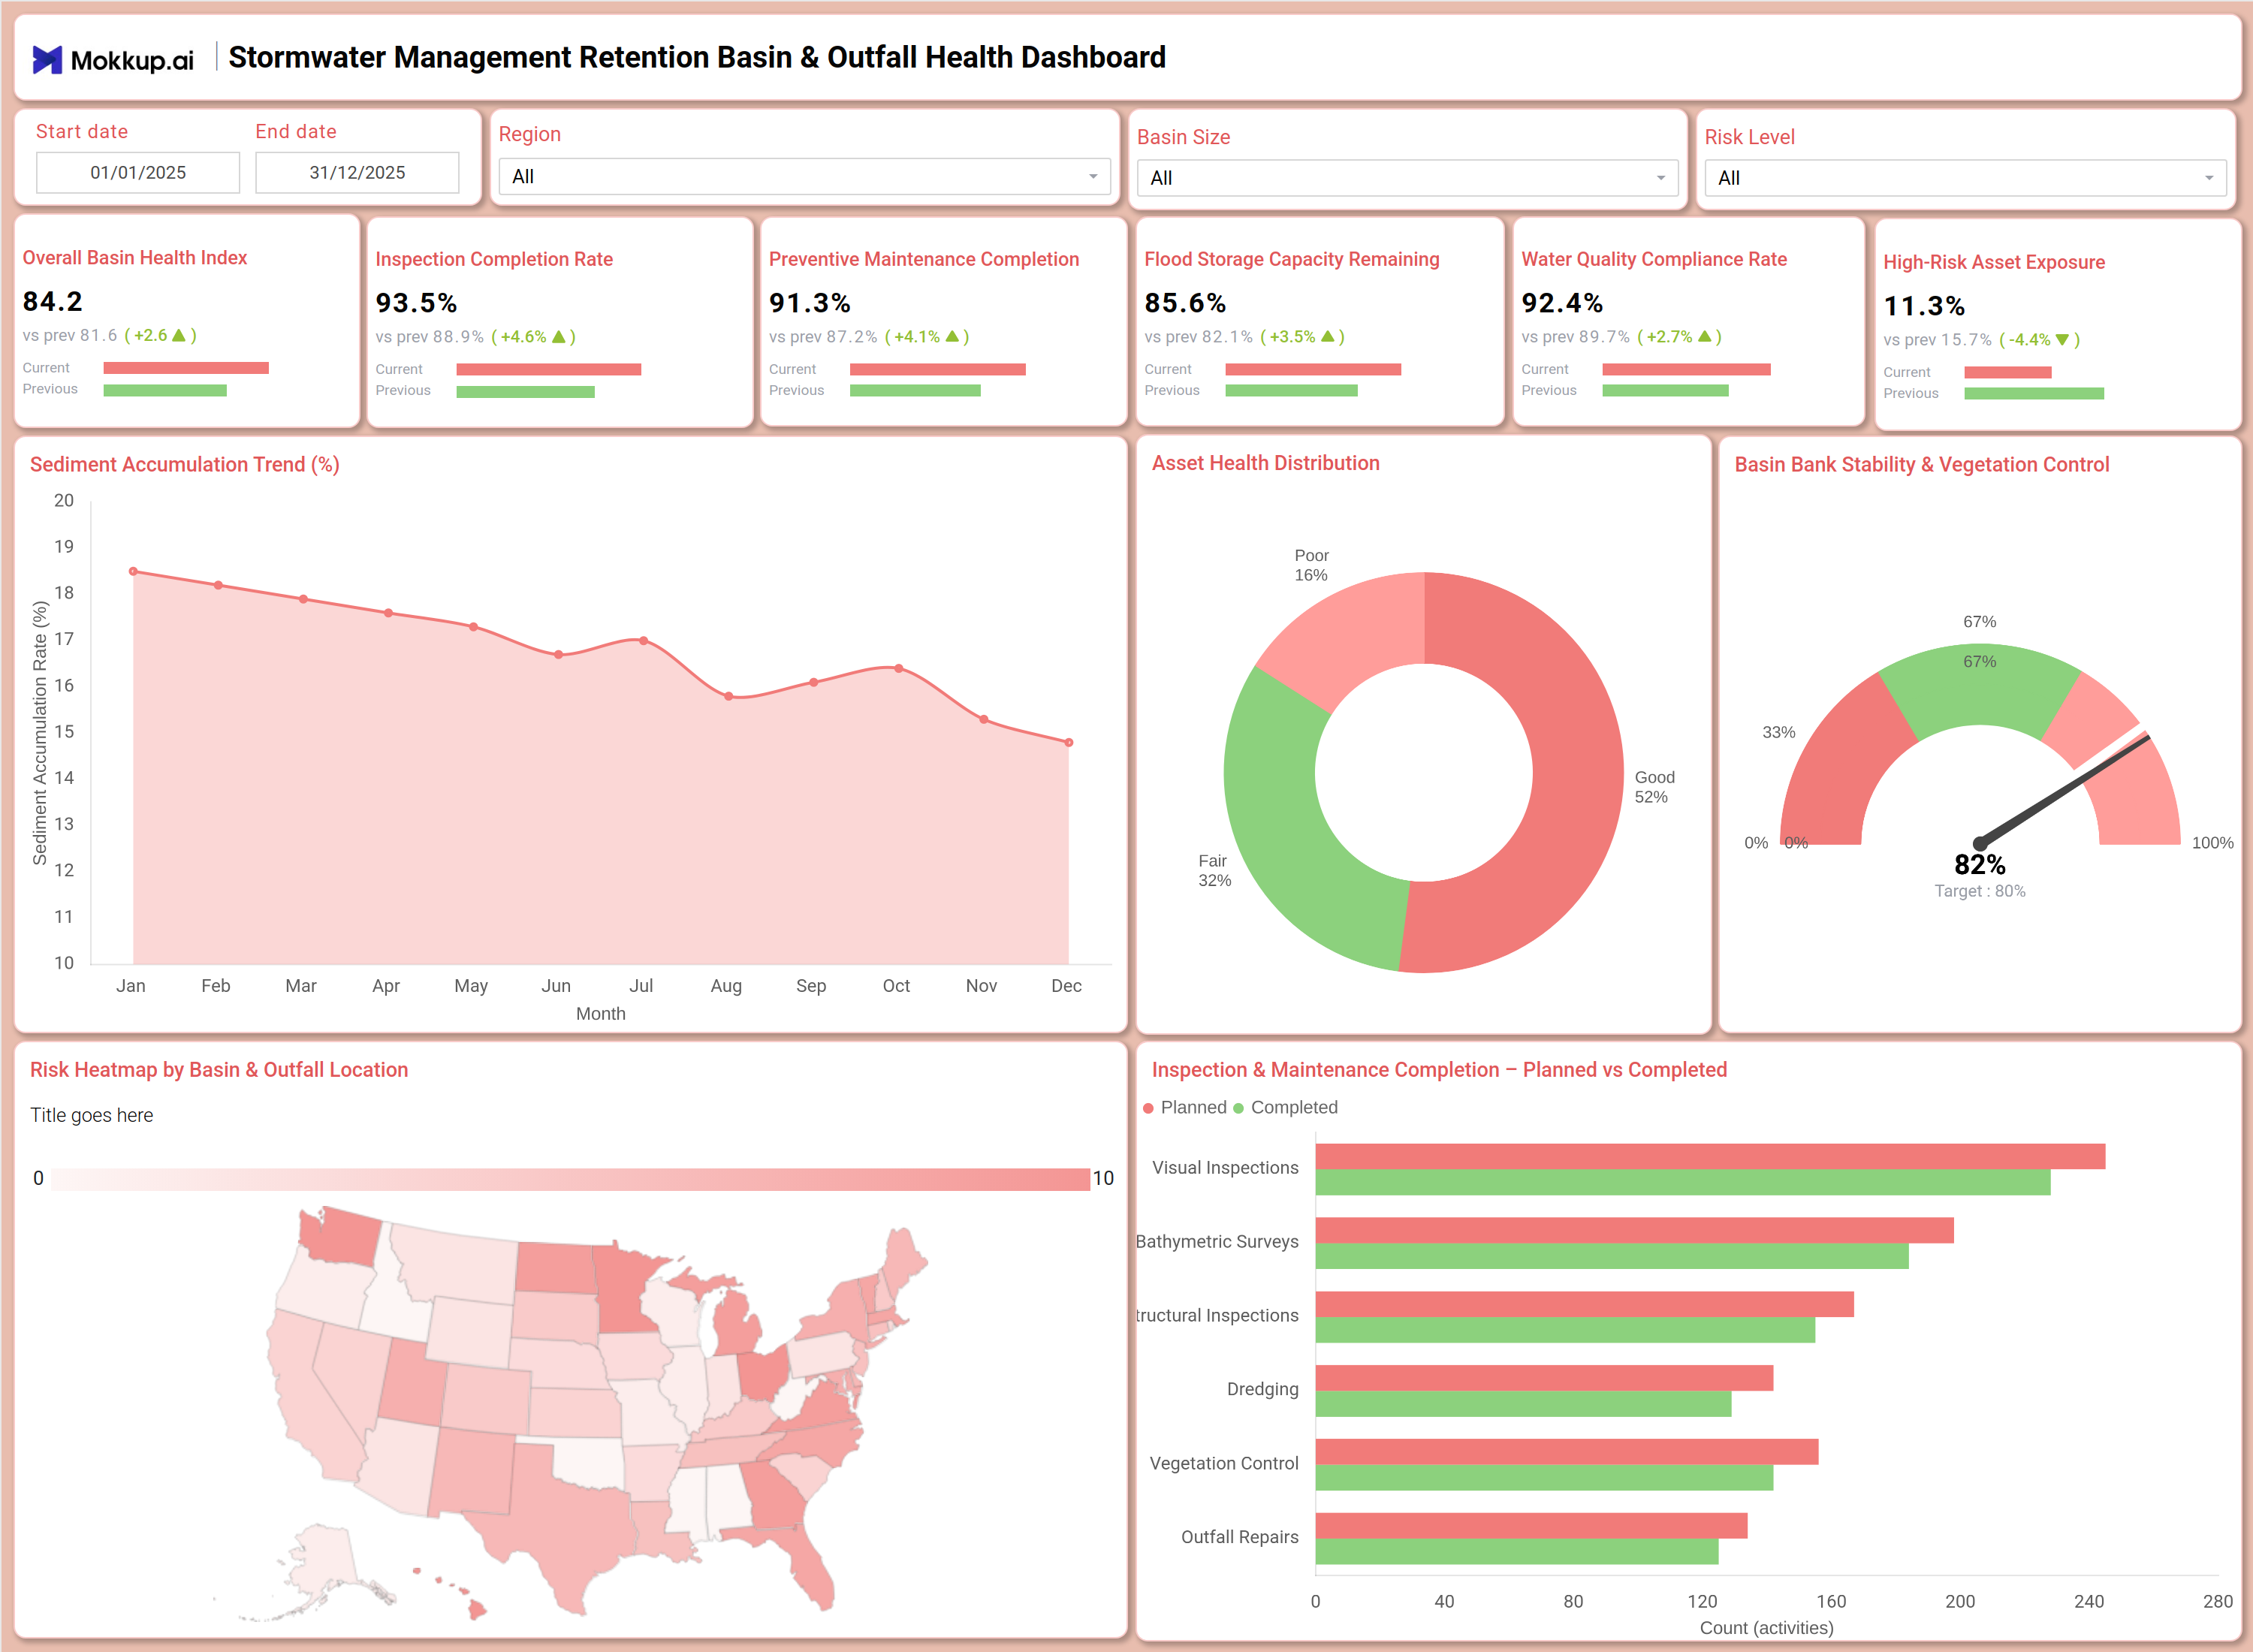
What is a Stormwater Management Retention Basin & Outfall Health Dashboard?
The Stormwater Management Retention Basin & Outfall Health Dashboard is a purpose-built monitoring tool used by municipal engineers, environmental compliance teams, and public works departments to oversee the condition and performance of stormwater infrastructure. This stormwater retention basin monitoring dashboard consolidates critical data across basin capacity, outfall discharge quality, and structural health into a single view. It tracks KPIs such as Basin Capacity Utilization, Outfall Discharge Compliance Rate, Sediment Accumulation Level, Water Quality Index, Inspection Status, and Overflow Event Count. By centralizing stormwater infrastructure performance tracking, this dashboard helps teams detect deterioration early and respond before regulatory thresholds are breached.
How to Create a Stormwater Management Retention Basin & Outfall Health Dashboard
You don't need to build your report from scratch, just start with a ready-to-use dashboard template from Mokkup. Add in your data and export it however you like. Here's how to do it:
1. Create or Log in to Your Mokkup Account
Start by signing up on Mokkup.ai using your email. If you already have an account, just log in, and you'll be good to go.
2. Choose and Customize Your Dashboard Template
Find the Stormwater Management Retention Basin & Outfall Health Dashboard template in the Templates section. Use the drag-and-drop editor to adjust KPIs, edit filters, or add elements based on your data.
3. Export to Your BI Tool
Once your dashboard wireframe is ready, use the BI Tool Export feature to send it directly to Power BI or Tableau for further analysis and enhancements. You can also download the dashboard as a PDF, PNG, or JPEG, embed it on a platform, or invite your team to collaborate.
Note: This is a Pro template. You'll need a Pro subscription on Mokkup to use and customize this dashboard wireframe. Upgrade anytime to unlock full access.
Stormwater Management Retention Basin & Outfall Health Dashboard Example
A stormwater program manager opens this dashboard at the start of the week to answer one core question: which basins and outfalls need attention before the next heavy rainfall event? Rather than pulling inspection reports from separate spreadsheets or field logs, every relevant metric is already organized by site, region, and inspection cycle. Using the Region and Basin ID filters at the top, the manager narrows the view to a specific watershed district. The KPI tiles at the top immediately surface Basin Capacity Utilization, Outfall Discharge Compliance Rate, and Sediment Accumulation Level for that area. The outfall health tracking stormwater chart in the center shows discharge quality trends over the selected date range, making it straightforward to identify sites approaching permit limits. The Inspection Status summary and Overflow Event Count tile confirm which basins have overdue inspections and how often overflow events have occurred this season. The overall outcome this stormwater management compliance dashboard delivers is operational confidence — maintenance crews get prioritized work orders, compliance officers get audit-ready records, and program managers get a clear view of infrastructure health across all monitored sites. Teams no longer need to reconcile fragmented field data; the dashboard turns inspection logs and sensor readings into structured, actionable intelligence.
How to Analyze Data in a Stormwater Management Retention Basin & Outfall Health Dashboard
Here is how you can analyze data from this dashboard:
- Region-Based Performance Analysis – Filter data by region to evaluate stormwater performance within specific watershed districts or service zones.
- Basin-Level Analysis – Use the Basin ID filter to review capacity and sediment data for individual retention basins.
- Basin Capacity Monitoring – Track basin capacity utilization to identify sites nearing maximum storage before storm events.
- Outfall Discharge Trend Analysis – Monitor outfall discharge trends to assess stormwater system performance over time.
- Sediment Accumulation Monitoring – Analyze sediment levels to identify basins requiring dredging or maintenance.
- Inspection Status Tracking – Review inspection status to prioritize field visits for overdue or failed basin inspections.
- Water Quality Assessment – Evaluate the Water Quality Index to identify outfall locations with the highest pollutant levels.
- Overflow Event Monitoring – Track overflow events over time to measure infrastructure performance and reduce recurring incidents.
Benefits of a Stormwater Management Retention Basin & Outfall Health Dashboard
The following are the benefits of using this dashboard:
- Centralized Stormwater Asset Visibility – Consolidate basin capacity, outfall discharge quality, and inspection status into a single operational view.
- Streamlined Retention Basin Monitoring – Combine sensor data and field inspection records to simplify stormwater monitoring.
- Reduced Reporting Effort – Simplify regulatory reporting with pre-built KPIs and trend visualizations.
- Improved Maintenance Planning – Analyze basin water quality to prioritize dredging and maintenance activities.
- Enhanced Compliance Monitoring – Track outfall discharge trends to support permit compliance and operational planning.
- Simplified Audit Readiness – Maintain centralized, audit-ready data to support environmental compliance requirements.
- Shared Infrastructure Visibility – Provide field teams and managers with a unified view of stormwater infrastructure health across all sites.
KPIs to Track in a Stormwater Management Retention Basin & Outfall Health Dashboard
The following key KPIs can be tracked by using this dashboard:
- KPIs (Key Performance Indicators) are quantifiable measures used to evaluate the health and compliance of stormwater infrastructure over time.
- Basin Capacity Utilization (%): Measures how much of a retention basin's storage volume is currently in use — central to stormwater retention basin monitoring dashboard operations and flood risk management.
- Outfall Discharge Compliance Rate (%): Tracks the percentage of outfall discharge events that meet permit standards — essential for stormwater management compliance dashboard reporting.
- Sediment Accumulation Level (ft or cm): Quantifies the depth of sediment buildup inside retention basins — a key indicator for maintenance scheduling and retention basin water quality metrics.
- Water Quality Index: Measures overall water quality at outfall points against regulatory benchmarks — foundational to outfall health tracking stormwater programs.
- Overflow Event Count: Tracks the number of overflow incidents within the reporting period — supports stormwater outfall inspection dashboard reviews and reduces repeat violations.
- Inspection Status: Evaluates whether scheduled basin and outfall inspections are completed, overdue, or flagged — supporting audit readiness and stormwater infrastructure performance tracking across all sites.
Frequently Asked Questions
1. What industries benefit most from this Stormwater Management Retention Basin & Outfall Health Dashboard?
Municipal public works departments, environmental engineering firms, and water utilities managing regulated stormwater systems benefit most. Compliance officers and watershed program managers also use it to meet permit reporting requirements.
2. Can this dashboard track multiple retention basins and outfall sites simultaneously?
Yes. The Region and Basin ID filters allow users to view aggregate performance across all monitored sites or drill into individual locations. This makes it suitable for programs managing dozens of basins across a city or county.
3. How does the Outfall Discharge Trend chart work?
The Outfall Discharge Trend chart plots outfall discharge quality readings over the selected date range, showing whether compliance rates are improving or declining. Users can spot seasonal patterns and identify sites that consistently approach permit thresholds.