
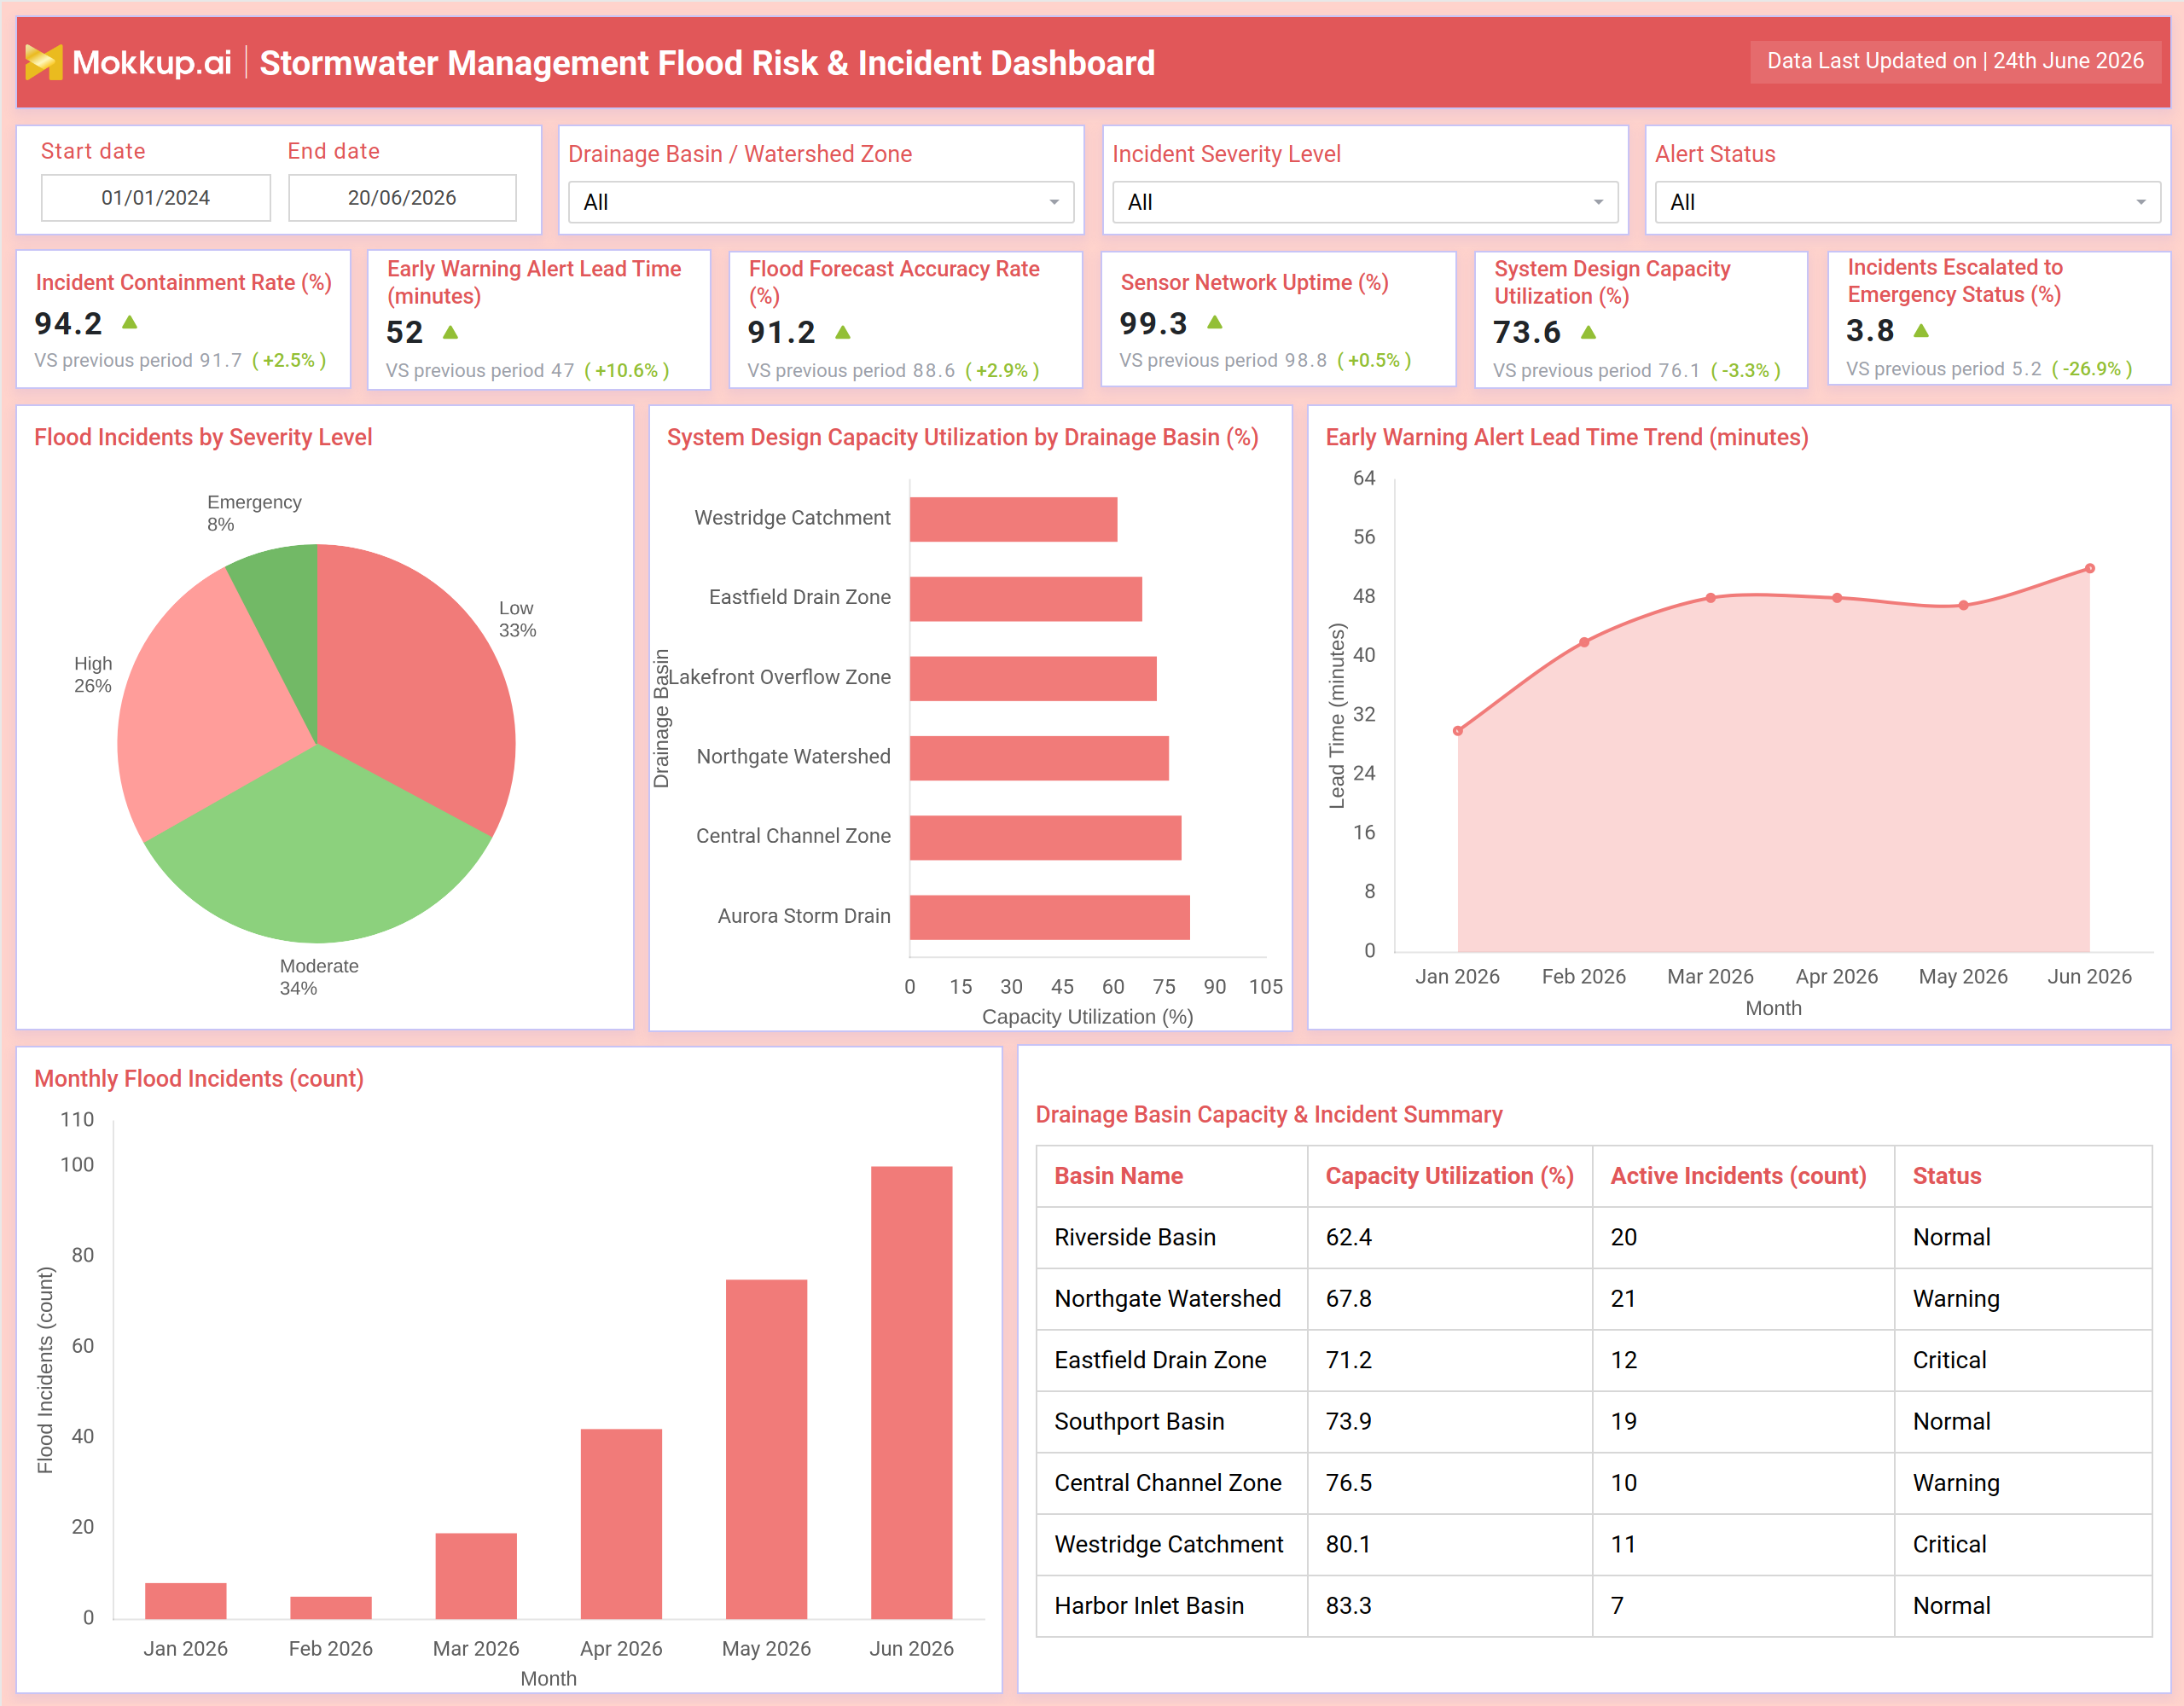
What is a Stormwater Management Flood Risk & Incident Dashboard?
The Stormwater Management Flood Risk & Incident Dashboard is a structured analytics tool built for city engineers, public works departments, and emergency response coordinators who manage urban drainage networks. It brings together key operational metrics from incident containment rates to sensor reliability and alert response times into a single, actionable view. Teams responsible for municipal stormwater infrastructure monitoring rely on this dashboard to track conditions across multiple drainage basins simultaneously without toggling between disconnected systems. The dashboard addresses a persistent operational gap: critical flood data is often scattered across separate reports and systems, creating delays when fast decisions matter most.
By centralizing flood incident management analytics into one screen, this tool helps operations managers shift from reactive scrambling to structured, consistent oversight. It bridges the distance between field observations and leadership decisions by making the state of the entire drainage network visible at a glance. Whether teams are managing routine drainage oversight or coordinating an active incident response, this dashboard adjusts to the operational moment. Filters for drainage basin, incident severity level, and alert status allow users to focus on the most pressing conditions while keeping visibility across the full network. Stormwater flood risk monitoring becomes a disciplined, repeatable practice rather than a fragmented effort pieced together under pressure.
How to Create a Stormwater Management Flood Risk & Incident Dashboard
You don't need to build your report from scratch; just start with a ready-to-use dashboard template from Mokkup. Add in your data and export it however you like. Here's how to do it:
1. Create or Log in to Your Mokkup Account
Start by signing up on Mokkup.ai using your email. If you already have an account, just log in, and you'll be good to go.
2. Choose and Customize Your Dashboard Template
Find the Stormwater Management Flood Risk & Incident Dashboard template in the Templates section. Use the drag-and-drop editor to adjust KPIs, edit filters, or add elements based on your data.
3. Export to Your BI Tool
Once your dashboard wireframe is ready, use the BI Tool Export feature to send it directly to Power BI or Tableau for further analysis and enhancements. You can also download the dashboard as a PDF, PNG, or JPEG, embed it on a platform, or invite your team to collaborate.
Note: This is a Pro template. You'll need a Pro subscription on Mokkup to use and customize this dashboard wireframe. Upgrade anytime to unlock full access.
Stormwater Management Flood Risk & Incident Dashboard Example
A city stormwater operations manager opens this dashboard after receiving internal alerts about rising water levels across several watershed zones. Her immediate question is which basins are approaching capacity and whether existing containment measures are holding. Rather than pulling data from multiple systems, she uses this single view to assess network-wide conditions and decide where her team should act first. For operations teams practicing stormwater flood risk monitoring, this kind of consolidated view is essential during high-pressure situations. With filters applied by drainage basin and incident severity, she compares how different zones are performing relative to their infrastructure limits.
She evaluates whether flood warning alert lead times have been sufficient for pre-emptive action, and assesses whether incident escalation rates have shifted over recent months. Basins that have moved from normal to warning or critical status stand out immediately, signaling that drainage basin capacity tracking requires direct attention and potential crew deployment. The outcome is a structured, evidence-based response plan. Field crews are sent to the highest-risk zones, while city leadership receives a clear summary of escalation trends. Because the workflow is grounded in consistent stormwater incident severity analysis, decisions are faster and based on shared data, not fragmented field reports that arrive hours after conditions change.
How to Analyze Data in a Stormwater Management Flood Risk & Incident Dashboard
Here is how you can analyze data from this dashboard:
- Filter by drainage basin or watershed zone to isolate specific areas of concern.
- Compare monthly flood incident counts to identify seasonal patterns or escalating risk trends.
- Evaluate system design capacity utilization across basins to pinpoint overloaded zones.
- Track alert lead time trends over time to assess whether forecasting is improving or degrading.
- Use incident severity breakdowns to prioritize containment resource allocation across the network.
- Cross-reference active incident counts with basin status to assess overall system pressure.
- Monitor sensor network uptime to verify data reliability before acting on operational signals.
Benefits of a Stormwater Management Flood Risk & Incident Dashboard
The following are the benefits of using this dashboard:
- Centralizes flood risk and drainage data across the entire watershed network in one view.
- Enables faster incident prioritization based on severity level and basin capacity status.
- Supports proactive infrastructure management by surfacing trend data before conditions escalate.
- Reduces dependence on manual data aggregation during active flood events.
- Helps operations teams evaluate alert system effectiveness over time.
- Gives leadership a consistent, up-to-date picture of containment performance and escalation rates.
KPIs to Track in a Stormwater Management Flood Risk & Incident Dashboard
The following key KPIs can be tracked by using this dashboard:
- Incident Containment Rate (%): Measures the proportion of flood incidents managed without escalation, indicating the overall effectiveness of response protocols.
- Early Warning Alert Lead Time (minutes): Tracks how far in advance alerts are generated before an incident reaches critical status — a core measure of flood warning alert lead time effectiveness.
- Flood Forecast Accuracy Rate (%): Reflects how closely flood predictions align with actual conditions, helping teams calibrate planning models and improve future preparedness.
- Sensor Network Uptime (%): Indicates the percentage of time the sensor network is fully operational, ensuring data integrity for reliable flood incident management analytics.
- System Design Capacity Utilization (%): Measures how much of each basin's infrastructure capacity is currently in use, enabling consistent drainage basin capacity tracking across the network.
- Incidents Escalated to Emergency Status (%): Captures the rate at which incidents exceed standard response thresholds, highlighting where municipal stormwater infrastructure monitoring may need reinforcement.
Frequently Asked Questions
1. Who is this dashboard designed for?
This dashboard is built for city engineers, stormwater operations managers, and municipal emergency coordinators who manage drainage infrastructure and flood response. It is best suited for teams that need a unified view of network-wide conditions across multiple drainage basins.
2. Can the dashboard be filtered by specific drainage basins?
Yes, the dashboard includes a Drainage Basin / Watershed Zone filter that lets users focus on individual zones. This makes it straightforward to isolate capacity utilization, active incident counts, and alert status for specific areas of the network.
3. Does the dashboard support stormwater incident severity analysis?
Yes, an Incident Severity Level filter allows teams to segment data by Emergency, High, Moderate, or Low categories. This supports targeted stormwater incident severity analysis by showing which severity types are most prevalent and how effectively they are being managed.