
What is a Coal Power Plant Infrastructure Management Dashboard?
A Coal Power Plant Infrastructure Management Dashboard is an integrated digital platform that helps monitor, manage, and maintain all critical assets and utilities within a coal-based power generation facility. It offers visibility into equipment performance, maintenance activities, and operational reliability across departments such as electrical, mechanical, and civil infrastructure. This infrastructure maintenance analytics dashboard provides a centralized system for tracking asset conditions, maintenance schedules, and trends in downtime. It empowers plant engineers and facility managers with actionable insights derived from performance data, helping them improve efficiency, reduce maintenance costs, and extend asset life cycles. In modern thermal power operations, such a power plant facility management system ensures that the plant remains compliant with safety and performance standards while minimizing risks associated with equipment failures and unplanned downtime.
How to Create a Coal Power Plant Infrastructure Management Dashboard
You don’t need to build your report from scratch—just start with a ready-to-use dashboard template from Mokkup. Add your data and export it as needed. Here’s how to do it:
1. Create or Log in to Your Mokkup Account
Start by signing up on Mokkup.ai using your email. If you already have an account, log in, and you’ll be good to go.
2. Choose and Customize Your Dashboard Template
Find the Coal Power Plant Infrastructure Management Dashboard template in the Templates section. Use the drag-and-drop editor to adjust KPIs, edit filters, or add elements based on your data.
3. Export to Your BI Tool
Once your dashboard wireframe is ready, use the BI Tool Export feature to send it directly to Power BI or Tableau for further analysis and enhancements. You can also download the dashboard as a PDF, PNG, or JPEG, embed it on a platform, or invite your team to collaborate.
Note: This is a Pro template. You’ll need a Pro subscription on Mokkup to use and customize this dashboard wireframe. Upgrade anytime to unlock full access.
Coal Power Plant Infrastructure Management Dashboard Example
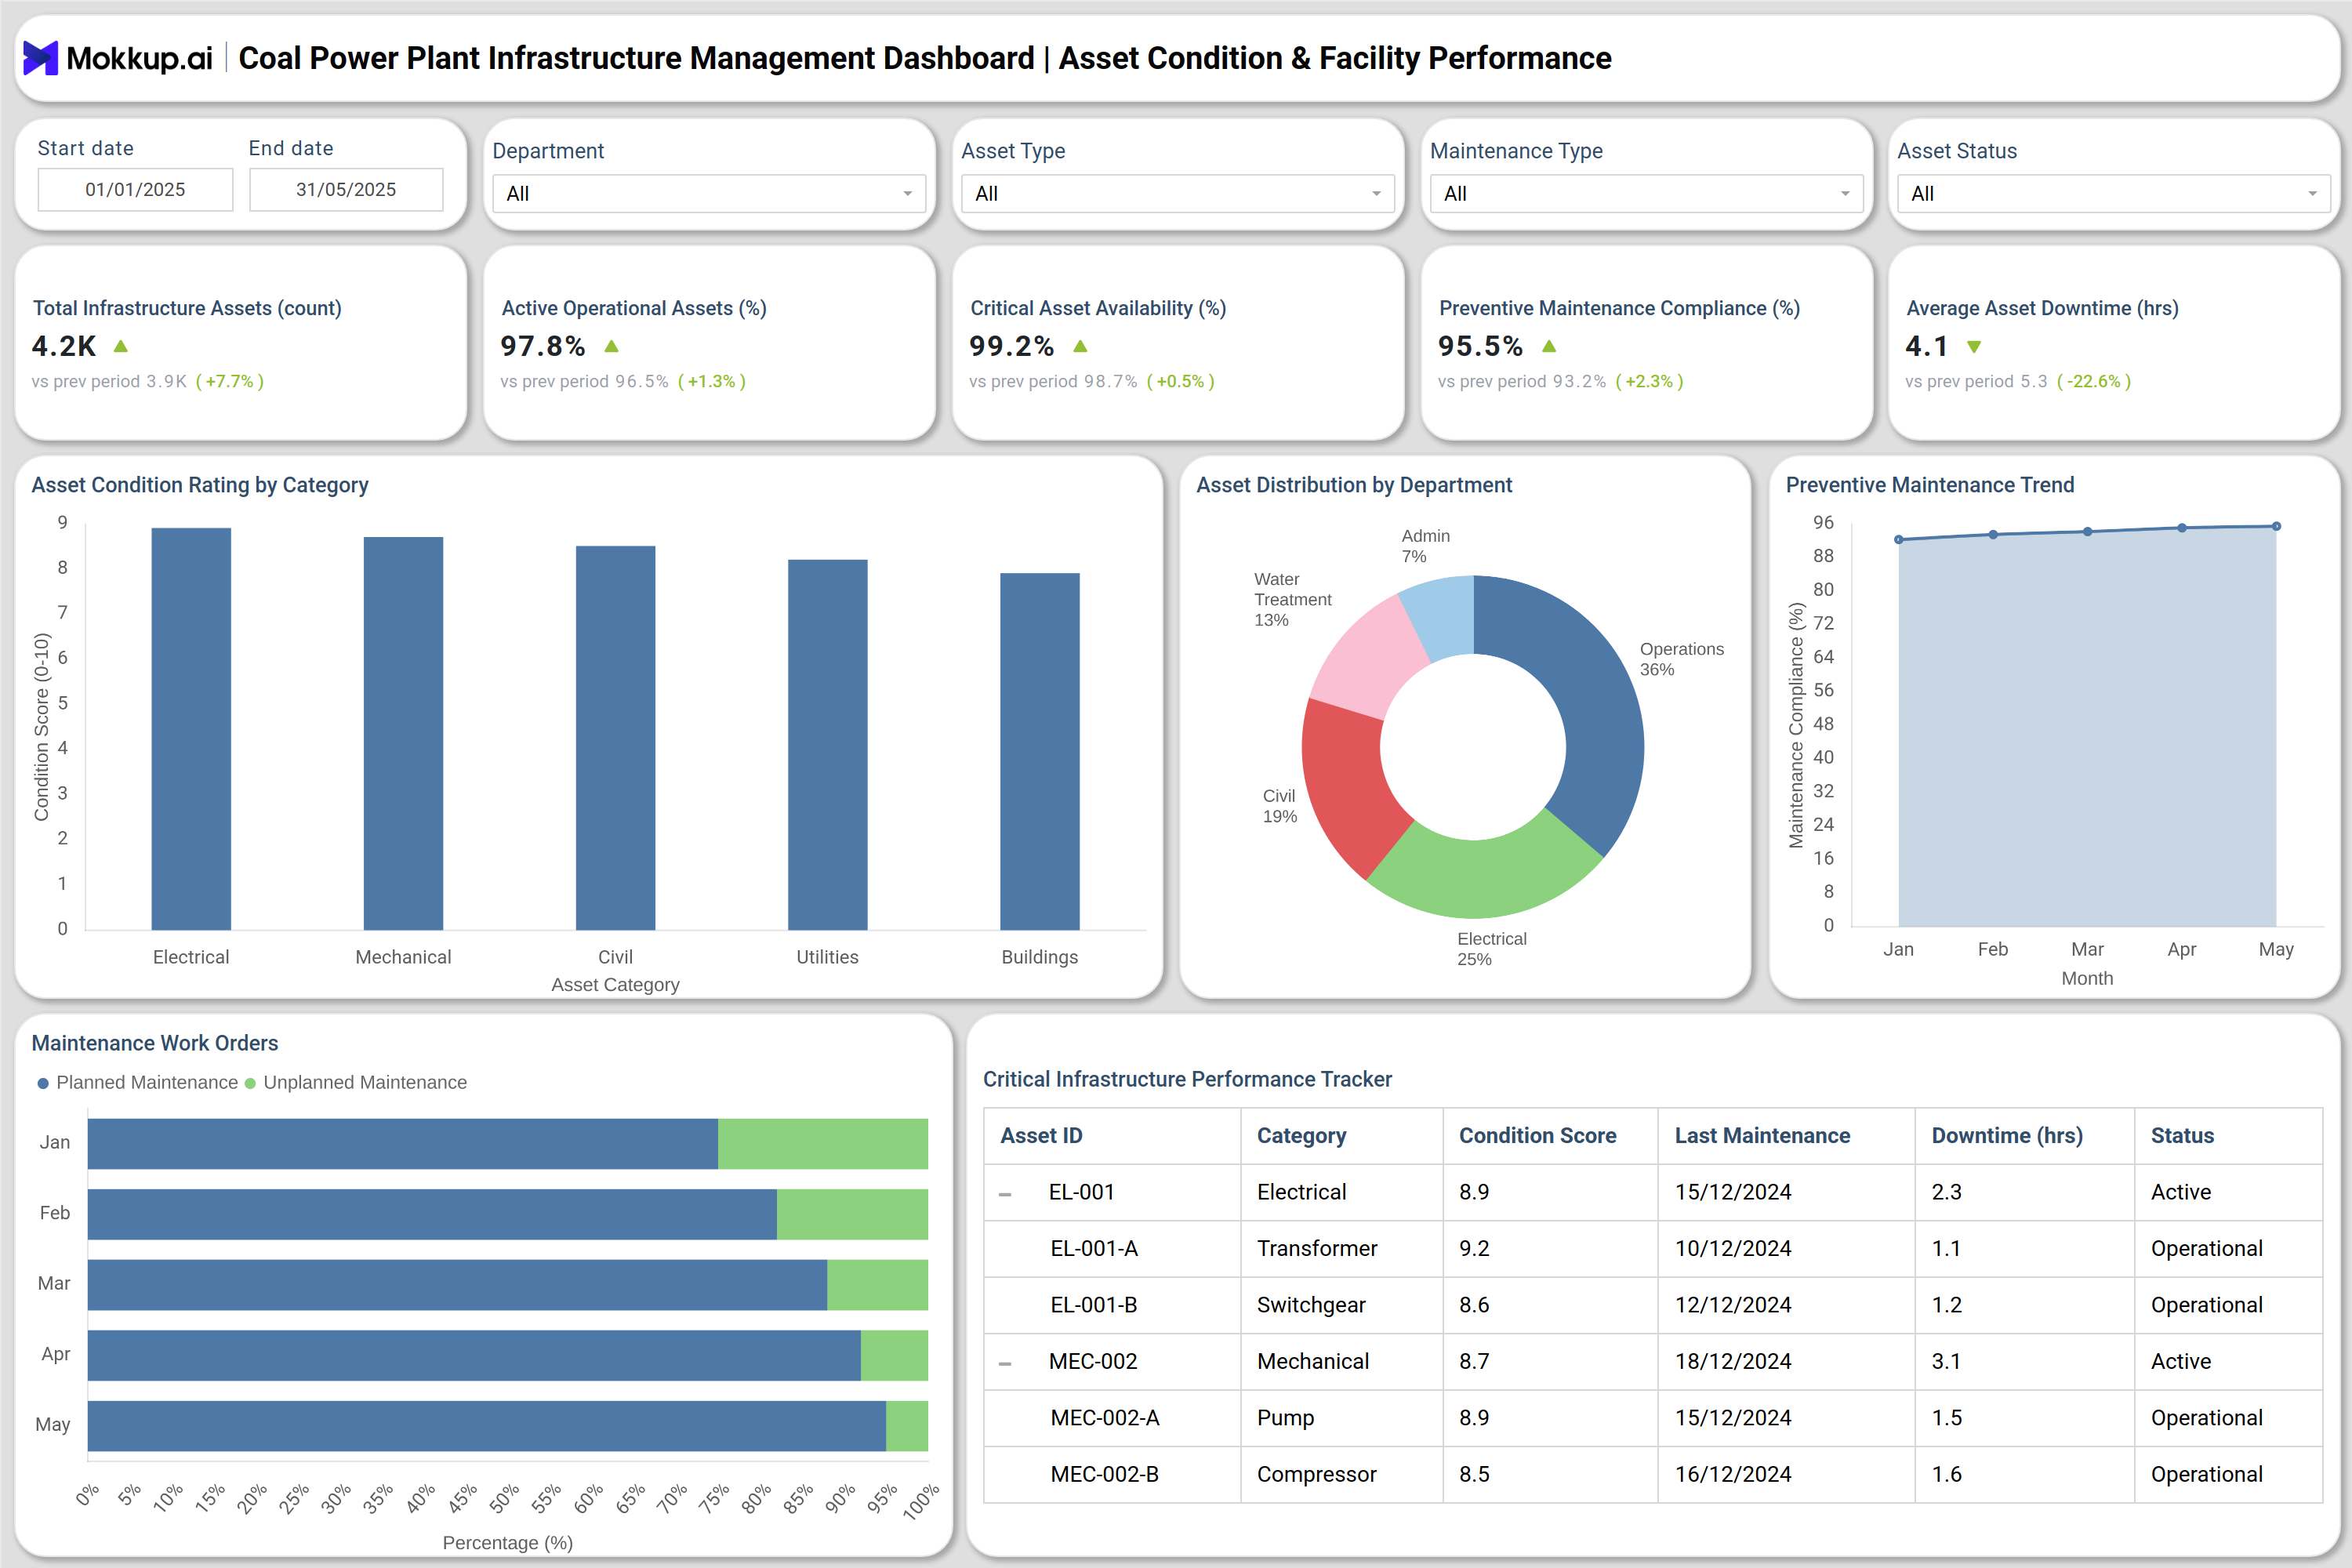
You can create a Coal Power Plant Infrastructure Management Dashboard that unifies both asset performance and utilities efficiency metrics into a single, data-driven interface. The Asset Condition & Facility Performance Dashboard tracks parameters such as total infrastructure assets, asset availability, maintenance compliance, and downtime hours. It also includes asset condition ratings across various categories, such as electrical, mechanical, and utilities. By visualizing preventive maintenance trends, critical asset availability, and departmental asset distribution, operators can easily prioritize maintenance actions and monitor operational readiness.
The Utilities & Support Systems Efficiency Dashboard focuses on monitoring internal power consumption, water supply uptime, and overall performance of the utility system. It displays metrics such as maintenance costs, energy efficiency improvement rates, and power system reliability. The dashboard helps evaluate cooling towers, compressed air systems, and lighting efficiency—all of which are essential for smooth plant operation. Together, these dashboards serve as a comprehensive coal power plant asset monitoring solution, combining facility and utility data to enhance plant reliability, reduce energy waste, and support the tracking of energy infrastructure performance.
How to Analyze Data in Coal Power Plant Infrastructure Management Dashboard
Here’s how plant operators and managers can leverage the dashboard:
- Monitor Asset Condition Scores: Track health ratings for electrical, mechanical, and civil assets to identify components needing maintenance or replacement.
- Evaluate Maintenance Trends: Analyze preventive vs. unplanned maintenance activities to determine overall maintenance discipline and efficiency.
- Track Downtime and Availability: Use downtime hours and operational asset percentages to understand productivity impact.
- Review Utility Efficiency: Measure the performance of water, cooling, and HVAC systems to optimize energy usage.
- Compare Energy Consumption: Identify areas where internal power consumption can be reduced to meet sustainability targets.
- Inspect Cost Distribution: Assess maintenance costs by utility type or department to find opportunities for cost reduction.
- Leverage Predictive Analytics: Use predictive maintenance for coal plants to forecast failures and schedule proactive servicing.
Benefits of Coal Power Plant Infrastructure Management Dashboard
- Centralized Asset Monitoring: Insights into all plant infrastructure through an equipment reliability monitoring dashboard.
- Improved Maintenance Planning: Helps teams prioritize maintenance schedules using data-backed decisions.
- Reduced Unplanned Downtime: Prevents equipment breakdowns through early detection of performance anomalies.
- Cost Efficiency: Minimizes maintenance expenditure by optimizing preventive maintenance compliance.
- Operational Transparency: Provides plant-wide visibility into asset health, resource utilization, and performance status.
- Data-Driven Facility Management: Integrates with the power plant facility management system to ensure continuous monitoring.
- Enhanced Equipment Life Cycle: Promotes asset longevity through consistent maintenance and performance tracking.
- Sustainability Alignment: Supports energy-efficient practices by tracking internal consumption and system-level improvements.
KPIs to Track in Coal Power Plant Infrastructure Management Dashboard
- Total Infrastructure Assets (Count): Tracks the number of assets under management.
- Active Operational Assets (%): Measures the share of functioning equipment within total assets.
- Critical Asset Availability (%): Indicates the uptime percentage of high-priority systems.
- Preventive Maintenance Compliance (%): Tracks adherence to maintenance schedules.
- Average Asset Downtime (hrs): Reflects time lost due to maintenance or unplanned failures.
- Asset Condition Rating: Quantifies overall asset health across mechanical, electrical, and civil systems.
- Maintenance Cost (₹): Measures the total cost of planned and corrective maintenance.
- Energy Efficiency Improvement (%): Evaluates progress in power consumption optimization.
- Utilities Availability (%): Tracks the uptime of support systems like HVAC, cooling, and power distribution.
- Work Order Completion Rate (%): Measures maintenance task execution efficiency.
Frequently Asked Questions
1. What is the purpose of a Coal Power Plant Infrastructure Management Dashboard?
It centralizes asset and maintenance data to optimize equipment health, minimize downtime, and enhance facility efficiency.
2. How does this dashboard improve plant performance?
By integrating energy infrastructure performance tracking and predictive analytics, managers can detect inefficiencies early and maintain operational continuity.
3. How does predictive maintenance help?
It uses data-driven models to predict potential equipment failures, allowing teams to perform maintenance before breakdowns occur.