
What is a Stormwater Management Flood Emergency Response & Readiness Dashboard?
The Stormwater Management Flood Emergency Response & Readiness Dashboard is a purpose-built analytics wireframe designed to help municipal water authorities, emergency management agencies, and infrastructure teams monitor and respond to flood events with speed and precision. It consolidates critical operational metrics — from pump readiness and early warning lead times to incident severity distribution and zone-level response performance — into a single, structured view. By providing a centralized lens on both preparedness and active response, this stormwater management flood emergency dashboard enables teams to move from data fragmentation to coordinated action. Whether managing routine drainage operations or responding to a critical flood event, the dashboard brings together the indicators that matter most — helping decision-makers assess risk, allocate resources, and measure readiness across geographic zones and asset classes. It serves as an essential operational command center for any organization responsible for flood emergency response readiness tracking and infrastructure resilience.
How to Create a Stormwater Management Flood Emergency Response & Readiness Dashboard
You don't need to build your report from scratch; just start with a ready-to-use dashboard template from Mokkup. Add in your data and export it however you like. Here's how to do it:
1. Create or Log in to Your Mokkup Account
Start by signing up on Mokkup.ai using your email. If you already have an account, just log in, and you'll be good to go.
2. Choose and Customize Your Dashboard Template
Find the Stormwater Management Flood Emergency Response & Readiness Dashboard template in the Templates section. Use the drag-and-drop editor to adjust KPIs, edit filters, or add elements based on your data.
3. Export to Your BI Tool
Once your dashboard wireframe is ready, use the BI Tool Export feature to send it directly to Power BI or Tableau for further analysis and enhancements. You can also download the dashboard as a PDF, PNG, or JPEG, embed it on a platform, or invite your team to collaborate.
Note: This is a Pro template. You'll need a Pro subscription on Mokkup to use and customize this dashboard wireframe. Upgrade anytime to unlock full access.
Stormwater Management Flood Emergency Response & Readiness Dashboard Example
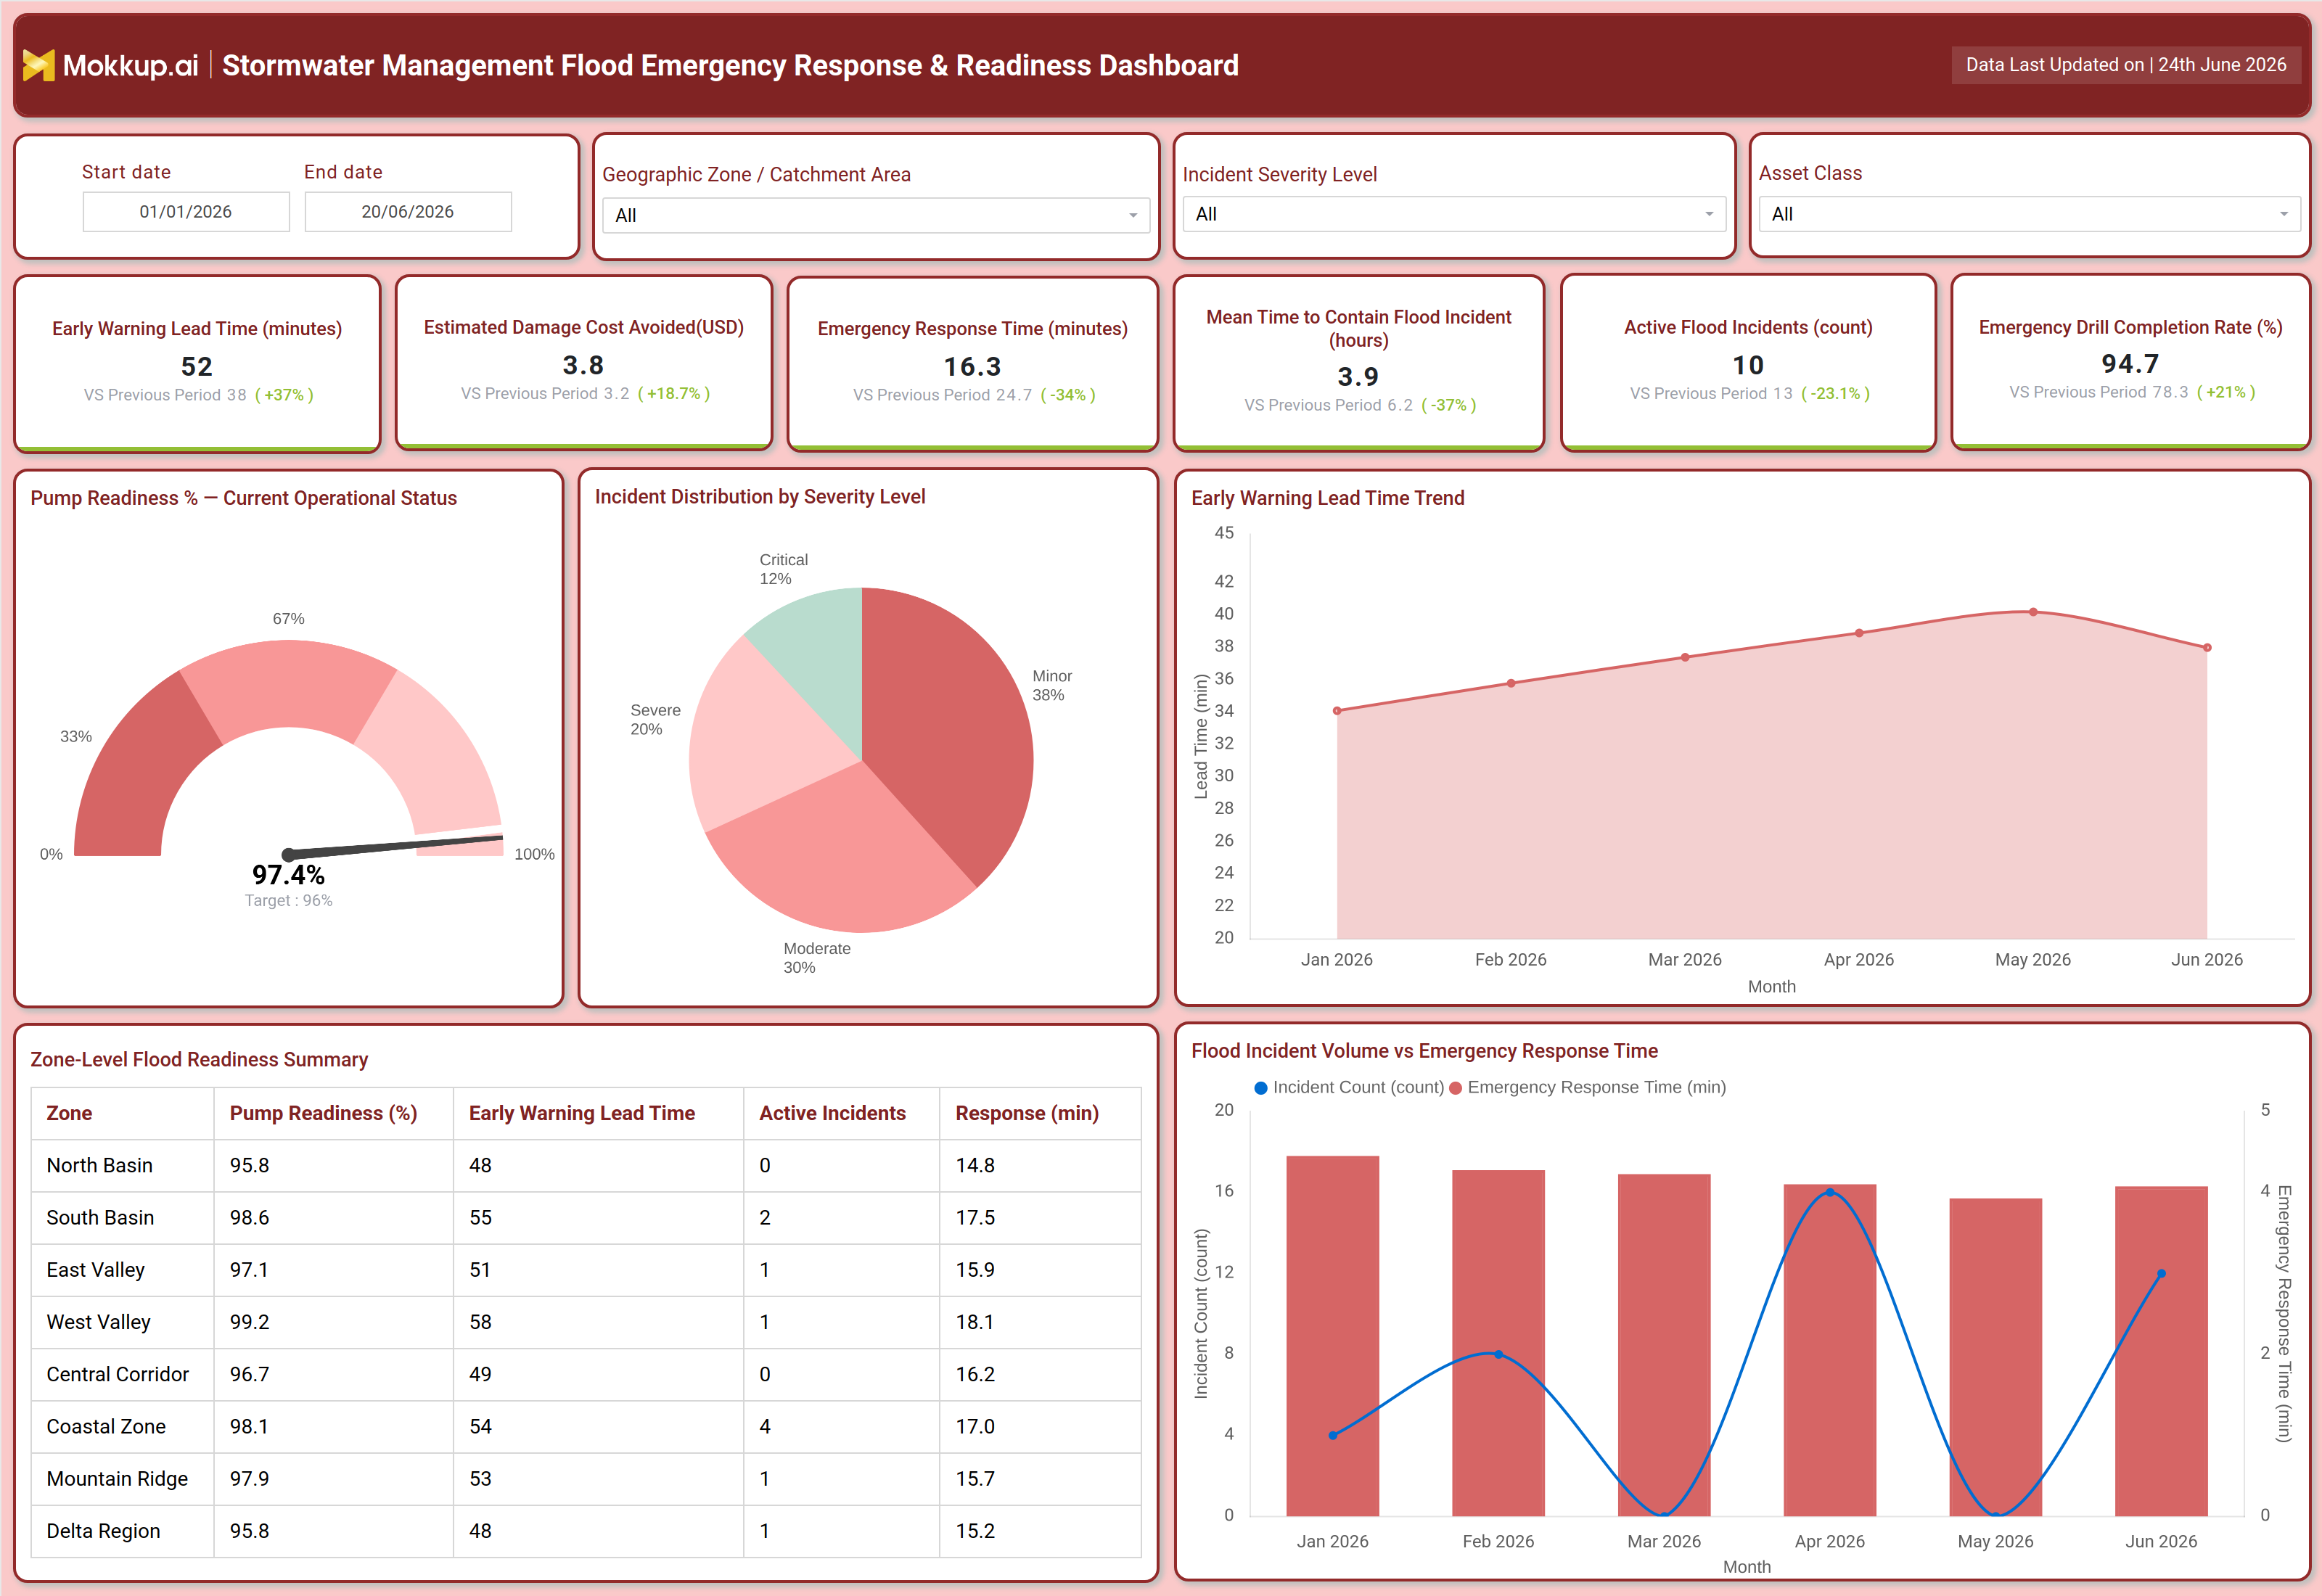
An emergency operations manager at a city water authority opens this dashboard at the start of a storm advisory, looking to answer a central question: Is the organization equipped to respond if conditions escalate? They need to quickly assess current pump readiness, understand where active flood incidents are concentrated, and determine whether response capacity is aligned with geographic risk. This flood emergency response readiness tracking tool gives them that situational clarity before a single call is made. With the dashboard loaded, the manager can immediately identify which zones are most exposed, compare early warning lead times against historical trends, and prioritize resource deployment based on pump readiness operational status dashboard data by catchment area.
The incident severity breakdown allows the team to distinguish between low-priority drainage events and critical infrastructure threats, while the zone-level table surfaces where active incidents are outpacing response capacity. This kind of zone-level flood incident management visibility is what separates reactive firefighting from structured operational control. Beyond immediate response, the dashboard also supports post-event analysis. Teams can track how drill completion rates correlate with response performance, assess whether flood damage cost avoidance reporting tool metrics are trending in the right direction, and identify zones where readiness gaps require infrastructure investment.
The combo chart comparing flood incident volume against emergency response time provides a clear picture of whether capacity is keeping pace with incident load over time. Ultimately, this stormwater management flood emergency dashboard helps emergency management teams move from intuition-driven decisions to evidence-based operational planning. By leveraging early warning lead time flood monitoring trends alongside live incident data, organizations can demonstrate preparedness to stakeholders, justify budget allocations, and continuously improve their flood response capability across all geographic zones.
How to Analyze Data in a Stormwater Management Flood Emergency Response & Readiness Dashboard
Here is how you can analyze data from this dashboard:
- Use the date range and Geographic Zone filters to scope the view to the period and catchment area under review
- Check the pump readiness operational status dashboard gauge to assess current infrastructure availability before any incident
- Track Early Warning Lead Time trend lines to identify whether advance notice windows are improving or narrowing
- Review the incident severity pie chart to understand the distribution between critical, moderate, and minor events
- Compare flood incident volume against emergency response time in the combo chart to detect capacity bottlenecks
- Scan the Zone Level Flood Readiness Summary table to pinpoint zones with low pump readiness or high active incident counts
- Filter by Incident Severity Level and Asset Class to focus analysis on specific risk categories
- Monitor Emergency Drill Completion Rate to assess organizational preparedness relative to incident response performance
Benefits of a Stormwater Management Flood Emergency Response & Readiness Dashboard
The following are the benefits of using this dashboard:
- Centralizes stormwater management flood emergency dashboard data across zones into one structured view
- Reduces time-to-decision during active flood events by surfacing critical KPIs at a glance
- Enables proactive resource allocation based on zone-level pump readiness and incident severity data
- Supports post-incident review with trend data for early warning, lead time flood monitoring, and response performance
- Provides a consistent reporting framework for the flood damage cost avoidance reporting tool accountability
- Improves drill compliance tracking by connecting completion rates to operational readiness outcomes
- Facilitates cross-functional alignment between infrastructure, operations, and emergency management teams
- Scales across multiple geographic zones and catchment areas without structural changes to the template
KPIs to Track in a Stormwater Management Flood Emergency Response & Readiness Dashboard
The following key KPIs can be tracked by using this dashboard:
- Key Performance Indicators (KPIs) are quantifiable metrics used to evaluate operational effectiveness. In this dashboard, KPIs measure flood preparedness, response speed, and infrastructure readiness across all zones.
- Early Warning Lead Time (minutes): The average time between a flood warning trigger and the onset of the flood event; longer lead times allow for better preparation and support early warning lead time flood monitoring goals
- Estimated Damage Cost Avoided (USD): The monetary value of infrastructure damage prevented through timely early warnings and response actions, central to the flood damage cost avoidance reporting tool analysis
- Emergency Response Time (minutes): The average time elapsed from incident detection to the first active response action by emergency teams
- Mean Time to Contain Flood Incident (hours): The average duration required to fully contain and neutralize an active flood incident
- Active Flood Incidents (count): The current number of open, unresolved flood incidents being tracked across all geographic zones
- Emergency Drill Completion Rate: The percentage of scheduled emergency preparedness drills completed within the reporting period
Frequently Asked Questions
1. Who should use the Stormwater Management Flood Emergency Response & Readiness Dashboard?
This dashboard is designed for emergency operations managers, municipal water authorities, and infrastructure teams responsible for flood preparedness and active incident response. It is also valuable for risk and compliance officers who need flood emergency response readiness tracking data for reporting and accountability.
2. Can this dashboard be customized for different geographic zones or catchment areas?
Yes. The template includes filters for Geographic Zone and Catchment Area, allowing teams to scope the dashboard to specific regions. Using Mokkup's drag-and-drop editor, you can adjust zone configurations, add new KPI tiles, or modify chart structures to match your organization's geographic hierarchy.
3. How does this dashboard support early warning lead time flood monitoring?
The dashboard includes a dedicated Early Warning Lead Time Trend chart that plots average lead times over a rolling time period, enabling teams to track whether warning windows are expanding or contracting. Combined with the zone-level flood incident management table, it helps identify where early detection gaps are most acute and where stormwater management improvements are most needed.