
What is a Stormwater Management Executive System Performance Dashboard?
A Stormwater Management Executive System Performance Dashboard is a consolidated reporting view built for utility leaders and municipal stormwater teams who need a single lens on network performance, compliance, and capital delivery. As a stormwater management executive dashboard template, it brings together system availability, flooded property counts, regulatory compliance, operating budget utilization, critical infrastructure risk, and customer service SLA compliance into one screen, so executives are not chasing separate reports across departments. The dashboard supports filtering by service region, catchment, and asset type, along with a custom date range, which lets stormwater management teams narrow their view to a specific drainage basin or asset category without rebuilding the report. Functioning as a stormwater system performance monitoring tool, it translates operational and financial details into an executive-ready format, giving utilities a dependable way to monitor network health and respond to emerging risk before it becomes a compliance issue. For teams managing flood control assets across multiple jurisdictions, this stormwater compliance monitoring tool reduces manual reconciliation of SCADA, work order, and finance data, while also serving as a municipal stormwater infrastructure management dashboard that keeps every department aligned.
How to Create a Stormwater Management Executive System Performance Dashboard
You don't need to build your report from scratch, just start with a ready-to-use dashboard template from Mokkup. Add in your data and export it however you like. Here's how to do it:
1. Create or Log in to Your Mokkup Account
Start by signing up on Mokkup.ai using your email. If you already have an account, just log in, and you'll be good to go.
2. Choose and Customize Your Dashboard Template
Find the Stormwater Management Executive System Performance Dashboard template in the Templates section. Use the drag-and-drop editor to adjust KPIs, edit filters, or add elements based on your data.
3. Export to Your BI Tool
Once your dashboard wireframe is ready, use the BI Tool Export feature to send it directly to Power BI or Tableau for further analysis and enhancements. You can also download the dashboard as a PDF, PNG, or JPEG, embed it on a platform, or invite your team to collaborate.
Note: This is a Pro template. You'll need a Pro subscription on Mokkup to use and customize this dashboard wireframe. Upgrade anytime to unlock full access.
Stormwater Management Executive System Performance Dashboard Example
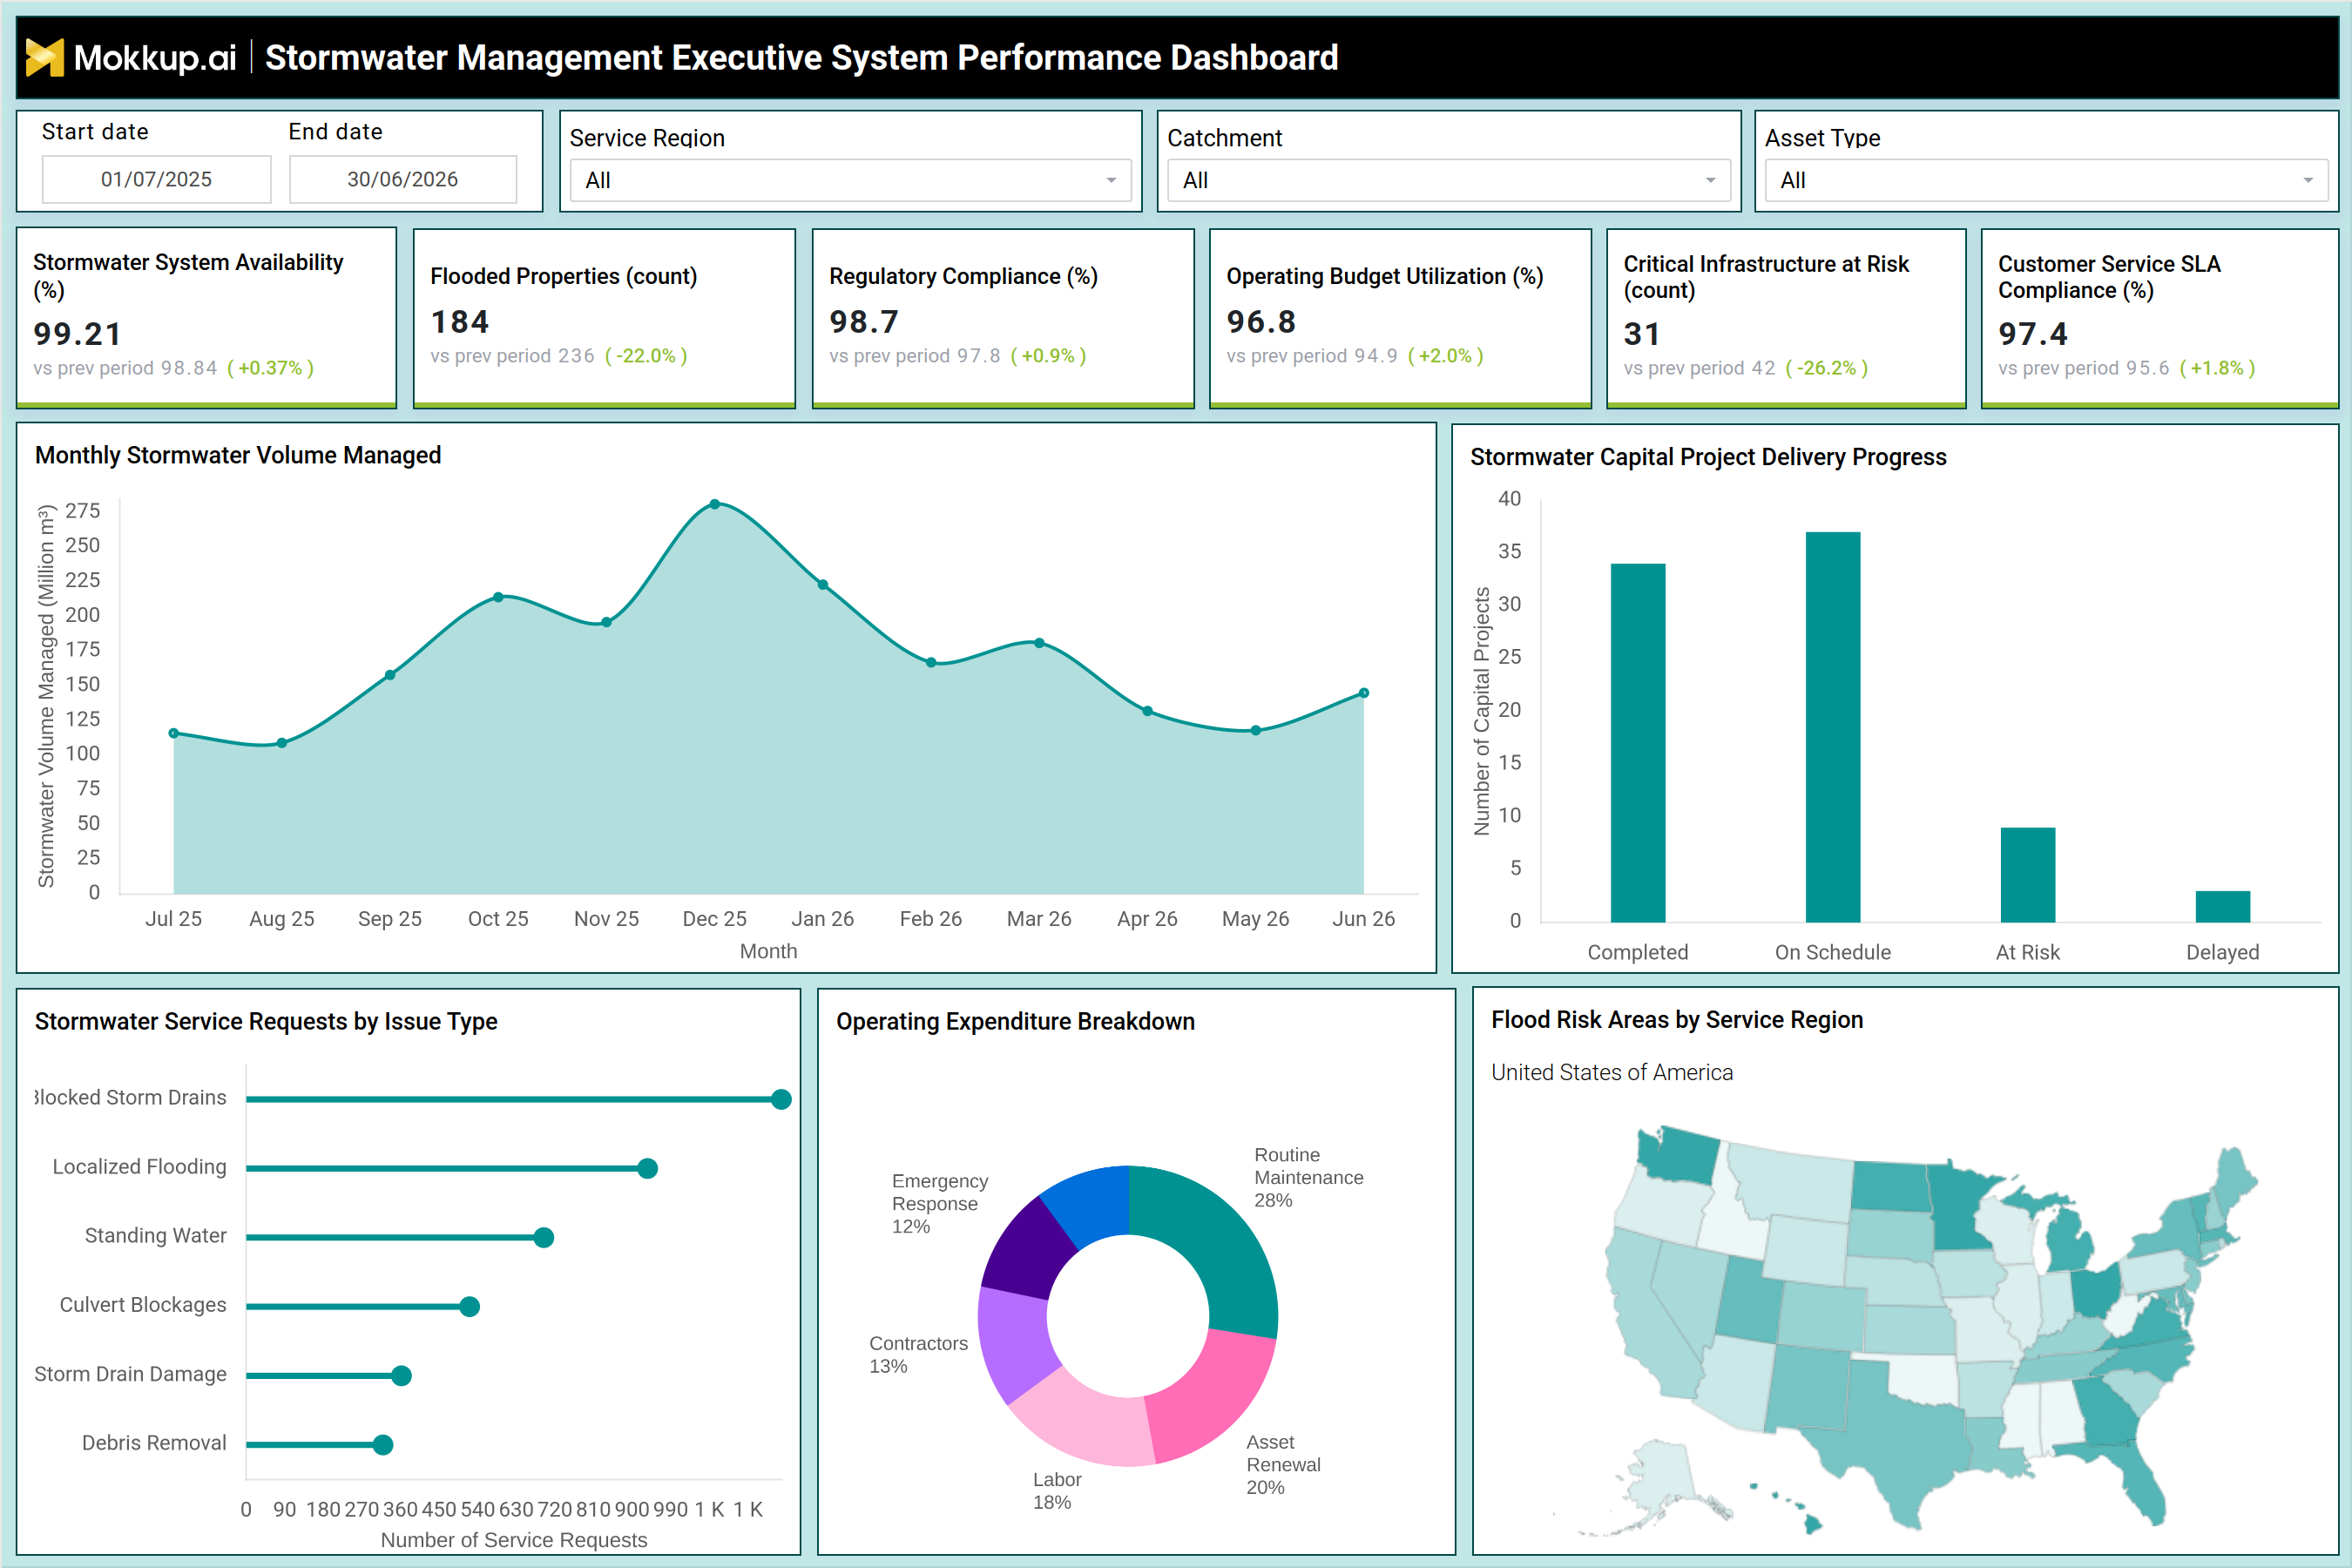
A stormwater utility director typically opens this dashboard ahead of a council briefing, looking to answer one question: is the network performing well enough to meet service and regulatory obligations this period? The filter bar lets the director narrow the view to a single service region, catchment, or asset type before presenting findings, so the story stays relevant to whichever audience is in the room. From the top KPI row, leadership can gauge overall system health, watch how flooded property counts trend against the prior period, and confirm regulatory compliance standing without opening a separate report. Once the headline numbers are reviewed, the director moves into the trend and delivery visuals, using the dashboard as a stormwater system performance monitoring tool for the full network. The monthly volume trend helps planners identify seasonal surges in stormwater flow so crews can be staffed ahead of high-volume months rather than reacting after drains back up. Alongside that, the view supporting stormwater capital project delivery tracking lets program managers compare how many projects are completed, on schedule, at risk, or delayed, helping them prioritize projects sliding off track before overruns compound.
The lower section supports a more operational conversation. Maintenance leads can review service requests by issue type to identify whether blocked drains, localized flooding, or culvert blockages consume a disproportionate share of crew time and adjust preventive schedules accordingly. Finance stakeholders can compare how operating expenditure is distributed across routine maintenance, asset renewal, labor, contractors, and emergency response to confirm spending aligns with risk priorities. Acting as a flood risk tracking dashboard for utilities, the regional map helps planners pinpoint which service areas carry the highest exposure, guiding where future capital investment should be targeted. Taken together, this municipal stormwater infrastructure management dashboard gives teams a shared source of truth. Instead of reconciling numbers from multiple systems before a meeting, they walk in with a synchronized view of network reliability, financial discipline, and regulatory standing and leave with clear direction on where to focus resources next.
How to Analyze Data in a Stormwater Management Executive System Performance Dashboard
Here is how you can analyze data from this dashboard:
- Review key performance metrics: Start with the KPI row to assess availability, compliance, and SLA performance against the previous period.
- Identify underperforming regions: Use the Service Region and Catchment filters to isolate drainage basins that need attention.
- Monitor seasonal trends: Review the Monthly Stormwater Volume Managed trend to identify periods of increased network load.
- Track project delivery: Use the Stormwater Capital Project Delivery chart to identify delayed or at-risk projects.
- Assess flood risk exposure: Compare Flooded Properties and Critical Infrastructure at Risk to understand the severity of flood impacts.
- Identify recurring issues: Analyze Stormwater Service Requests by Issue Type to uncover common maintenance problems.
- Evaluate maintenance spending: Review the Operating Expenditure Breakdown to ensure spending aligns with maintenance priorities.
- Prioritize capital investments: Use the flood risk tracking dashboard to guide capital planning across different geographic areas.
Benefits of a Stormwater Management Executive System Performance Dashboard
The following are the benefits of using this dashboard:
- Centralize operational data: Combine network performance, compliance, and spending metrics into a single executive dashboard.
- Reduce manual reporting: Replace scattered SCADA, finance, and work order exports with one centralized view.
- Track capital projects: Monitor stormwater capital project status to identify delays and delivery risks.
- Improve flood response: Gain visibility into affected regions and asset types to respond to flood risks faster.
- Strengthen compliance monitoring: Keep regulatory compliance metrics alongside operational performance data.
- Align budgets with operations: Help finance and operations teams match budget utilization with maintenance demand.
- Standardize infrastructure reporting: Use a municipal stormwater infrastructure dashboard to maintain consistent reporting across teams.
- Speed up executive reviews: Filter reports by region or asset type to quickly surface relevant insights for leadership.
KPIs to Track in a Stormwater Management Executive System Performance Dashboard
The following key KPIs can be tracked by using this dashboard:
- Stormwater System Availability (%) — the percentage of time the network is fully operational.
- Flooded Properties (count) — number of properties affected by flooding in the selected period.
- Regulatory Compliance (%) — adherence to stormwater discharge and environmental standards.
- Operating Budget Utilization (%) — share of the allocated operating budget used against plan.
- Critical Infrastructure at Risk (count) — assets classified as high-risk needing priority attention.
- Customer Service SLA Compliance (%) — consistency of resolving service requests within agreed timeframes.
Frequently Asked Questions
1. What is the Stormwater Management Executive System Performance Dashboard used for?
As a stormwater management executive dashboard template, it gives utility leaders a consolidated view of system availability, compliance, flood risk, and capital project delivery. Teams use it to monitor network performance and guide budget and maintenance decisions.
2. Who should use this stormwater compliance monitoring tool?
Utility executives, operations managers, and finance teams overseeing stormwater infrastructure benefit most. It supports both strategic reviews and day-to-day maintenance planning.
3. Can I customize this stormwater infrastructure dashboard for my region?
Yes. The Mokkup template includes filters for service region, catchment, and asset type, so you can tailor the view to your own network before exporting it to Power BI or Tableau.