
What is an LNG Capital Projects Portfolio Performance Dashboard?
An LNG capital projects portfolio performance dashboard analytics solution is a centralized reporting tool used by LNG operators to monitor the performance of multiple capital projects across the portfolio. It tracks key metrics such as project progress, cost variance, schedule delays, and risk exposure. This type of LNG project portfolio performance monitoring dashboard enables engineering, procurement, and construction (EPC) teams to manage large-scale LNG infrastructure investments efficiently. The dashboard consolidates data from project management systems, financial systems, and operational tools to provide a unified view of portfolio health. It supports decision-making by highlighting underperforming projects, identifying cost overruns, and tracking execution progress across phases such as engineering, procurement, construction, and commissioning. A well-designed LNG capital expenditure project tracking dashboard ensures better control over CAPEX and improves project delivery outcomes.
How to Create a LNG Capital Projects Portfolio Performance Dashboard
You don't need to build your report from scratch, just start with a ready-to-use dashboard template from Mokkup. Add in your data and export it however you like. Here's how to do it:
1. Create or Log in to Your Mokkup Account
Start by signing up on Mokkup.ai using your email. If you already have an account, just log in, and you'll be good to go.
2. Choose and Customize Your Dashboard Template
Find the LNG Capital Projects Portfolio Performance Dashboard template in the Templates section. Use the drag-and-drop editor to adjust KPIs, edit filters, or add elements based on your data.
3. Export to Your BI Tool
Once your dashboard wireframe is ready, use the BI Tool Export feature to send it directly to Power BI or Tableau for further analysis and enhancements. You can also download the dashboard as a PDF, PNG, or JPEG, embed it on a platform, or invite your team to collaborate.
Note: This is a Pro template. You'll need a Pro subscription on Mokkup to use and customize this dashboard wireframe. Upgrade anytime to unlock full access.
LNG Capital Projects Portfolio Performance Dashboard Example
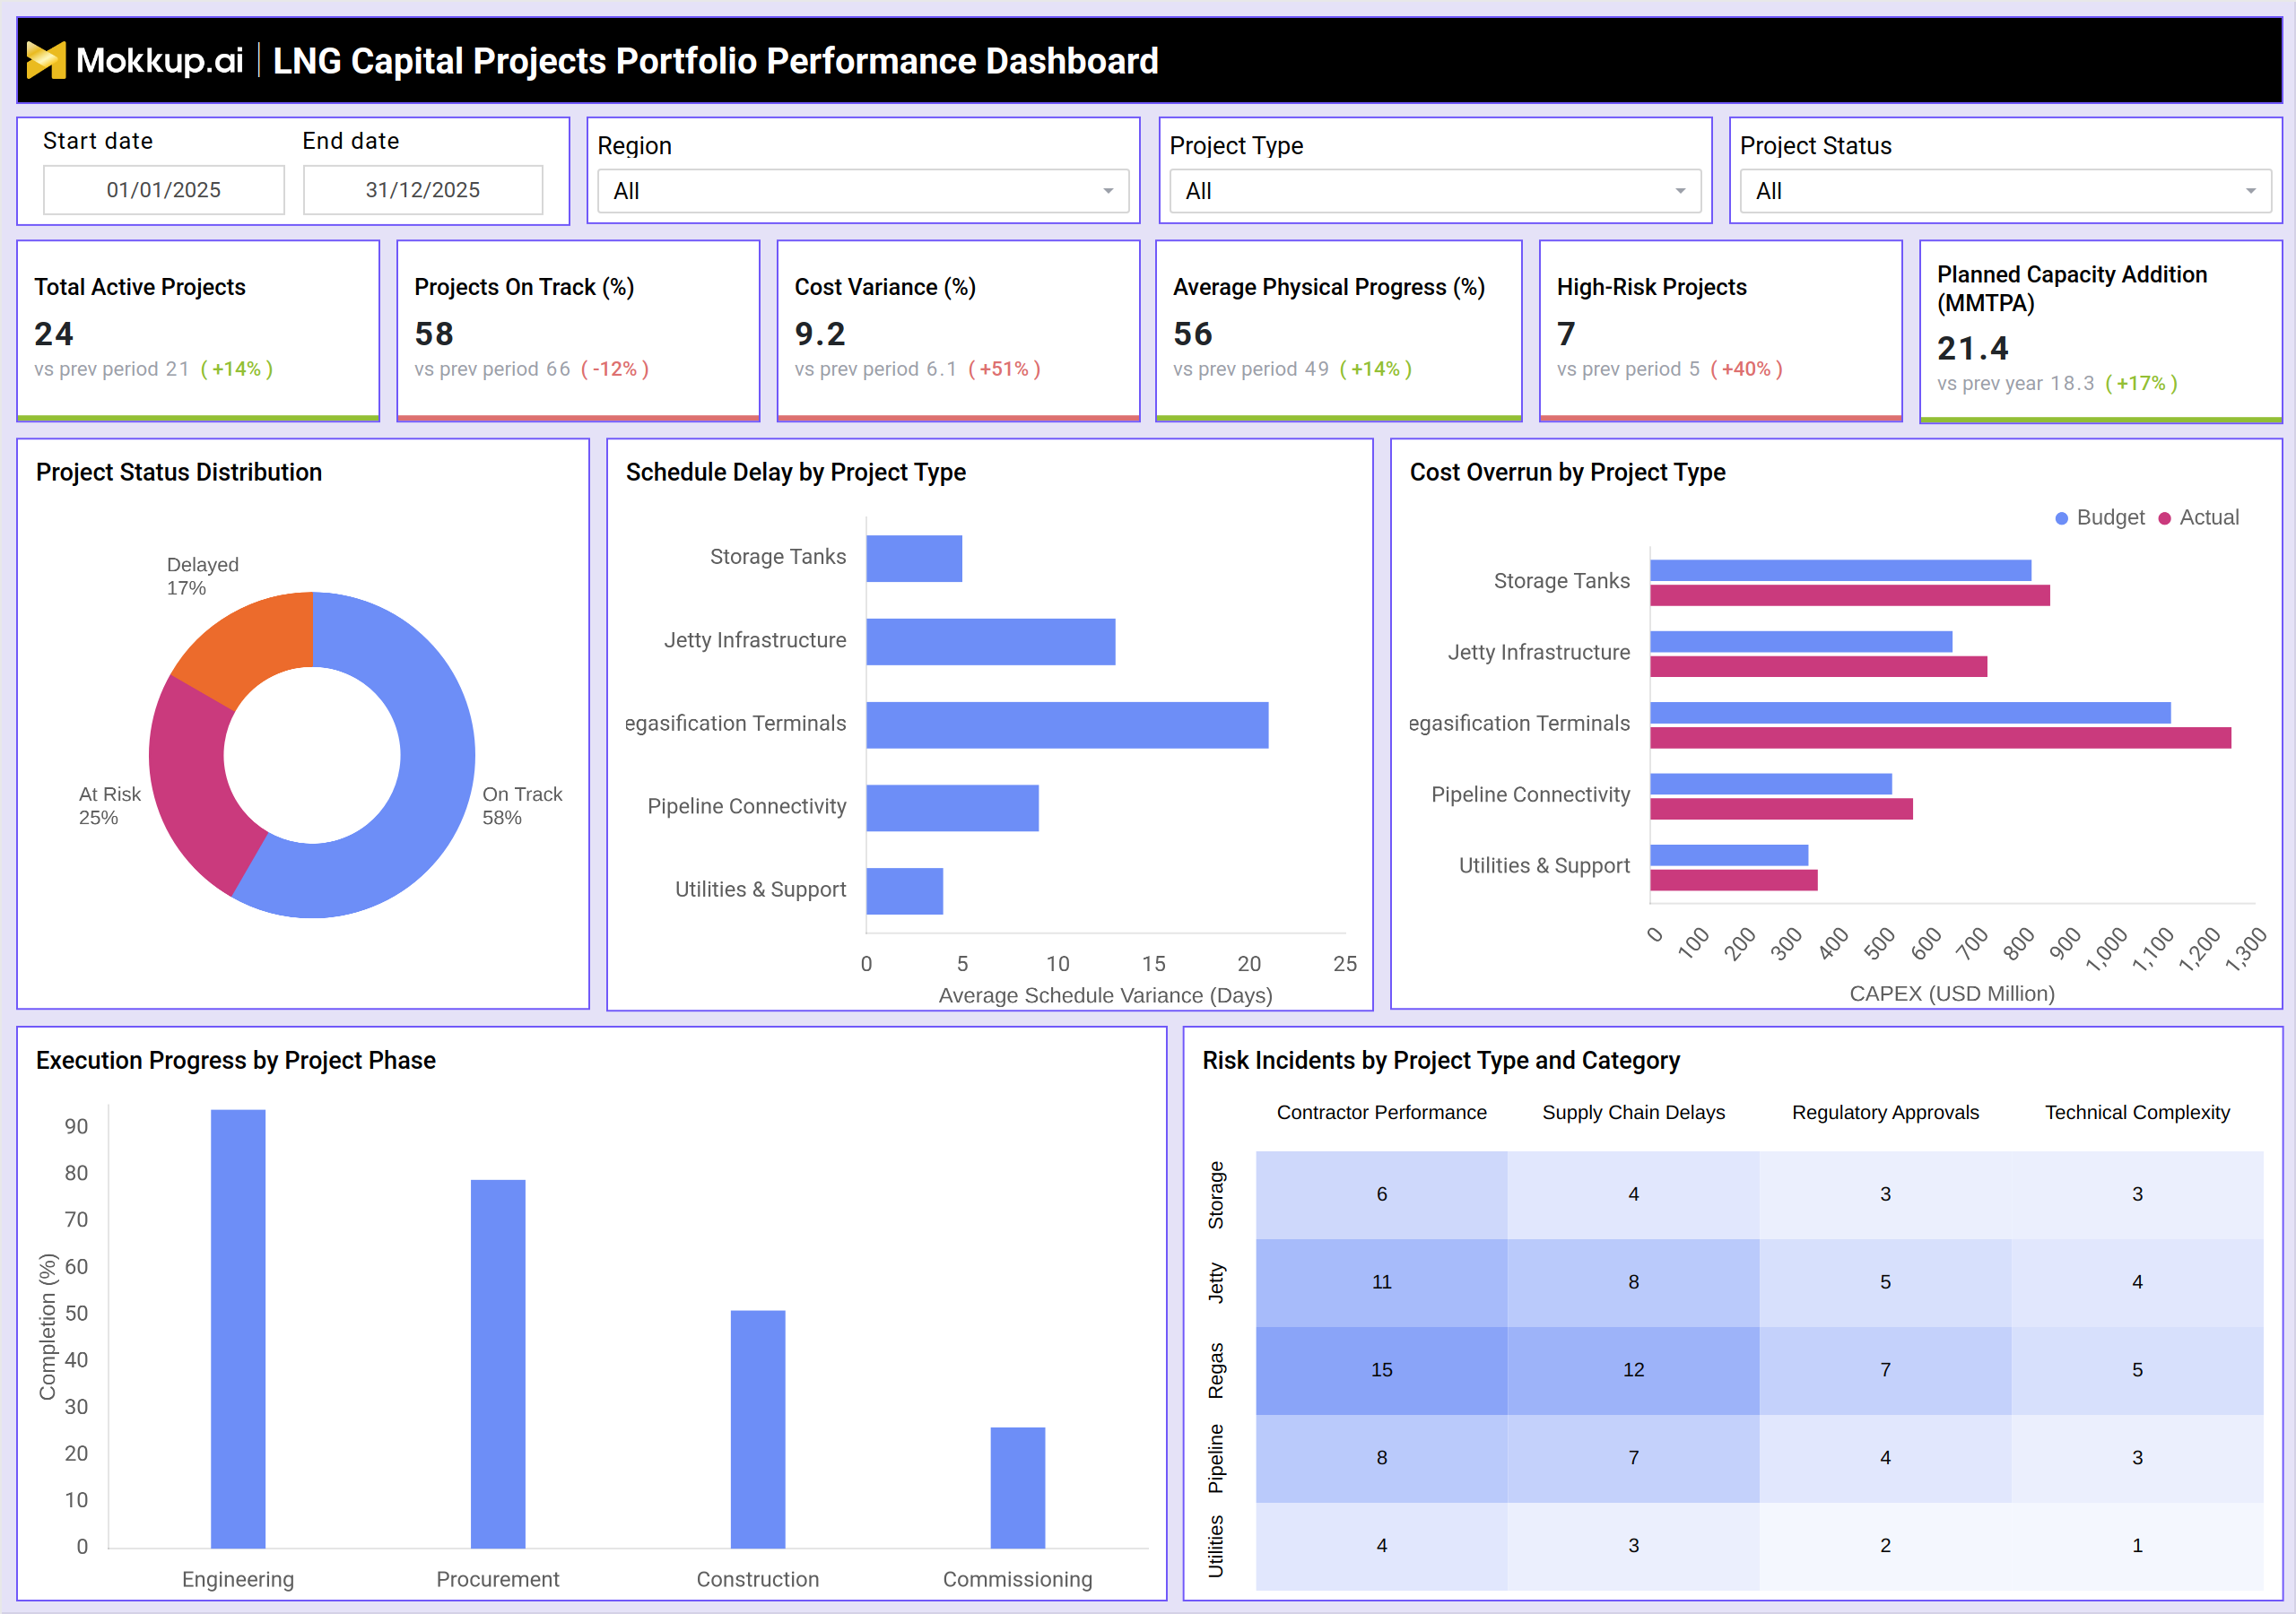
A typical LNG infrastructure project performance analytics dashboard includes a mix of KPIs and visuals that provide a complete overview of project portfolio performance. For example, the dashboard may show total active projects, percentage of projects on track, cost variance, and average physical progress. These KPIs give a quick snapshot of overall execution health. Visual elements such as project status distribution help identify how many projects are on track, at risk, or delayed.
Schedule delay analysis by project type highlights bottlenecks in areas like regasification terminals or pipeline connectivity. Cost overrun comparisons between budget and actual values provide insight into financial performance. Execution progress charts track completion across phases, while risk heatmaps identify common issues such as contractor delays or regulatory approvals. This LNG project portfolio KPI monitoring dashboard enables stakeholders to quickly detect performance gaps and take corrective actions, ensuring that LNG projects stay aligned with timelines and budgets.
How to Analyze Data in LNG Capital Projects Portfolio Performance Dashboard
Here is how you can analyze data from this dashboard:
- Start with portfolio-level KPIs such as total active projects and projects on track to assess overall performance
- Compare cost variance (%) against budget to identify financial deviations across projects
- Analyze schedule delays by project type to detect systemic bottlenecks in specific asset categories
- Review cost overrun by project type to understand where CAPEX inefficiencies are occurring
- Track execution progress by project phase to identify delays in engineering, procurement, or construction
- Evaluate high-risk projects count to prioritize risk mitigation actions
- Use risk incident heatmaps to identify recurring issues such as contractor performance or supply chain delays
- Monitor planned capacity addition (MMTPA) to ensure alignment with strategic LNG expansion goals
- Compare trend vs previous period metrics to measure performance improvement or deterioration
- Drill down by region, project type, or status filters for detailed root cause analysis
Benefits of LNG Capital Projects Portfolio Performance Dashboard
The following are the benefits of using this dashboard:
- Provides a centralized view of LNG project portfolio performance
- Improves CAPEX control and financial visibility across projects
- Enables early detection of schedule delays and cost overruns
- Supports data-driven decision-making for project prioritization
- Enhances risk management and mitigation planning
- Improves coordination across engineering, procurement, and construction teams
- Tracks capacity expansion progress aligned with business goals
- Reduces project execution inefficiencies and delays
- Helps maintain regulatory and compliance alignment
- Strengthens overall project governance and accountability
KPIs to Track in LNG Capital Projects Portfolio Performance Dashboard
The following key KPIs can be tracked by using this dashboard:
- Total Active Projects – Tracks the total number of ongoing LNG capital projects in the portfolio
- Projects On Track (%) – Measures the percentage of projects progressing as per planned schedule and budget
- Cost Variance (%) – Indicates deviation between actual project costs and planned budget
- Average Physical Progress (%) – Represents overall execution progress across all active projects
- High-Risk Projects (Count) – Tracks the number of projects with significant risk exposure
- Planned Capacity Addition (MMTPA) – Measures expected LNG capacity increase from ongoing projects
- Project Status Distribution (%) – Shows proportion of projects that are on track, at risk, or delayed
- Schedule Delay (Days) by Project Type – Tracks average delay across different project categories
- Cost Overrun (Budget vs Actual) – Compares planned vs actual CAPEX across project types
- Execution Progress by Project Phase (%) – Measures completion across engineering, procurement, construction, and commissioning stages
- Risk Incidents by Category (Count) – Tracks key risks such as contractor issues, supply chain delays, regulatory approvals, and technical challenges
Frequently Asked Questions
1. Why is a LNG capital projects portfolio performance dashboard important?
It provides visibility into project execution, helping teams manage cost, schedule, and risks effectively across multiple LNG projects.
2. Who uses this dashboard?
Project managers, EPC teams, finance teams, and LNG operations leaders use this dashboard to monitor and control project performance.
3. How does the dashboard help reduce cost overruns?
By tracking cost variance and comparing budget vs actual spend, it helps identify deviations early and take corrective action.
4. What KPIs does the LNG capital projects portfolio performance dashboard track?
It tracks total active projects, projects on track (%), cost variance (%), average physical progress (%), high-risk projects count, planned capacity addition (MMTPA), project status distribution, and schedule delay by project type.
5. Can this dashboard be used for multi-project LNG portfolio management?
Yes, the dashboard is specifically designed to consolidate data from multiple LNG capital projects, providing a unified portfolio view of execution health, cost performance, and risk exposure.