
What is a Stormwater Management Drain & Culvert Health Dashboard?
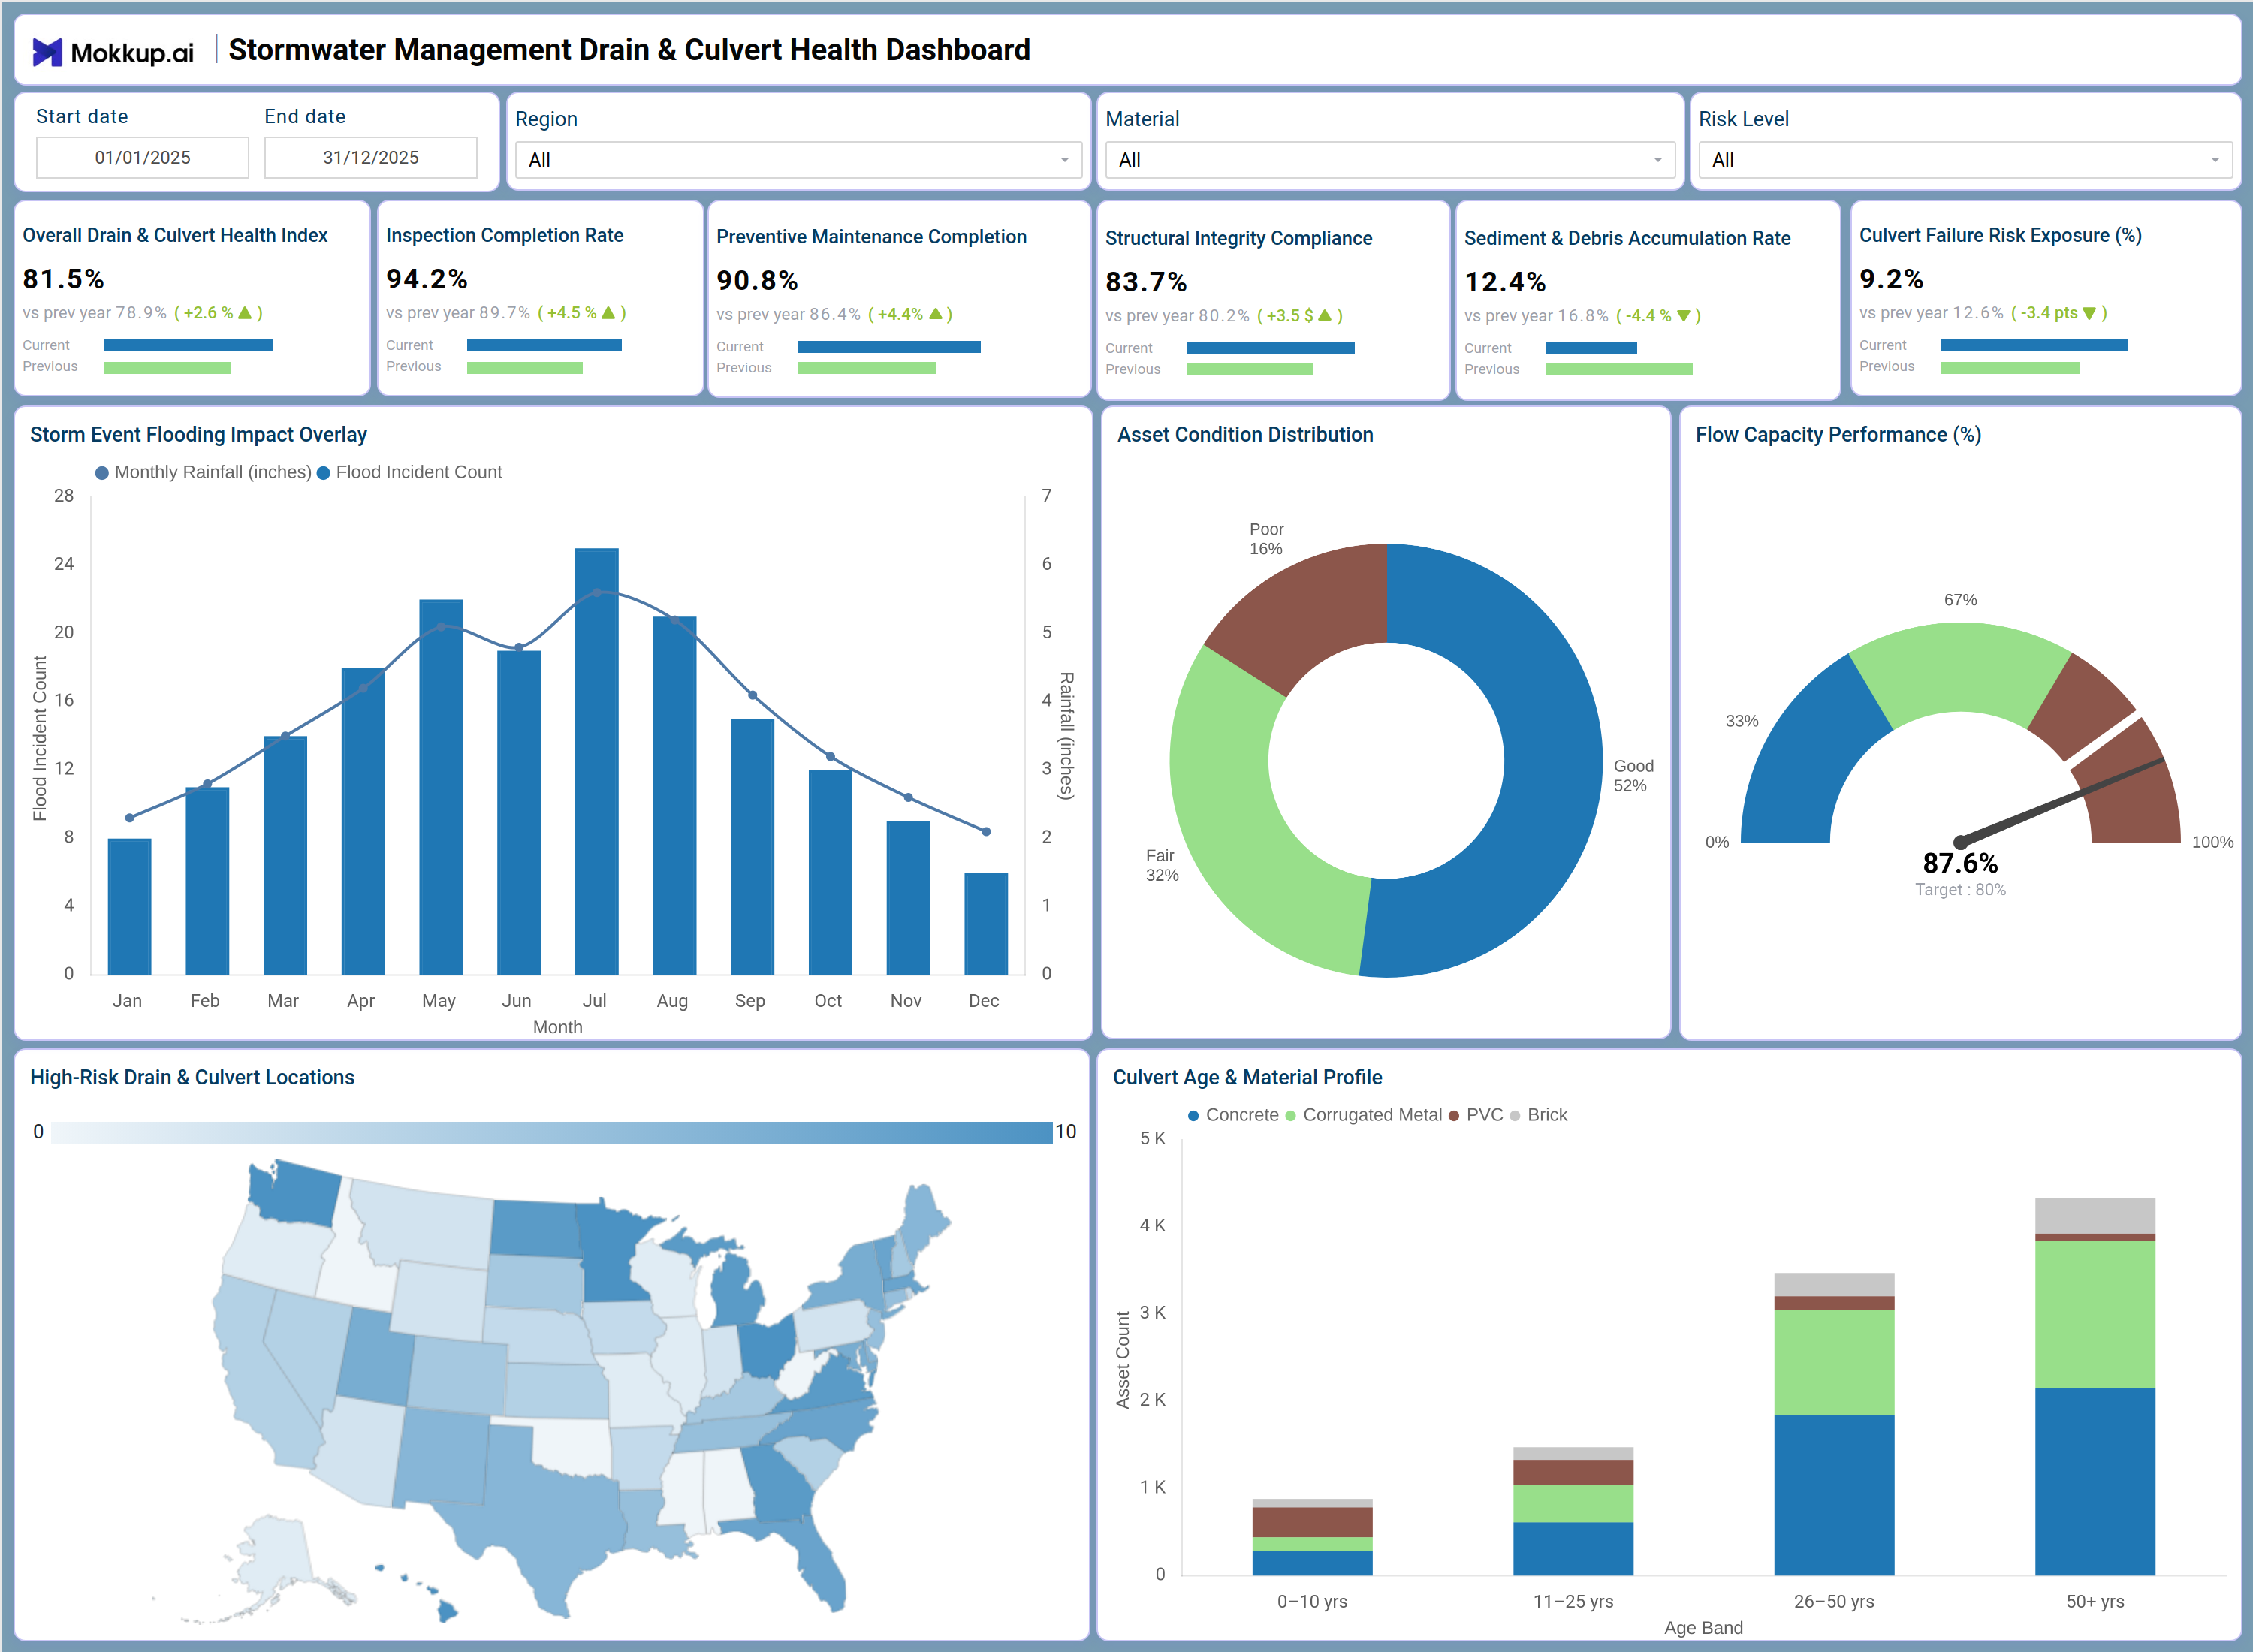
The Stormwater Management Drain & Culvert Health Dashboard is a structured monitoring tool designed for municipal engineers, public works departments, and drainage asset managers who need a centralized view of their stormwater infrastructure. This stormwater drain culvert health monitoring dashboard tracks the condition, maintenance status, and inspection outcomes of drains, culverts, and related assets across a network. It consolidates KPIs such as Total Assets Inspected, Culverts at Risk, Blocked Drain Incidents, and Maintenance Completion Rate into a single interface, enabling teams to prioritize field interventions based on condition severity. By providing a comprehensive view of stormwater asset condition reporting, it helps decision-makers address deteriorating infrastructure before it leads to flooding or service disruption.
How to Create a Stormwater Management Drain & Culvert Health Dashboard
You don't need to build your dashboard from scratch, just start with a ready-to-use Dashboard template from Mokkup. Customize it with your data and export it with ease. Here's how:
1. Create or Log in to Your Mokkup Account
Start by signing up on Mokkup.ai using your email. If you already have an account, just log in, and you'll be good to go.
2. Choose and Customize Your Dashboard Template
Find the Stormwater Management Drain & Culvert Health Dashboard template in the Templates section. Use the drag-and-drop editor to adjust KPIs, edit filters, or add elements based on your data.
3. Export to Your BI Tool
Once your dashboard wireframe is ready, use the BI Tool Export feature to send it directly to Power BI or Tableau for further analysis and enhancements. You can also download the dashboard as a PDF, PNG, or JPEG, embed it on a platform, or invite your team to collaborate.
Note: This is a Pro template. You'll need a Pro subscription on Mokkup to use and customize this dashboard wireframe. Upgrade anytime to unlock full access.
Stormwater Management Drain & Culvert Health Dashboard Example
A stormwater asset manager at a regional public works department opens this dashboard at the start of the week to review the condition of drains and culverts across multiple drainage zones. They want to know which assets have deteriorated since the last inspection cycle and where maintenance teams should be dispatched first. The stormwater drain culvert health monitoring view immediately surfaces the most critical assets, giving the manager a clear picture before any field crews are mobilized. The dashboard enables the manager to compare culvert condition scores across districts, identify locations where blocked drain flood risk analysis signals an elevated risk of overflow, and track whether scheduled maintenance jobs are being completed on time.
Using the District and Asset Type filters, they can narrow their focus to the highest-priority zones and assess whether inspection coverage is keeping pace with the overall network size. The stormwater infrastructure management dashboard view also shows trends in incident frequency, helping the team understand whether recent interventions are producing measurable improvements. By the end of the review session, the manager has a prioritized work order for the week – flagged culverts, overdue inspections, and drainage assets requiring urgent attention. The team's stormwater asset condition reporting is shareable with stakeholders, enabling transparent communication about infrastructure health without manual report compilation.
How to Analyze Data in a Stormwater Management Drain & Culvert Health Dashboard
Here is how you can analyze data from this dashboard:
- Use the District filter to isolate asset condition data for a specific drainage zone and focus maintenance resources accordingly.
- Monitor the Culverts at Risk KPI tile to track how many assets fall below acceptable condition thresholds at any point in the cycle.
- Review the Asset Condition Score Trend chart to assess deterioration patterns and support stormwater infrastructure management dashboard planning.
- Use the Inspection Status breakdown chart to identify which culverts are overdue for assessment and flag them for scheduling.
- Compare the Condition by Asset Type chart to find which drain or culvert categories carry the highest proportion of poor-condition assets.
- Analyze the Blocked Drain Incidents chart to identify which drainage zones generate the most recurring obstruction events.
- Filter by Asset Age Band to align maintenance priorities with older infrastructure that carries higher structural risk.
- Track the Maintenance Completion Rate KPI over reporting periods to measure progress toward culvert maintenance scheduling tracking goals.
Benefits of a Stormwater Management Drain & Culvert Health Dashboard
The following are the benefits of using this dashboard:
- Centralizes culvert condition scores, inspection outcomes, and maintenance status across the full drainage network in one structured template.
- Supports stormwater infrastructure management dashboard monitoring across multiple districts and asset types simultaneously.
- Reduces manual data compilation for public works reporting with pre-built KPI tiles and condition trend chart layouts.
- Enables zone-level drain blockage flood risk analysis to guide infrastructure repair and replacement decisions.
- Provides a breakdown of asset condition by category for operational maintenance planning and resource allocation.
- Helps drainage engineers align inspection cycles with condition-based maintenance standards without rebuilding reports from scratch.
- Gives field teams and planning managers a shared view of stormwater network health and outstanding maintenance actions.
KPIs to Track in a Stormwater Management Drain & Culvert Health Dashboard
KPIs, or Key Performance Indicators, are the measurable values that show how effectively your stormwater infrastructure is being managed and maintained. The following KPIs are tracked in this dashboard:
- Total Assets Inspected (count): Stormwater drain culvert health monitoring starts with tracking how many drains and culverts have been assessed within the current inspection cycle, ensuring full network coverage.
- Culverts at Risk (count): Tracks the number of culverts whose condition scores fall below the acceptable threshold, a direct indicator of flood risk exposure across the network.
- Blocked Drain Incidents (count): Quantifies recurring obstruction events by location, supporting stormwater infrastructure management dashboard analysis to pinpoint chronic problem sites.
- Maintenance Completion Rate (%): Measures the proportion of scheduled maintenance jobs completed on time, key to culvert maintenance scheduling, tracking, and resource planning.
- Average Condition Score: Evaluates the overall structural and hydraulic health of the drain and culvert network against established inspection standards, supporting infrastructure investment decisions.
- Inspection Coverage Rate (%): Tracks the percentage of total network assets inspected within the target period across all districts and asset age bands.
Frequently Asked Questions
1. What types of organizations benefit most from this Stormwater Management Drain & Culvert Health Dashboard?
Municipal public works departments, regional drainage authorities, and infrastructure asset management teams benefit most from this dashboard. It is especially useful for organizations managing large networks of culverts, stormdrains, and open channels across multiple districts.
2. Can this dashboard track culvert inspection schedules and overdue assessments?
Yes, the dashboard includes an Inspection Status breakdown that identifies which assets are overdue for assessment and which have been recently inspected. This helps managers maintain consistent inspection cycles and avoid gaps in coverage.
3. How does the dashboard support stormwater asset condition reporting for stakeholder communication?
The dashboard consolidates condition scores, risk flags, and maintenance completion data into a single exportable view, making stormwater asset condition reporting straightforward for both technical teams and non-technical stakeholders. It removes the need for manual report compilation before meetings or regulatory submissions.