
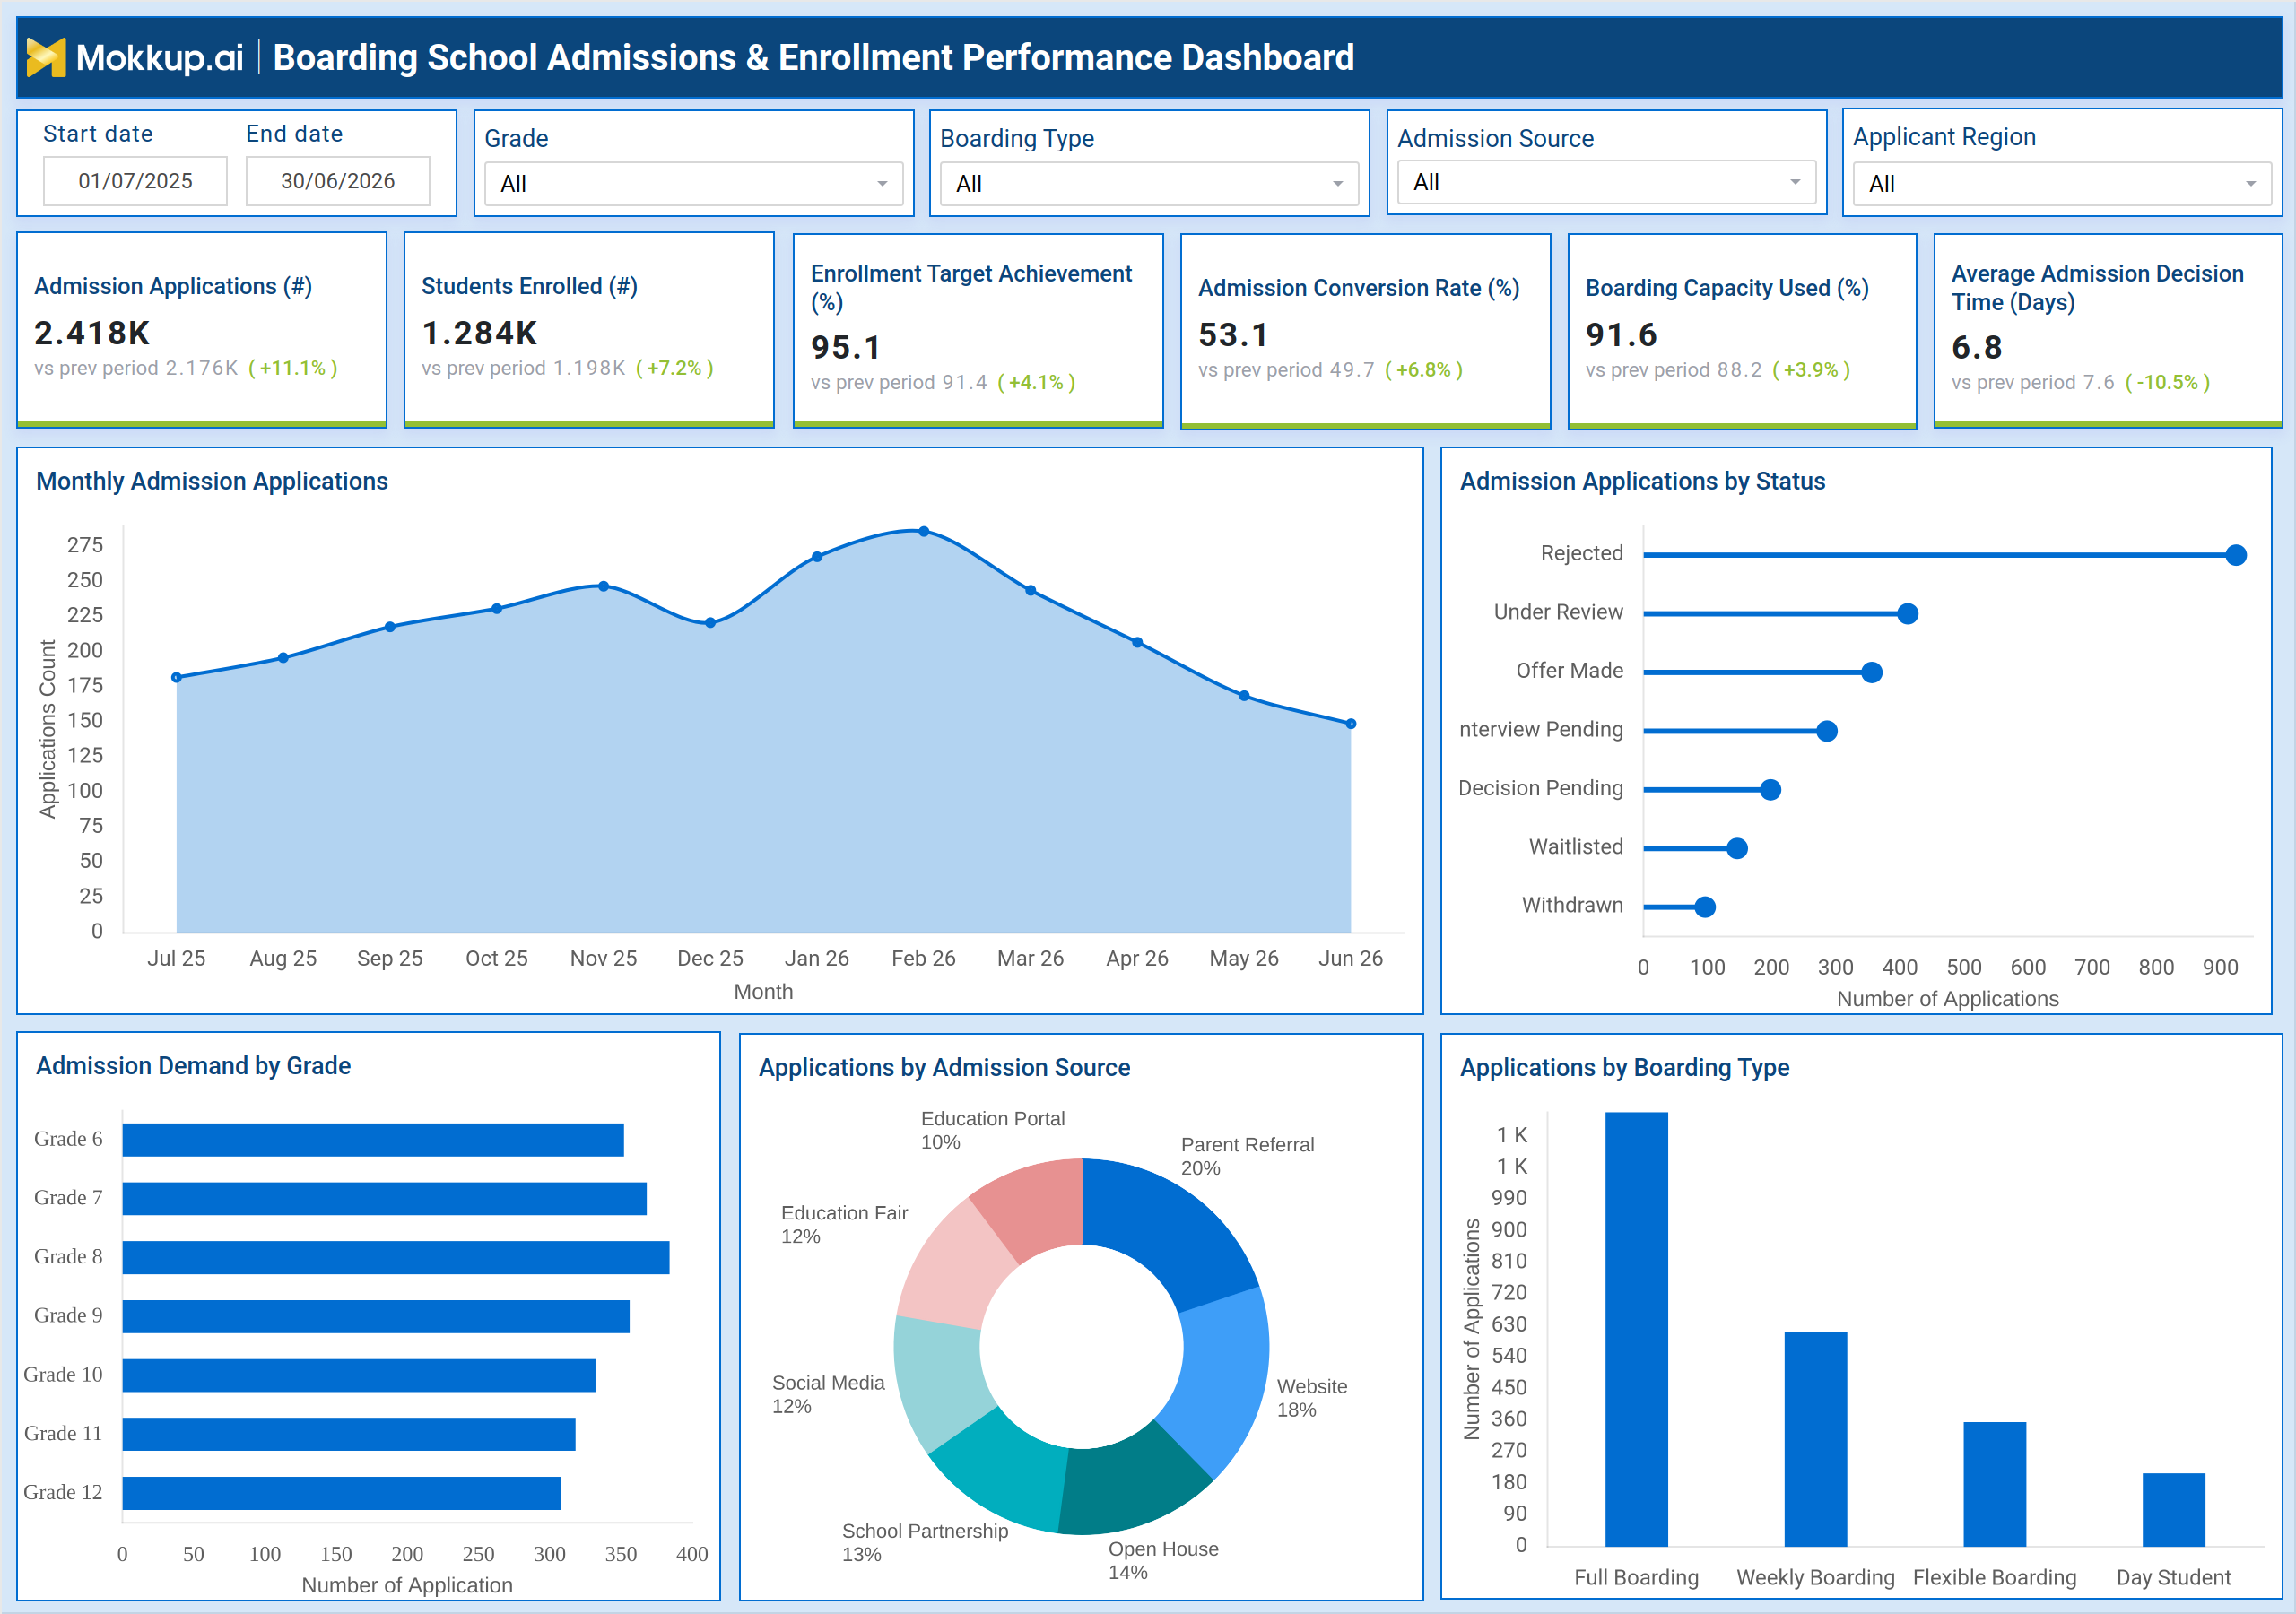
What is a Boarding School Admissions & Enrollment Performance Dashboard
The Boarding School Admissions & Enrollment Performance Dashboard is a boarding school admissions dashboard template built for admissions teams, enrollment managers, and school leadership who need a single view of how applications move from inquiry to enrollment. It consolidates admission volume, enrollment outcomes, and boarding capacity into one workspace, giving schools a structured way to approach student enrollment performance tracking across an entire admissions cycle. Filters for grade, boarding type, admission source, and applicant region let teams narrow the view to a specific class, campus segment, or recruitment channel without losing sight of the overall picture. Because every metric ties back to the same date range, comparisons across grades, sources, and boarding preferences stay consistent and easy to interpret.
How to Create a Boarding School Admissions & Enrollment Performance Dashboard
You don't need to build your report from scratch; just start with a ready-to-use dashboard template from Mokkup. Add in your data and export it however you like. Here's how to do it:
1. Create or Log in to Your Mokkup Account
Start by signing up on Mokkup.ai using your email. If you already have an account, just log in, and you'll be good to go.
2. Choose and Customize Your Dashboard Template
Find the Boarding School Admissions & Enrollment Performance Dashboard template in the Templates section. Use the drag-and-drop editor to adjust KPIs, edit filters, or add elements based on your data.
3. Export to Your BI Tool
Once your dashboard wireframe is ready, use the BI Tool Export feature to send it directly to Power BI or Tableau for further analysis and enhancements. You can also download the dashboard as a PDF, PNG, or JPEG, embed it on a platform, or invite your team to collaborate.
Note: This is a Pro template. You'll need a Pro subscription on Mokkup to use and customize this dashboard wireframe. Upgrade anytime to unlock full access.
Boarding School Admissions & Enrollment Performance Dashboard Example
An admissions director opens this dashboard at the start of each recruitment cycle to understand how this year's applicant pool compares to the previous period and whether the school is on pace to hit its enrollment targets. Before making decisions about outreach budget or interview staffing, the team needs to know where applications are concentrated by grade and how boarding preferences are shifting from one cycle to the next. From the overview, admissions staff can compare application volume against enrolled students to see how efficiently the funnel is converting and can walk through a boarding school application funnel analysis to spot where candidates stall between review, interview, and offer stages.
When rejections or withdrawals cluster around a particular status, the team can drill into that segment to understand whether it reflects academic fit, capacity limits, or delays in decision-making. Enrollment planners can also compare demand across grade levels to decide which cohorts need an additional recruitment push and can weigh boarding type preferences against available capacity before finalizing offers. Ultimately, the dashboard helps admissions and enrollment teams move from reactive tracking to informed planning, giving them the visibility needed to balance applicant demand, boarding capacity, and enrollment goals throughout the academic year.
How to Analyze Data in a Boarding School Admissions & Enrollment Performance Dashboard
Here is how you can analyze data from this dashboard:
- Compare Admission Applications against Students Enrolled to gauge overall funnel efficiency.
- Track Monthly Admission Applications trend to spot seasonal spikes in inquiry volume.
- Review Admission Applications by Status to identify where candidates stall in the pipeline, supporting boarding school application funnel analysis throughout the cycle.
- Use Admission Demand by Grade to prioritize recruitment effort by class level.
- Filter Applications by Admission Source to run a school admission source performance tracking review by channel.
- Compare Applications by Boarding Type against Boarding Capacity Used to support boarding capacity utilization monitoring before offers go out.
- Apply the Applicant Region filter to compare demand and conversion across geographies.
- Monitor Average Admission Decision Time to keep the process within an acceptable window.
Benefits of a Boarding School Admissions & Enrollment Performance Dashboard
The following are the benefits of using this dashboard:
- Reduces Data Consolidation: Cuts the time spent combining admissions data from multiple spreadsheets and forms.
- Tracks Enrollment Targets: Gives leadership a shared view of progress toward enrollment targets throughout the school year.
- Identifies Admission Bottlenecks: Highlights where applicants are getting stuck in the admission funnel before they impact enrollment numbers.
- Monitors Admission Conversion: Tracks conversion rates across different grades and boarding types.
- Optimizes Recruitment Spending: Identifies high-performing admission sources to help allocate recruitment budgets more effectively.
- Aligns Boarding Capacity with Demand: Compares boarding capacity with actual applicant demand to support better planning.
- Speeds Up Admission Decisions: Monitors average decision time to identify delays and improve the admissions process.
KPIs to Track in a Boarding School Admissions & Enrollment Performance Dashboard
The following key KPIs can be tracked by using this dashboard:
- Admission Applications (#): total number of applications received in the selected period.
- Students Enrolled (#): total number of applicants who complete enrollment.
- Enrollment Target Achievement (%): enrolled students measured against the enrollment goal.
- Admission Conversion Rate (%): a core metric for school admission conversion rate tracking, showing the share of applications that convert into enrollments.
- Boarding Capacity Used (%): supports boarding capacity utilization monitoring by showing the proportion of available boarding capacity occupied by enrolled students.
- Average Admission Decision Time (Days): average time taken to reach a decision on an application.
- Admission Pipeline Status Distribution: breakdown of applications across review, interview, offer, and decision stages.
- Admission Demand by Grade: volume of applications received per grade level.
- Admissions by Source Channel: supports school admission source performance tracking by showing application volume contributed by each recruitment channel.
- Applications by Boarding Type Preference: distribution of applications across full, weekly, flexible, and day-student boarding options.
Frequently Asked Questions
1. What is the Boarding School Admissions & Enrollment Performance Dashboard used for?
It is a boarding school admissions dashboard template used to track applications, conversions, and boarding capacity in one place. Admissions teams use it for student enrollment performance tracking across grades, boarding types, and recruitment sources throughout the academic year.
2. How does the dashboard help identify bottlenecks in the admissions process?
It breaks down applications by status, so admissions teams can see where candidates get stuck between review, interview, and offer stages. This makes it easier to fix delays before they affect enrollment numbers.
3. Can the dashboard be used to evaluate recruitment channels?
Yes. The Applications by Admission Source view enables school admission source performance tracking, showing how each channel, from parent referrals to education fairs, contributes to overall applications.