
What is a Primary Schools Student Admissions & Enrollment Dashboard?
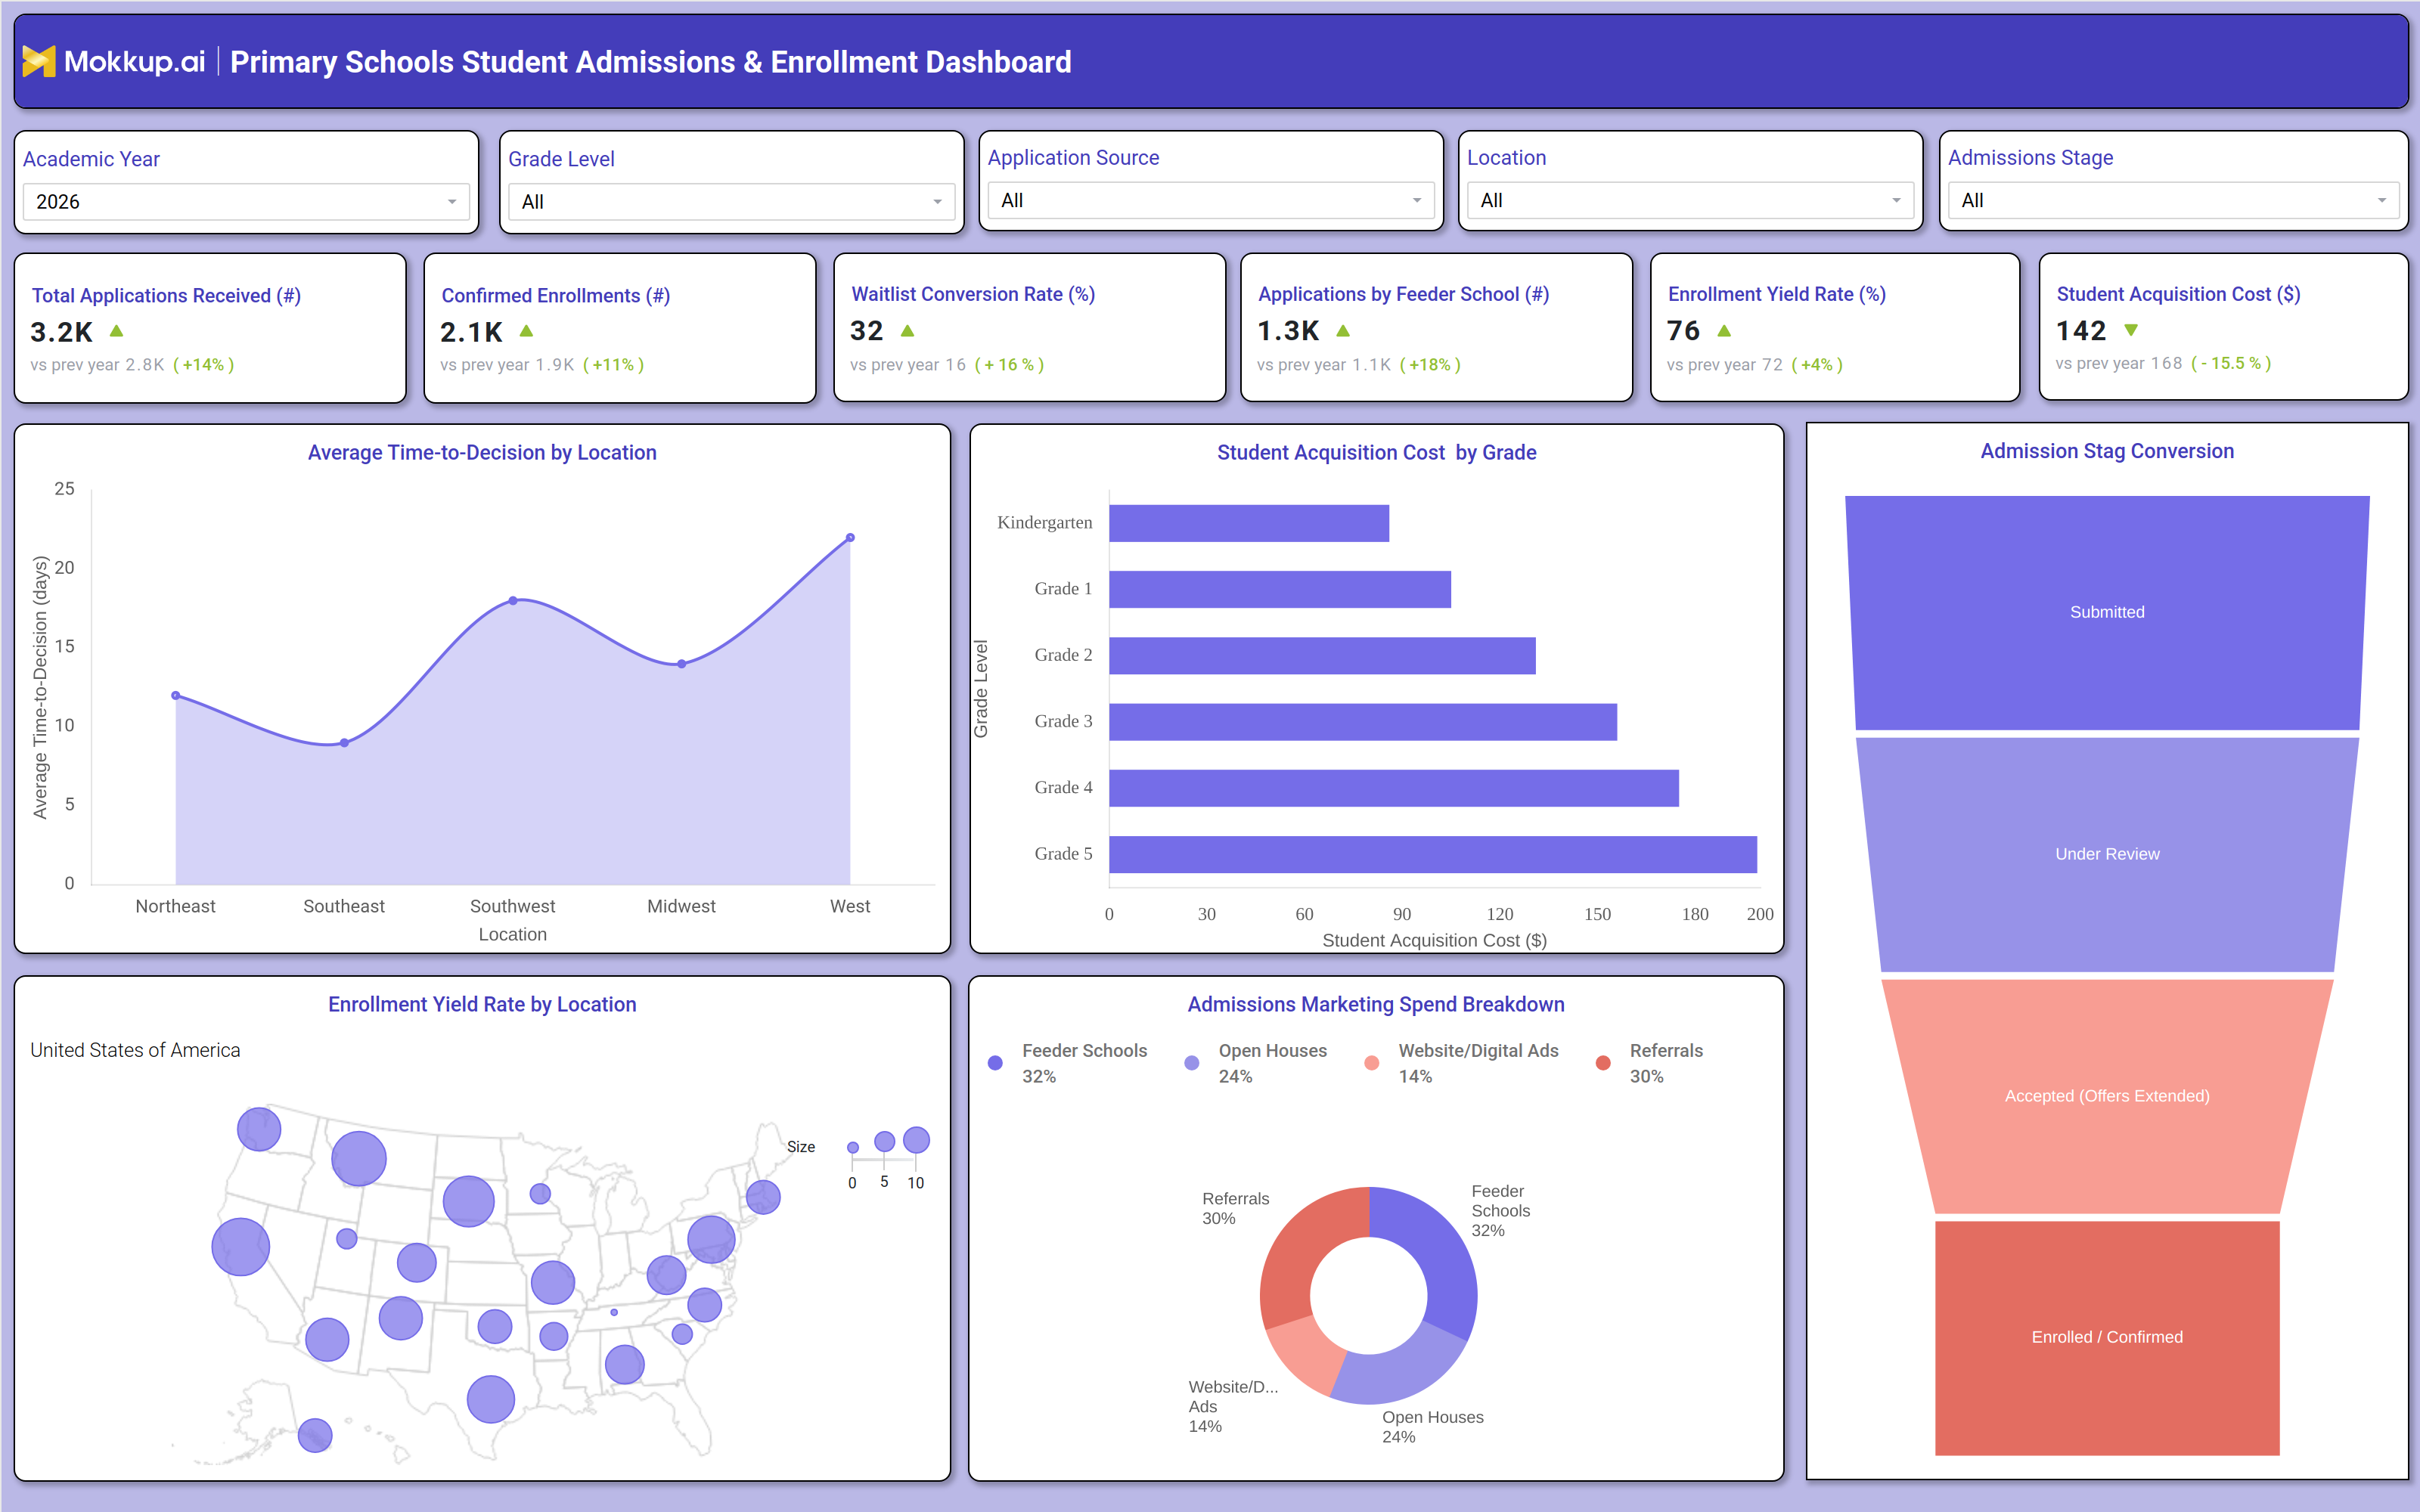
The Primary Schools Student Admissions & Enrollment Dashboard gives admissions offices a single view of how prospective families move from initial application through confirmed enrollment. Instead of piecing together spreadsheets from different feeder schools, marketing channels, and grade levels, admissions teams get one primary school student admissions and enrollment dashboard that consolidates application volume, conversion behavior, and acquisition spend by academic year, grade level, application source, and location. The layout is built for schools that need to compare cohorts across regions, track how long families wait before a decision is issued, and understand which channels are actually converting into confirmed seats. Because everything is filtered by admissions stage, teams can also isolate where in the funnel families are dropping off before enrollment closes.
How to Create a Primary Schools Student Admissions & Enrollment Dashboard
You don’t need to build your report from scratch; just start with a ready-to-use dashboard template from Mokkup. Add in your data and export it however you like. Here’s how to do it:
1. Create or Log in to Your Mokkup Account
Start by signing up on Mokkup.ai using your email. If you already have an account, just log in, and you'll be good to go.
2. Choose and Customize Your Dashboard Template
Find the Primary Schools Student Admissions & Enrollment Dashboard template in the Templates section. Use the drag-and-drop editor to adjust KPIs, edit filters, or add elements based on your data.
3. Export to Your BI Tool
Once your dashboard wireframe is ready, use the BI Tool Export feature to send it directly to Power BI or Tableau for further analysis and enhancements. You can also download the dashboard as a PDF, PNG, or JPEG, embed it on a platform, or invite your team to collaborate.
Note: This is a Pro template. You'll need a Pro subscription on Mokkup to use and customize this dashboard wireframe. Upgrade anytime to unlock full access.
Primary Schools Student Admissions & Enrollment Dashboard Example
An admissions director opens this dashboard at the start of a new intake cycle to understand where the current academic year stands compared to the last one, and whether early application activity signals a stronger or weaker enrollment season. The first question is usually simple: are enough applications coming in, and are they converting at a healthy rate once a family reaches the offer stage? From there, the director can filter by grade level or location to see whether certain regions are lagging and need a renewed outreach push before the deadline closes. The dashboard also supports a second, more operational conversation. Enrollment managers rely on time-to-decision tracking for school admissions to compare how long families in different locations wait for a decision, since a slow decision window in one region often explains why that region's waitlist conversion rate tracking dashboard view looks weaker than others.
Marketing leads use the same screen to check how spend is distributed across feeder schools, open houses, digital ads, and referrals, then reallocate budget toward whichever channel is producing the most confirmed seats rather than just the most applications. Planners can also step through the admissions funnel stage by stage to see where families are stalling between submission and acceptance, so outreach can be timed before a family disengages. Taken together, the dashboard helps admissions and marketing teams move past guesswork. Instead of reacting after enrollment targets are missed, teams can catch a slowing region, an underperforming channel, or a lengthening decision window while there is still time to act, and close the cycle with a confirmed class that matches the school's capacity and budget goals.
How to Analyze Data in a Primary Schools Student Admissions & Enrollment Dashboard
Here is how you can analyze data from this dashboard:
- Filter by Academic Year and Grade Level to compare how this year's admissions cycle is tracking against prior cohorts.
- Segment by Application Source to see which channels bring in applications that actually convert to enrollment.
- Use the Location filter to compare Enrollment Yield Rate by Location and flag regions falling behind.
- Step through the Admission Stage Conversion funnel to pinpoint where families drop off between submission and enrollment.
- Use this time-to-decision tracking for school admissions view to flag regions where slow processing is costing enrollments.
- Use the student acquisition cost by grade analysis to see which grade levels cost more to fill than others.
- Check the Admissions Marketing Spend Breakdown against enrollment outcomes to judge channel efficiency.
- Cross-reference Applications by Feeder School against confirmed enrollments to prioritize high-yield partner schools.
Benefits of a Primary Schools Student Admissions & Enrollment Dashboard
The following are the benefits of using this dashboard:
- Gives admissions offices one consolidated view instead of scattered feeder-school and channel spreadsheets.
- Surfaces the admissions marketing spend breakdown tracking view needed to justify budget shifts between channels.
- Highlights which locations need faster decision turnaround before families choose another school.
- Makes the enrollment yield rate monitoring tool visible at a glance so leadership can track progress toward class-size goals.
- Reduces reliance on manual reporting cycles between admissions, marketing, and finance teams.
- Helps schools identify high-value feeder schools and channels worth deeper investment.
- Supports faster, data-backed decisions during a short and time-sensitive admissions window.
KPIs to Track in a Primary Schools Student Admissions & Enrollment Dashboard
The following key KPIs can be tracked by using this dashboard:
- Total Applications Received (count) - the total number of applications submitted for the selected academic year, showing overall demand.
- Confirmed Enrollments (count) - the number of applicants who have completed enrollment, the ultimate measure of admissions success.
- Waitlist Conversion Rate (%) - the share of waitlisted applicants who are eventually offered and accept a seat; this waitlist conversion rate tracking dashboard view shows how much backup demand converts to real enrollment.
- Applications by Feeder School (count) - application volume broken down by originating feeder school, used to identify strong partner-school relationships.
- Enrollment Yield Rate (%) - the percentage of accepted offers that convert into confirmed enrollments, a core signal for this enrollment yield rate monitoring tool.
- Student Acquisition Cost ($) - the average marketing and outreach cost per enrolled student, tracked here through the student acquisition cost by grade analysis view.
- Average Time-to-Decision (days) - Average number of days between application submission and decision issuance; reflects processing efficiency.
- Admissions Marketing Spend ($K) - Total marketing expenditure allocated to attracting prospective families across all channels.
Frequently Asked Questions
1. Who should use the Primary Schools Student Admissions & Enrollment Dashboard?
Admissions directors, enrollment managers, and school marketing teams use this primary school student admissions and enrollment dashboard to track application volume, conversion, and spend in one place. It also supports finance teams reviewing acquisition cost against enrollment targets.
2. Can this dashboard track admissions performance across multiple locations?
Yes. The Location filter lets teams compare enrollment yield rate, average time-to-decision, and acquisition cost across every region a school operates in, making it easy to flag underperforming areas.
3. How does the dashboard help reduce student acquisition cost?
By comparing the admissions marketing spend breakdown tracking view against enrollment outcomes by channel, teams can shift budget toward feeder schools, open houses, or referrals that consistently produce lower-cost, higher-yield enrollments.