
What is a Specialized Program School Curriculum Delivery Dashboard?
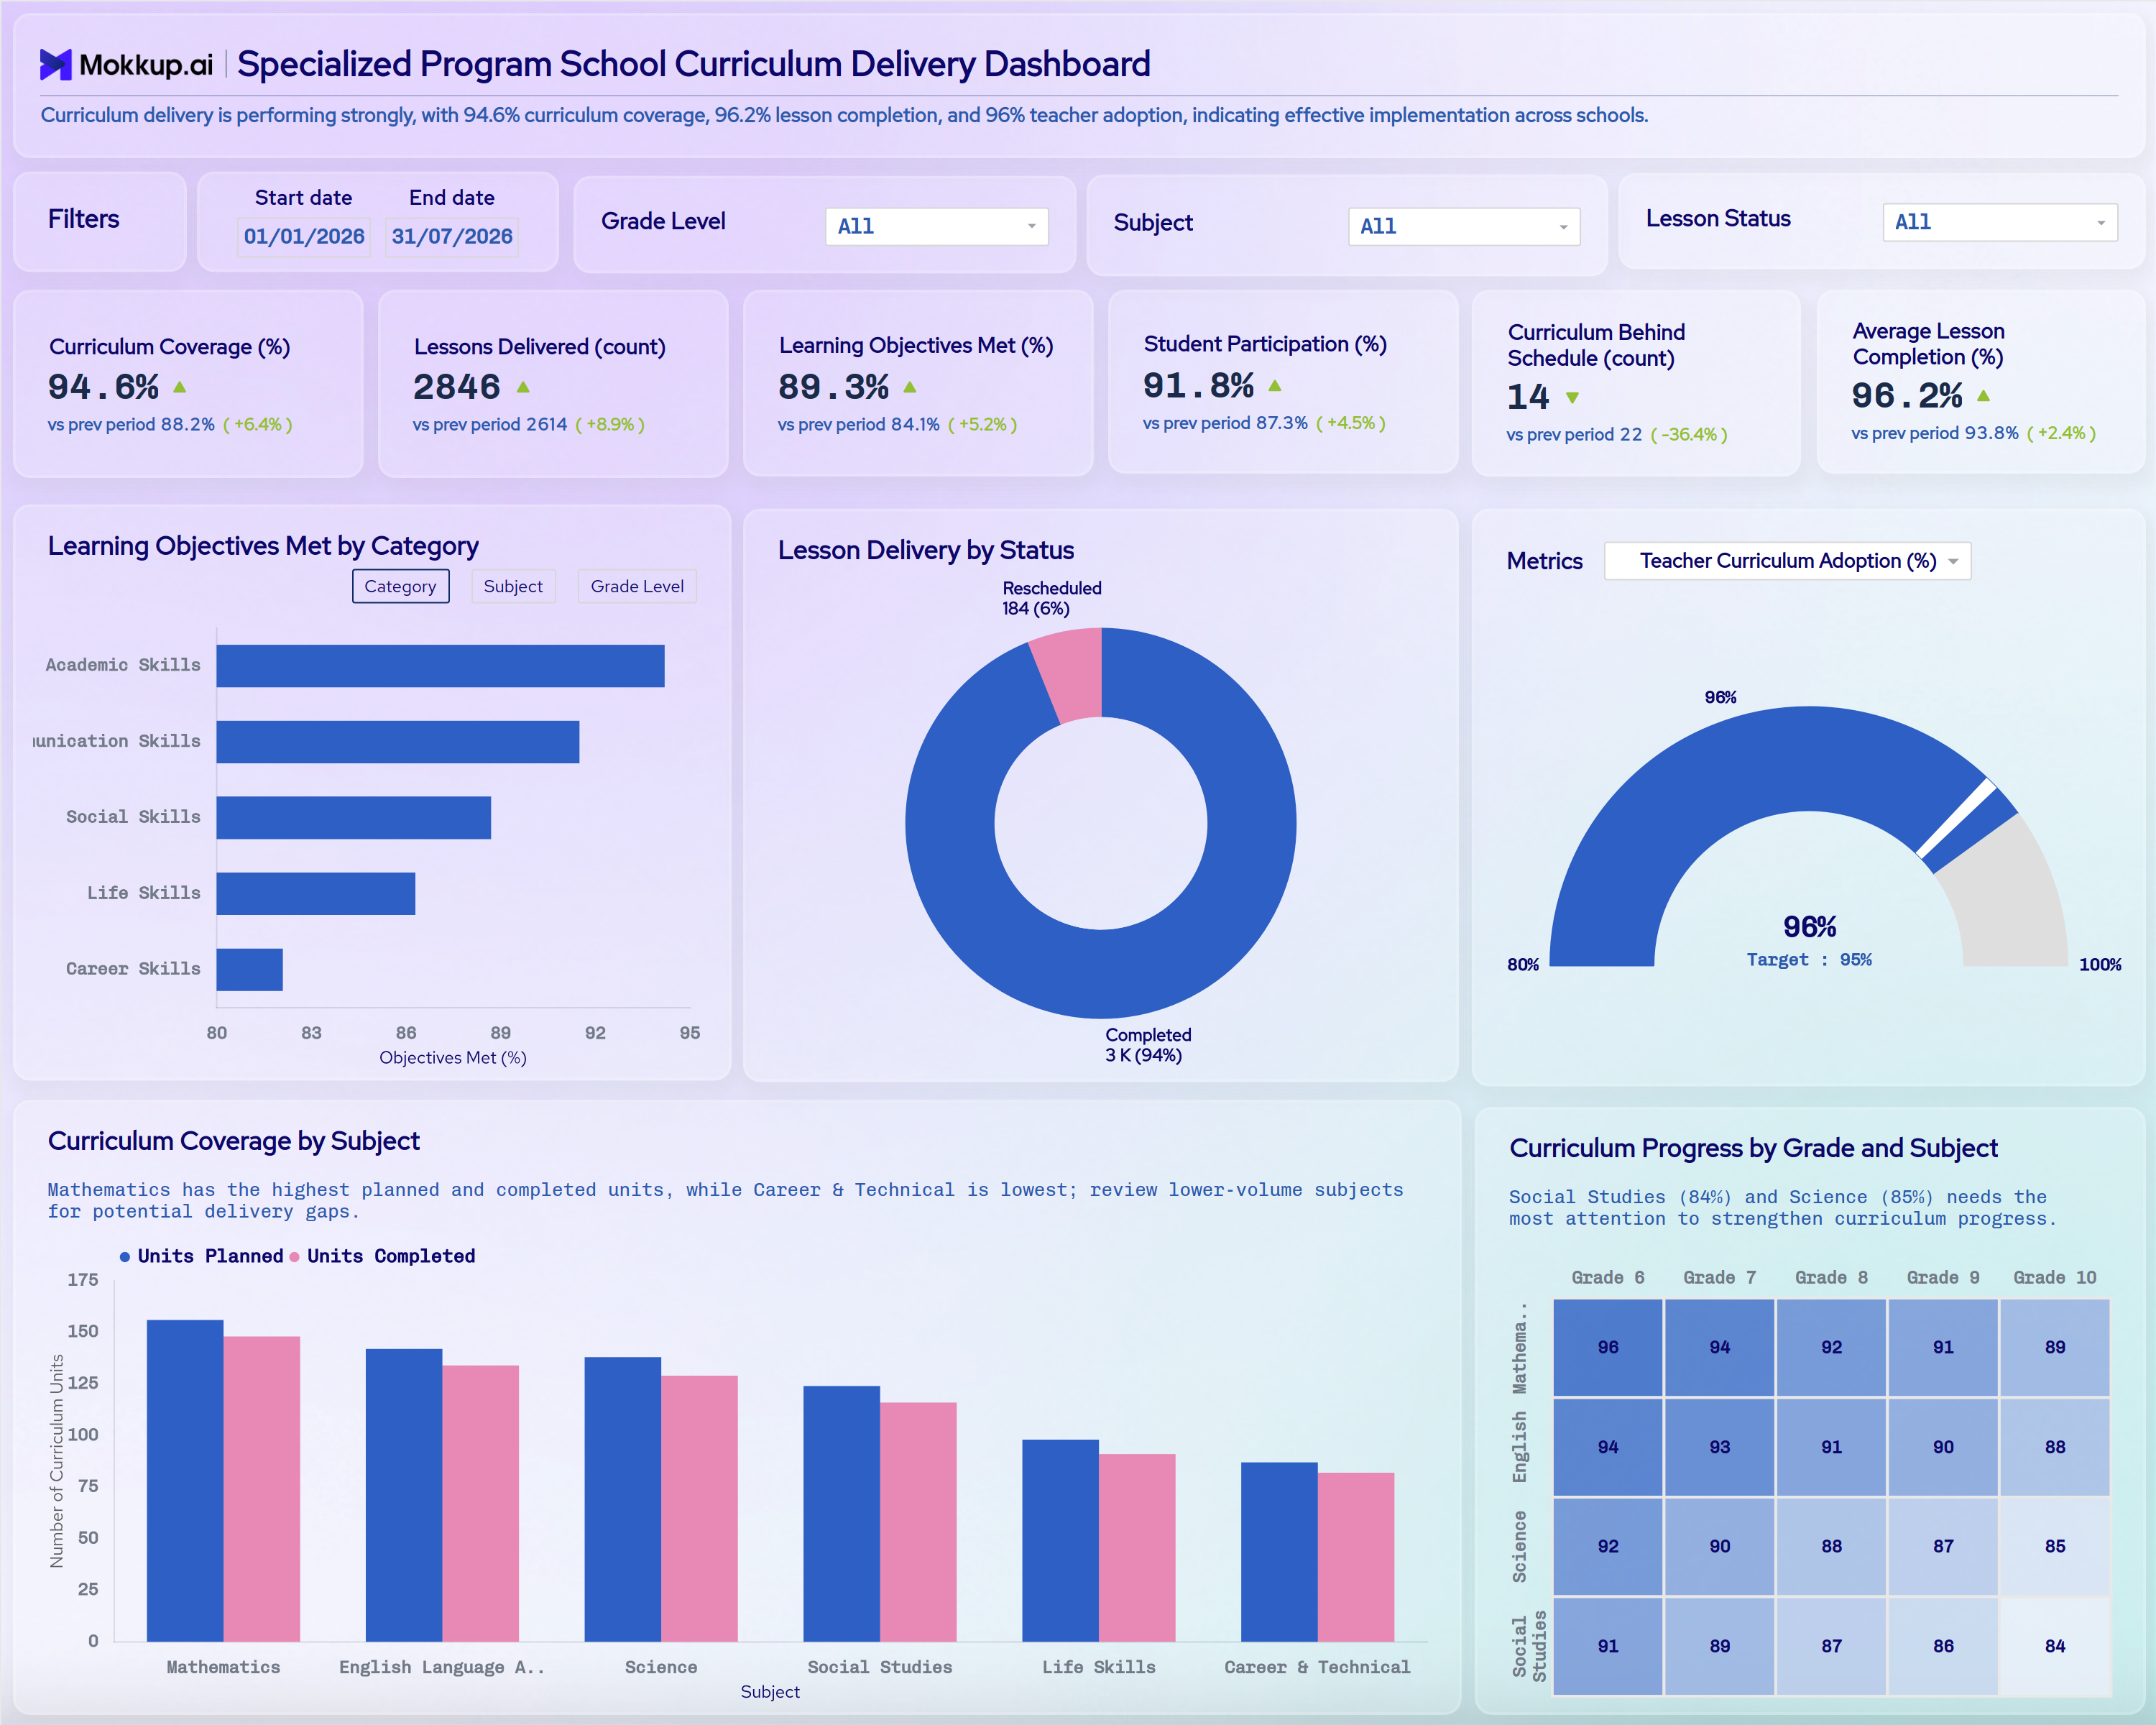
The Specialized Program School Curriculum Delivery Dashboard gives specialized education administrators and curriculum coordinators a consolidated view of how lesson plans move from schedule to classroom delivery across grade levels and subjects. Built for schools running individualized academic tracks, this Specialized Program School curriculum delivery dashboard brings curriculum coverage, lesson delivery counts, and learning objective attainment into one workspace instead of scattered spreadsheets. A summary line at the top describes overall delivery performance in plain language. Each KPI card compares the current value with the previous period and shows the % change.
Curriculum leads use it to confirm that every subject stays on pace with planned units, that teachers are adopting the curriculum consistently, and that students are engaging with lessons as delivered. A student participation rate tracking dashboard view sits alongside these coverage metrics, so staff can judge delivery quality and engagement together instead of reviewing them in separate reports. Filters for date range, grade level, subject, and lesson status let teams narrow the view to the exact class or period under review.
How to Create a Specialized Program School Curriculum Delivery Dashboard
You don't need to build your report from scratch; just start with a ready-to-use dashboard template from Mokkup. Add in your data and export it however you like. Here's how to do it:
1. Create or Log in to Your Mokkup Account
Start by signing up on Mokkup.ai using your email. If you already have an account, just log in, and you'll be good to go.
2. Choose and Customize Your Dashboard Template
Find the Specialized Program School Curriculum Delivery Dashboard template in the Templates section. Use the drag-and-drop editor to adjust KPIs, edit filters, or add elements based on your data.
3. Export to Your BI Tool
Once your dashboard wireframe is ready, use the BI Tool Export feature to send it directly to Power BI or Tableau for further analysis and enhancements. You can also download the dashboard as a PDF, PNG, or JPEG, embed it on a platform, or invite your team to collaborate.
Note: This is a Pro template. You'll need a Pro subscription on Mokkup to use and customize this dashboard wireframe. Upgrade anytime to unlock full access.
Specialized Program School Curriculum Delivery Dashboard Example
A curriculum coordinator at a Specialized Program School opens this dashboard at the start of a grading period to check whether lesson delivery is keeping pace with the academic calendar across every grade and subject. The header summary and KPI cards show at once whether coverage, objectives met, and participation have improved since the last period and whether fewer units are behind schedule. Filtering by date range, grade level, subject, or lesson status then narrows the view to a single class before drilling into the details.
The Lesson Delivery by Status chart shows how many lessons were completed versus rescheduled. The Teacher Curriculum Adoption gauge shows whether staff is following the approved curriculum closely enough to hit the target rate. Reviewing Learning Objectives Met by Category, with a switch to view by subject or grade level, lets leaders see whether academic, communication, social, life, and career skill areas are progressing at similar rates. That way, lagging areas get attention before report cards go out.
Comparing planned versus completed units by subject highlights where pacing gaps are widening. The grade-by-subject heatmap lets planners compare progress across grades at a glance instead of paging through separate subject reports. This curriculum coverage tracking dashboard view turns pacing conversations into something coordinators can act on immediately. It helps teams catch slippage early and confirm learning objectives are being met without waiting for term-end reports.
How to Analyze Data in a Specialized Program School Curriculum Delivery Dashboard
Here is how you can analyze data from this dashboard:
- Set the Review Period: Use the Start and End date filter to match your grading period or term.
- Filter by Grade Level: Isolate curriculum pacing for a single grade band.
- Filter by Subject: Compare coverage and completion within one academic area.
- Filter by Lesson Status: Separate delivered lessons from those still pending or rescheduled.
- Read Period-over-Period KPI Changes: Check the "vs prev period" value and % change on each KPI card. For Curriculum Behind Schedule, a decrease is a positive sign.
- Review Lesson Delivery by Status: Use the donut chart to see the share of lessons completed versus rescheduled and spot delivery disruptions.
- Analyze Objectives Met: Use the Learning Objectives Met by Category chart as a learning objectives met tracking tool, and switch between Category, Subject and Grade Level views to find lagging areas.
- Monitor Teacher Adoption: Use the Teacher Curriculum Adoption gauge to confirm staff is delivering lessons consistently against the target rate. The Metrics dropdown lets you switch the gauge to other measures.
- Spot Pacing Gaps by Subject: Compare Units Planned with Units Completed in the Curriculum Coverage by Subject chart.
- Compare Grades and Subjects: Use the Curriculum Progress by Grade and Subject heatmap to compare progress across grade levels and subjects at a glance.
Benefits of a Specialized Program School Curriculum Delivery Dashboard
The following are the benefits of using this dashboard:
- Centralized Curriculum View: Brings curriculum coverage, lesson delivery, and learning objective metrics together in one dashboard.
- Clear Performance Direction: Previous-period comparisons on every KPI show at a glance whether curriculum delivery is improving.
- Fidelity Monitoring: Works as a teacher curriculum adoption rate monitoring tool that flags fidelity gaps early against a set target.
- Less Manual Tracking: Pre-built visuals cut down on tracking pacing across grade levels and subjects by hand.
- Side-by-Side Comparisons: The curriculum progress by grade and subject heatmap makes grade-by-grade comparisons easy.
- Early Schedule Alerts: Helps coordinators catch curriculum behind-schedule counts before they affect term outcomes.
- Delivery Disruption Visibility: Shows how many lessons are being rescheduled, so recurring disruptions can be fixed.
- Shared Engagement View: Gives administrators and teachers a shared student participation rate tracking dashboard view alongside curriculum pacing.
- Family Conversations: Supports data-informed conversations with families about learning objective attainment.
KPIs to Track in a Specialized Program School Curriculum Delivery Dashboard
The following key KPIs can be tracked by using this dashboard:
- Curriculum Coverage (%): Measures the share of planned curriculum units delivered to date — the core signal in this curriculum coverage tracking dashboard.
- Lessons Delivered (count): Tracks the total number of lessons taught across all subjects and grades during the selected period.
- Learning Objectives Met (%): Quantifies how many instructional objectives students achieved, the anchor metric for any learning objectives met tracking tool.
- Student Participation (%): Measures how consistently students engage with delivered lessons, a key input for this student participation rate tracking dashboard.
- Curriculum Behind Schedule (count): Number of curriculum units that have fallen behind their planned delivery date and need attention. A decrease compared with the previous period is a positive sign.
- Average Lesson Completion (%): how fully each delivered lesson was completed against its planned scope.
- Teacher Curriculum Adoption (%): shown as a gauge against a target rate, this teacher curriculum adoption rate monitoring metric confirms staff is following the approved curriculum.
- Lesson Delivery by Status: split of lessons into completed and rescheduled.
Frequently Asked Questions
1. What does the Specialized Program School Curriculum Delivery Dashboard track?
It tracks curriculum coverage, lessons delivered, learning objectives met, student participation, curriculum behind schedule, lesson completion, lesson delivery status and teacher curriculum adoption across grades and subjects. This Specialized Program School curriculum delivery dashboard brings all of that into filterable views by date range, grade level, subject and lesson status.
2. Can this dashboard compare curriculum pacing across grade levels and subjects?
Yes. The Curriculum Progress by Grade and Subject heatmap lets teams compare pacing across grade bands and subject areas in one view, so uneven progress is easy to spot.
3. Is this dashboard suitable for specialized or special education instructional programs?
Yes. Its Grade Level, Subject, and Lesson Status filters, along with skill-category objective tracking, make it well suited to Specialized Program Schools managing individualized academic pathways.