
What is a Special Education Therapy Services Dashboard
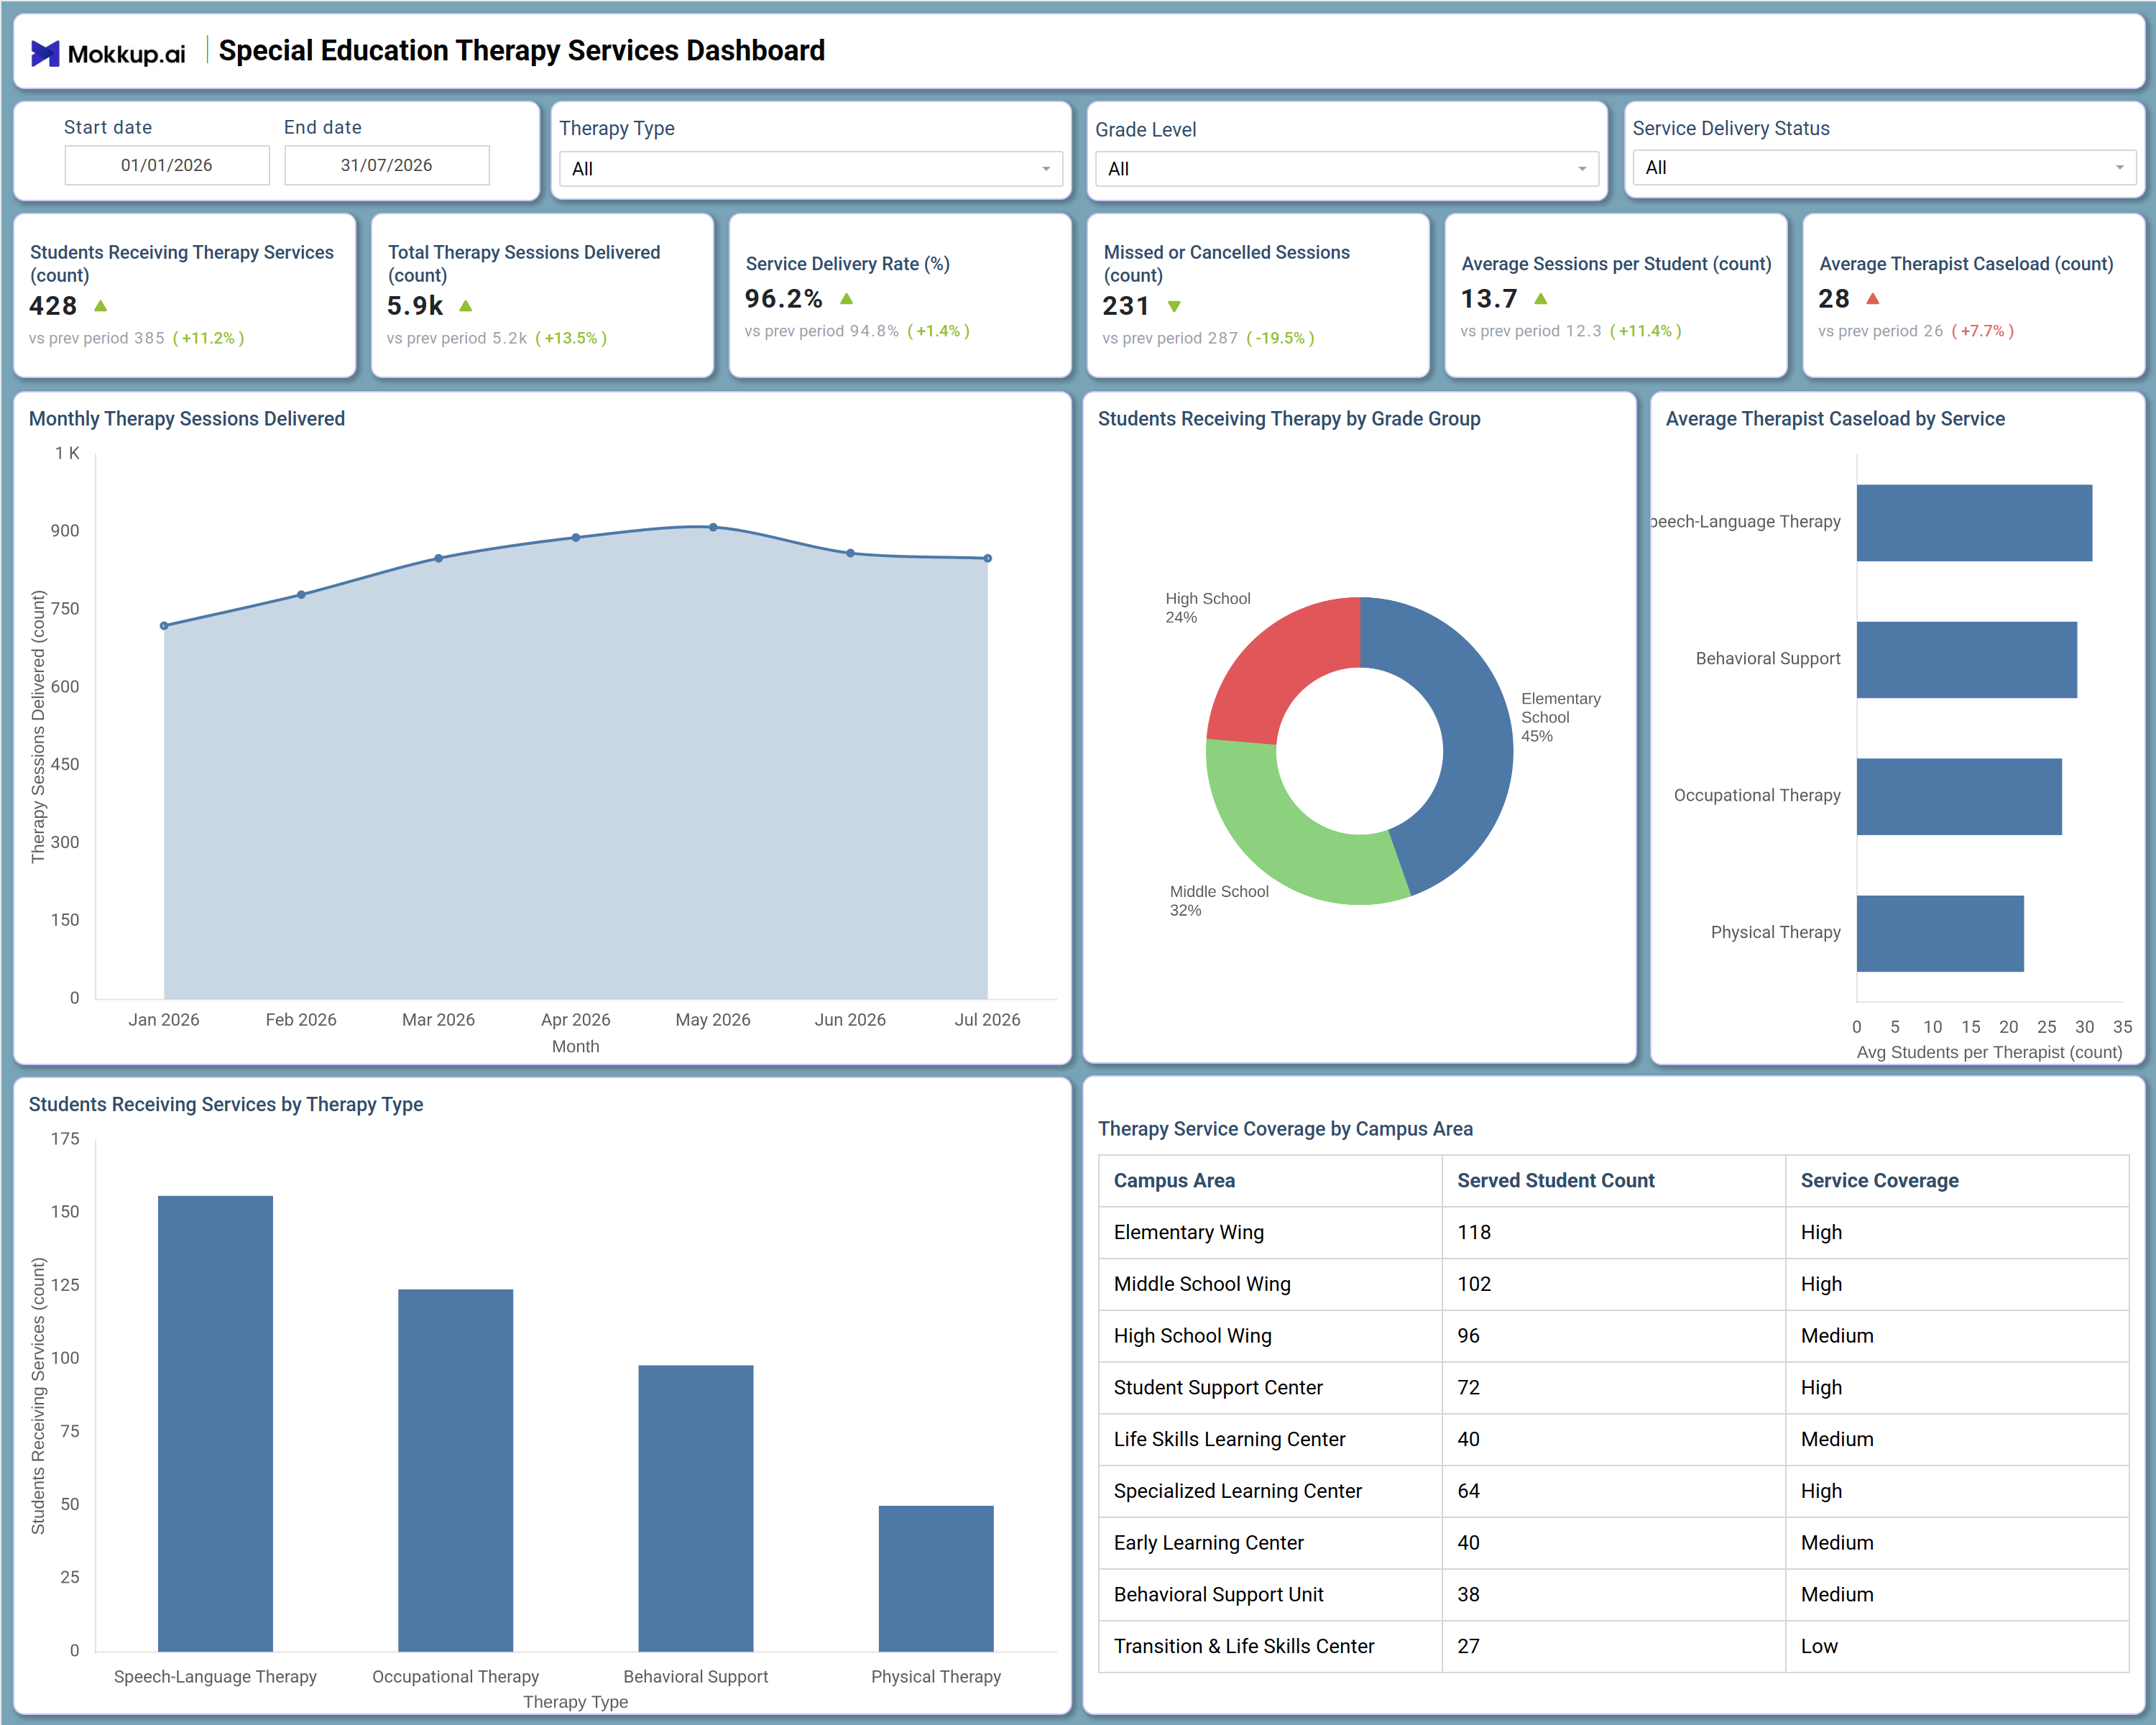
The Special Education Therapy Services Dashboard is a single-screen reporting template built for special education coordinators, therapy department leads, and school administrators who oversee speech-language, occupational, behavioral, and physical therapy programs. This Special Education Therapy Services Dashboard consolidates session volume, delivery performance, and staffing load into one view, replacing separate therapist logs and departmental spreadsheets with a single source of truth. At its core, the template functions as a therapy sessions delivered tracking dashboard, pairing session counts with period-over-period comparisons so administrators can see whether service volume is keeping pace with enrollment. A dedicated KPI tile also gives it the role of a missed therapy sessions tracking dashboard, surfacing cancellations and no-shows that would otherwise go unnoticed until families or clinicians raised concerns. Start date, End date, Therapy Type, Grade Level, and Service Delivery Status filters let users narrow the entire view to a single program, campus wing, or reporting period.
How to Create a Special Education Therapy Services Dashboard
You don't need to build your report from scratch—just start with a ready-to-use dashboard template from Mokkup. Add in your data and export it however you like. Here's how to do it:
1. Create or Log in to Your Mokkup Account
Start by signing up on Mokkup.ai using your email. If you already have an account, just log in, and you'll be good to go.
2. Choose and Customize Your Dashboard Template
Find the Special Education Therapy Services Dashboard template in the Templates section. Use the drag-and-drop editor to adjust KPIs, edit filters, or add elements based on your data.
3. Export to Your BI Tool
Once your dashboard wireframe is ready, use the BI Tool Export feature to send it directly to Power BI or Tableau for further analysis and enhancements. You can also download the dashboard as a PDF, PNG, or JPEG, embed it on a platform, or invite your team to collaborate.
Note: This is a Pro template. You'll need a Pro subscription on Mokkup to use and customize this dashboard wireframe. Upgrade anytime to unlock full access.
Special Education Therapy Services Dashboard Example
A special education program director typically opens this dashboard at the start of a monthly or quarterly review to understand whether therapy services are reaching every student who needs them and whether staffing levels can support current demand. Coming in with filters set to a specific grade level or therapy type, the director wants a fast read on whether service delivery is on track before it becomes a compliance concern. From the single screen, therapy leads use students receiving therapy by grade group insights to identify where elementary, middle, or high school programs are underserved relative to enrollment. Using this service delivery rate monitoring tool, they confirm sessions are being completed as scheduled and drill into which therapy type is driving cancellations when the rate dips.
Reviewing average caseload by service lets supervisors identify which discipline—speech-language, occupational, behavioral, or physical therapy- is stretched thinnest, so they can prioritize new hires or redistribute students before wait times grow. The campus-area table lets administrators cross-check coverage at the wing or center level, flagging locations where service coverage has slipped despite steady student counts. Taken together, the dashboard helps therapy departments move from reactive scheduling to proactive workforce planning, giving school leadership the evidence needed to justify additional staffing, rebalance caseloads, and demonstrate that every student's therapy plan is being fulfilled without digging through session-by-session records.
How to Analyze Data in a Special Education Therapy Services Dashboard
Here is how you can analyze data from this dashboard:
- Use the Therapy Type filter to isolate performance data for Speech-Language, Occupational, Behavioral Support, or Physical Therapy individually.
- Filter by Grade Level to compare therapy demand across Elementary, Middle, and High School populations.
- Apply the Service Delivery Status filter to focus on completed, missed, or cancelled sessions for a specific period.
- Monitor the Monthly Therapy Sessions Delivered trend alongside this service delivery rate monitoring tool to catch seasonal dips early.
- Review Students Receiving Therapy by Grade Group to see which grade band accounts for the largest share of active caseloads.
- Compare Average Therapist Caseload by Service to identify which discipline needs additional staffing support.
- Analyze Students Receiving Services by Therapy Type to determine which programs carry the highest session volume.
- Cross-reference the Therapy Service Coverage by Campus Area table to spot wings or centers with below-target coverage.
Benefits of a Special Education Therapy Services Dashboard
The following are the benefits of using this dashboard:
- Centralizes therapy session volume, delivery performance, and caseload data for an entire campus in one template.
- Functions as a therapist caseload tracking dashboard that flags overloaded disciplines before service quality suffers.
- Works as a therapy sessions delivered tracking dashboard that turns monthly session counts into an easy trend line for reporting.
- Reduces manual compilation of therapist logs and attendance sheets into a single visual report.
- Surfaces missed or cancelled sessions early, giving administrators a missed therapy sessions tracking dashboard that flags scheduling gaps before they affect IEP compliance.
- Supports campus-level planning by comparing service coverage across wings, centers, and support units.
- Gives special education coordinators and therapy supervisors a shared view of program performance.
KPIs to Track in a Special Education Therapy Services Dashboard
The following key KPIs can be tracked by using this dashboard:
- Students Receiving Therapy Services (count): Tracks the total number of students actively enrolled in speech-language, occupational, behavioral, or physical therapy programs.
- Total Therapy Sessions Delivered (count): Anchors this therapy sessions delivered tracking dashboard by measuring overall session volume completed across all therapy types.
- Service Delivery Rate (%): The centerpiece of this service delivery rate monitoring tool, showing the share of scheduled sessions actually delivered.
- Missed or Cancelled Sessions (count): Quantifies sessions that did not occur, helping teams investigate scheduling or staffing gaps.
- Average Sessions per Student (count): Shows the typical intensity of therapy support each student receives, useful for benchmarking against IEP goals.
- Average Therapist Caseload (count): The key input for this therapist caseload tracking dashboard, tracking how many students each therapist supports on average.
- Students Receiving Therapy by Grade Group (%): Breaks down active caseloads across Elementary, Middle, and High School so leaders can see where demand is concentrated.
- Service Coverage by Campus Area (rating): Rates each wing or center as High, Medium, or Low relative to student need, supporting facility-level staffing decisions.
Frequently Asked Questions
1. What industries benefit most from this Special Education Therapy Services Dashboard?
Special education departments, therapy service providers, and school district administrators overseeing speech-language, occupational, behavioral, and physical therapy programs benefit most. Multi-campus special education networks also use it to compare service delivery across sites.
2. Can this dashboard track missed or cancelled therapy sessions?
Yes, the Missed or Cancelled Sessions KPI tile gives this template built-in function as a missed therapy sessions tracking dashboard, showing counts and period-over-period change. Combined with the Service Delivery Status filter, it helps teams pinpoint which therapy type or grade level is driving cancellations.
3. Is this dashboard suitable for tracking therapist workload across disciplines?
Yes, the Average Therapist Caseload by Service chart breaks caseload down by Speech-Language Therapy, Occupational Therapy, Behavioral Support, and Physical Therapy. This makes it a practical therapist caseload tracking dashboard for spotting which discipline needs added staff before caseloads become unsustainable.