What is an Elderly Patient Care Plan & Therapy Dashboard?
An Elderly Patient Care Plan & Therapy Dashboard is a specialized digital platform designed for geriatric care centers and elderly clinics. It consolidates clinical, therapy, and operational data, providing a real-time view of patient progress, therapy adherence, and care outcomes.
Clinicians can track functional abilities, cognitive performance, nutritional status, risk factors like falls or hospital readmissions, and therapy goal achievements. By integrating multiple metrics, such as average ADL scores, therapy session completion rates, and patient satisfaction, the dashboard enables data-driven decision-making. It supports targeted interventions, efficient resource allocation, and continuous monitoring to enhance elderly patient outcomes.
How to Create an Elderly Patient Care Plan & Therapy Dashboard
You don’t need to build your report from scratch—just start with a ready-to-use dashboard template from Mokkup. Add in your data and export it however you like. Here’s how to do it:
1. Create or Log in to Your Mokkup Account
Start by signing up on Mokkup.ai using your email. If you already have an account, just log in, and you’ll be good to go.
2. Choose and Customize Your Dashboard Template
Find the Elderly Patient Care Plan & Therapy Dashboard template in the Templates section. Use the drag-and-drop editor to adjust KPIs, edit filters, or add elements based on your data.
3. Export to Your BI Tool
Once your dashboard wireframe is ready, use the BI Tool Export feature to send it directly to Power BI or Tableau for further analysis and enhancements. You can also download the dashboard as a PDF, PNG, or JPEG, embed it on a platform, or invite your team to collaborate.
Note: This is a Pro template. You’ll need a Pro subscription on Mokkup to use and customize this dashboard wireframe. Upgrade anytime to unlock full access.
Elderly Patient Care Plan & Therapy Dashboard Example
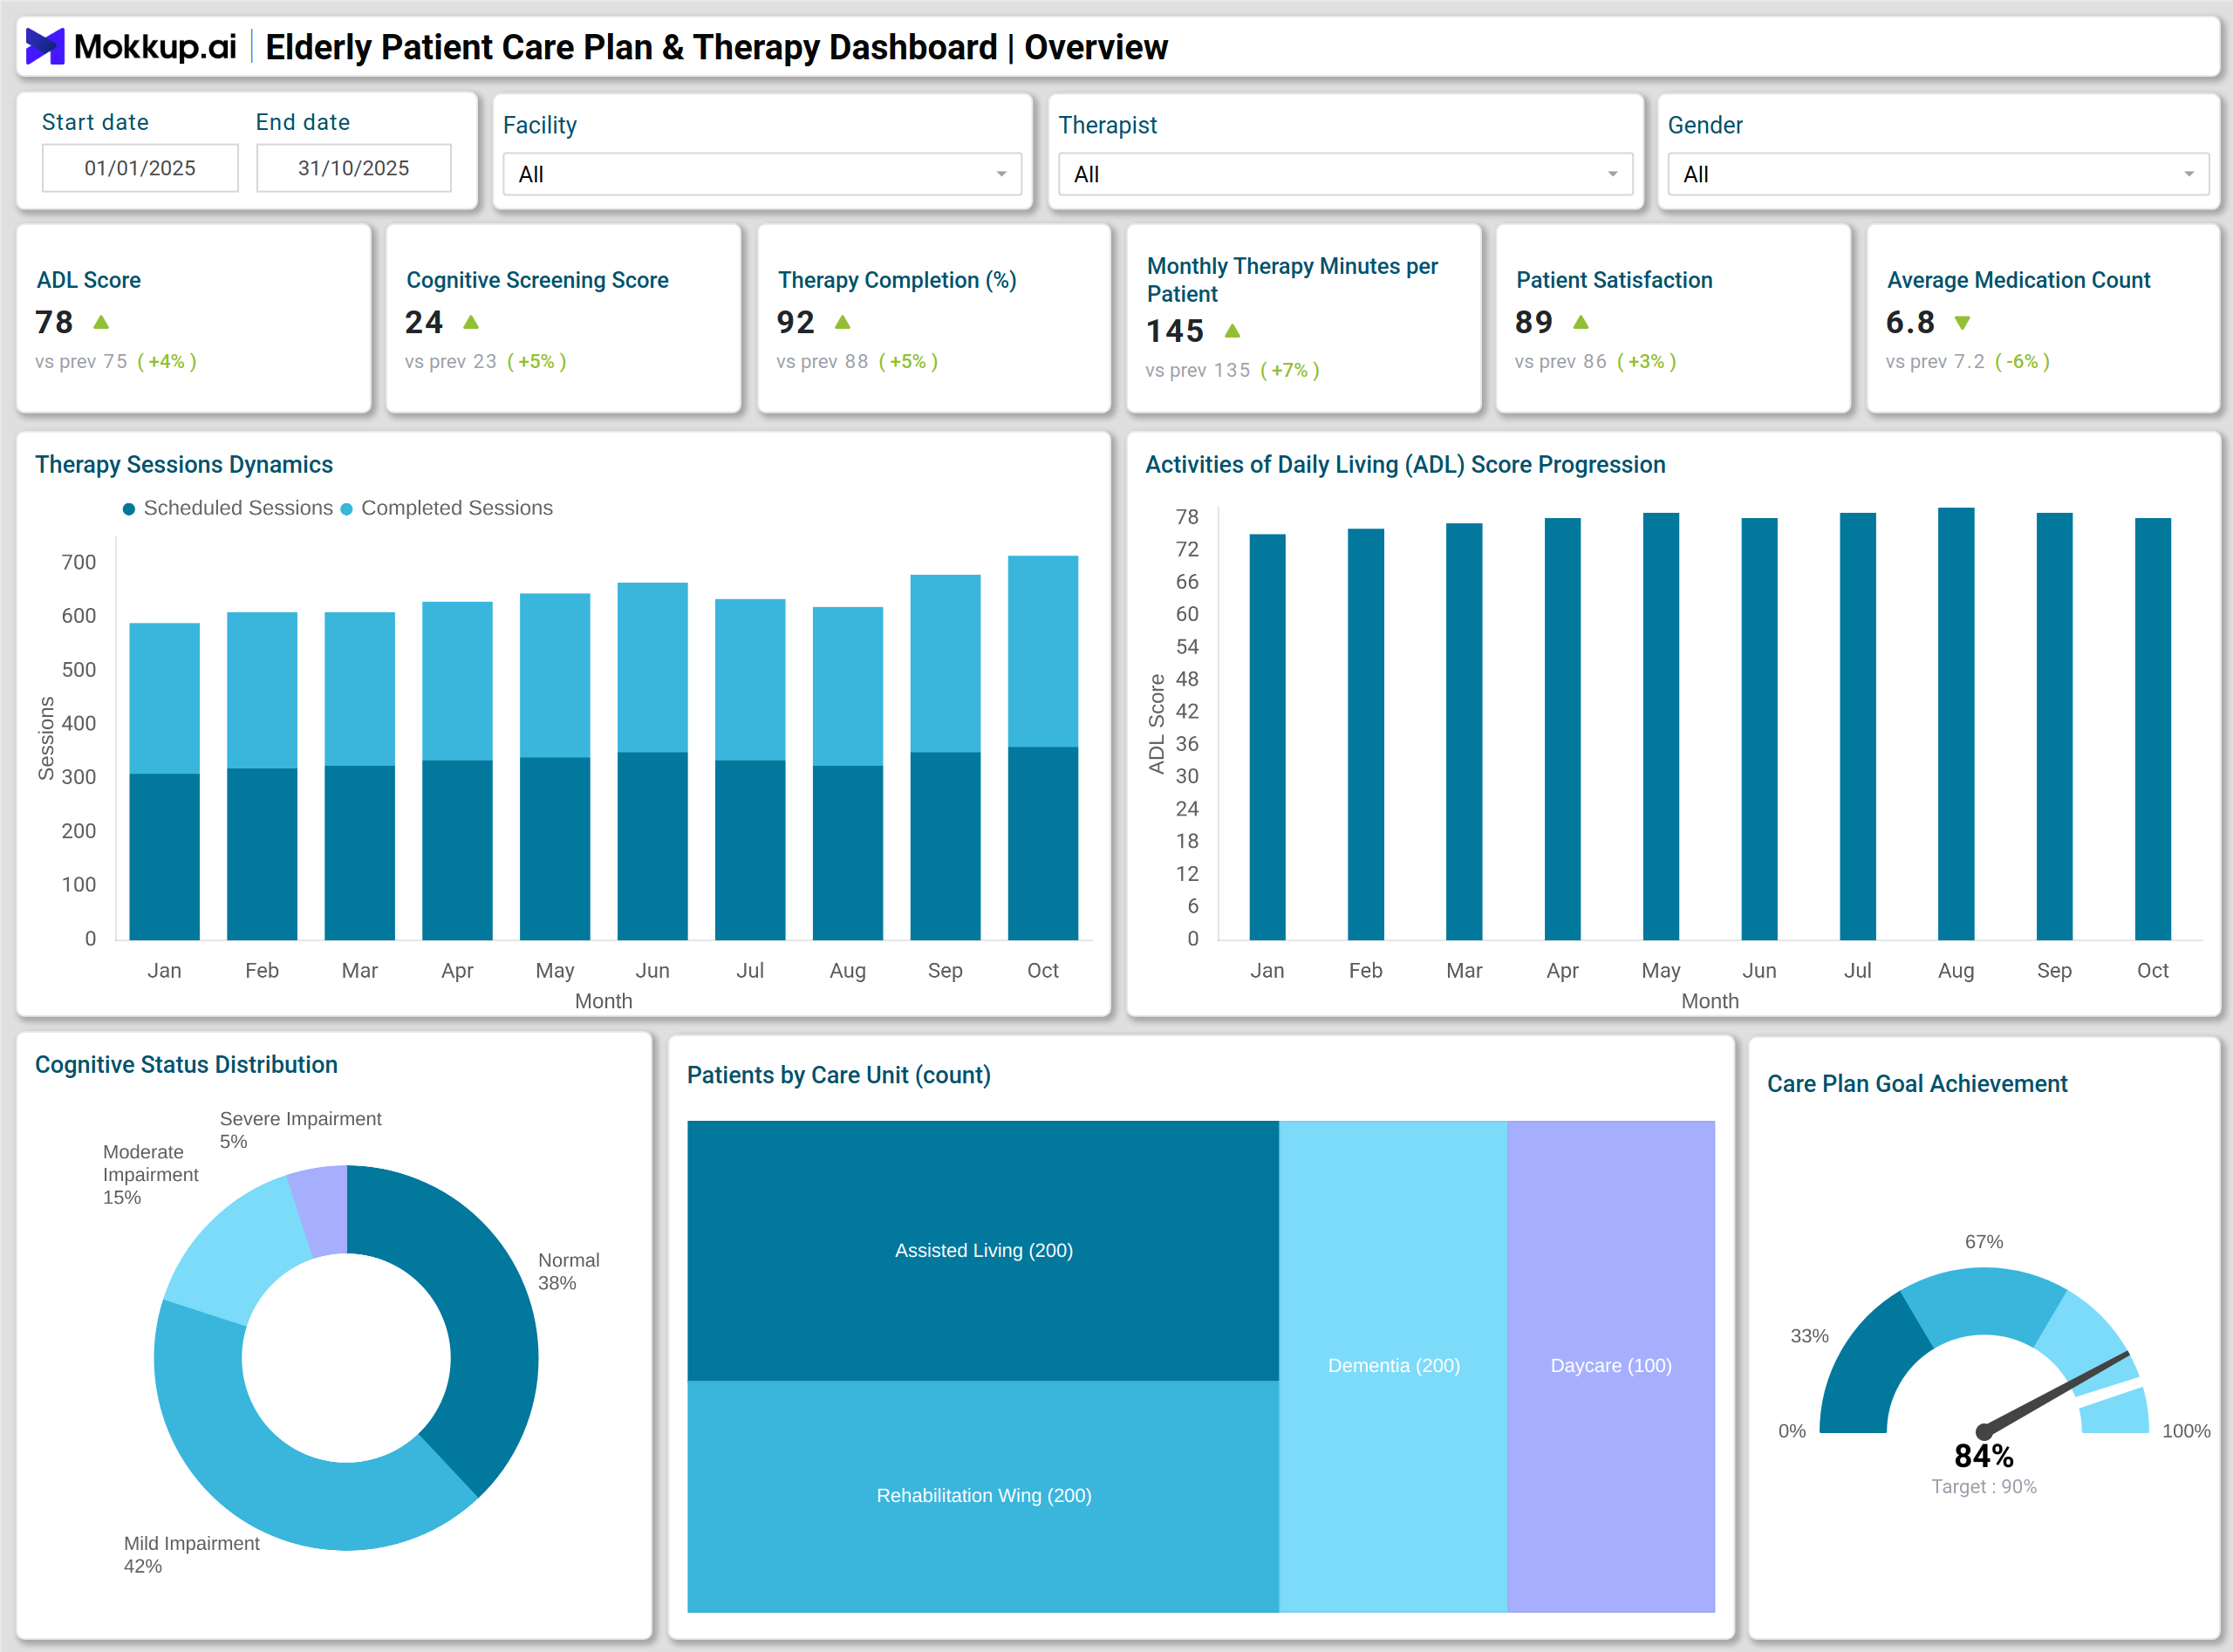
A typical Elderly Patient Care Plan & Therapy Dashboard provides both high-level KPIs and detailed visual analytics. Examples include - Stacked column charts showing scheduled versus completed therapy sessions each week, Line charts tracking ADL score trends over time, Donut charts visualizing cognitive health status distribution, Treemaps representing family satisfaction by care unit, Gauge charts displaying percentage of therapy goals achieved., Stacked bar charts for malnutrition screening results, Combo charts showing falls versus fall risk scores, Funnel charts tracking therapy goal progression, Heatmaps visualizing hospital readmissions by diagnosis and age group, and Waterfall charts showing therapy impact on ADL scores. These visualizations allow clinicians to quickly identify patients at risk, track therapy outcomes, and improve overall care quality.
How to Analyze Data in Elderly Patient Care Plan & Therapy Dashboards
Here is how data can be analyzed when you use the elderly therapy dashboard for clinics:
- Monitor Functional and Cognitive Progress: Evaluate ADL and MMSE scores over time to assess improvement.
- Assess Therapy Adherence: Compare the number of scheduled versus completed sessions and the average therapy minutes per patient.
- Identify Safety Risks: Track fall risk, malnutrition, and continence improvement metrics.
- Measure Satisfaction: Review family and patient satisfaction metrics to improve engagement.
- Track Goal Achievement: Monitor therapy goals via funnel and gauge charts.
- Highlight High-Risk Patients: Utilize heatmaps and waterfall charts to track hospital readmissions and declining functional scores.
Benefits of Elderly Patient Care Plan & Therapy Dashboards
These are the benefits of using the patient care plan progress tracker:
- Improved Patient Outcomes: Continuous monitoring of functional and cognitive scores ensures timely interventions for mental health.
- Data-Driven Decisions: Real-time analytics allow prioritization of therapy plans.
- Enhanced Therapy Compliance: Track adherence and minutes per patient to maximize effectiveness.
- Operational Efficiency: Identify bottlenecks and optimize staff scheduling.
- Risk Management: Early identification of fall risks, malnutrition, and readmissions reduces complications.
- Family Engagement: Feedback metrics help improve communication and satisfaction.
KPIs to Track in Elderly Patient Care Plan & Therapy Dashboards
You can track the following elderly care plan therapy metrics from this dashboard:
- Average Activities of Daily Living (ADL) Score: Measures patient independence in daily tasks.
- Average Cognitive Screening Score (MMSE): Assesses memory and cognitive function levels.
- Therapy Sessions Completion Rate: Tracks adherence to prescribed therapy schedules.
- Average Therapy Minutes per Patient per Week: Monitors therapy intensity and engagement.
- Patient / Family Satisfaction: Evaluates overall experience and satisfaction with care services.
- Average Medication Count per Patient: Tracks medication load to prevent polypharmacy risks.
- Fall Risk Score (Average): Measures the likelihood of falls for preventive care planning.
Frequently Asked Questions
1. Who can benefit from this dashboard?
Geriatric care centers, elderly therapy clinics, and healthcare professionals managing patient care plans.
2. What types of metrics does it track?
Functional, cognitive, nutritional, therapy adherence, safety risks, and patient satisfaction metrics.
3. How does it improve therapy outcomes?
Provides real-time insights to intervene early, improve adherence, and optimize therapy plans.