
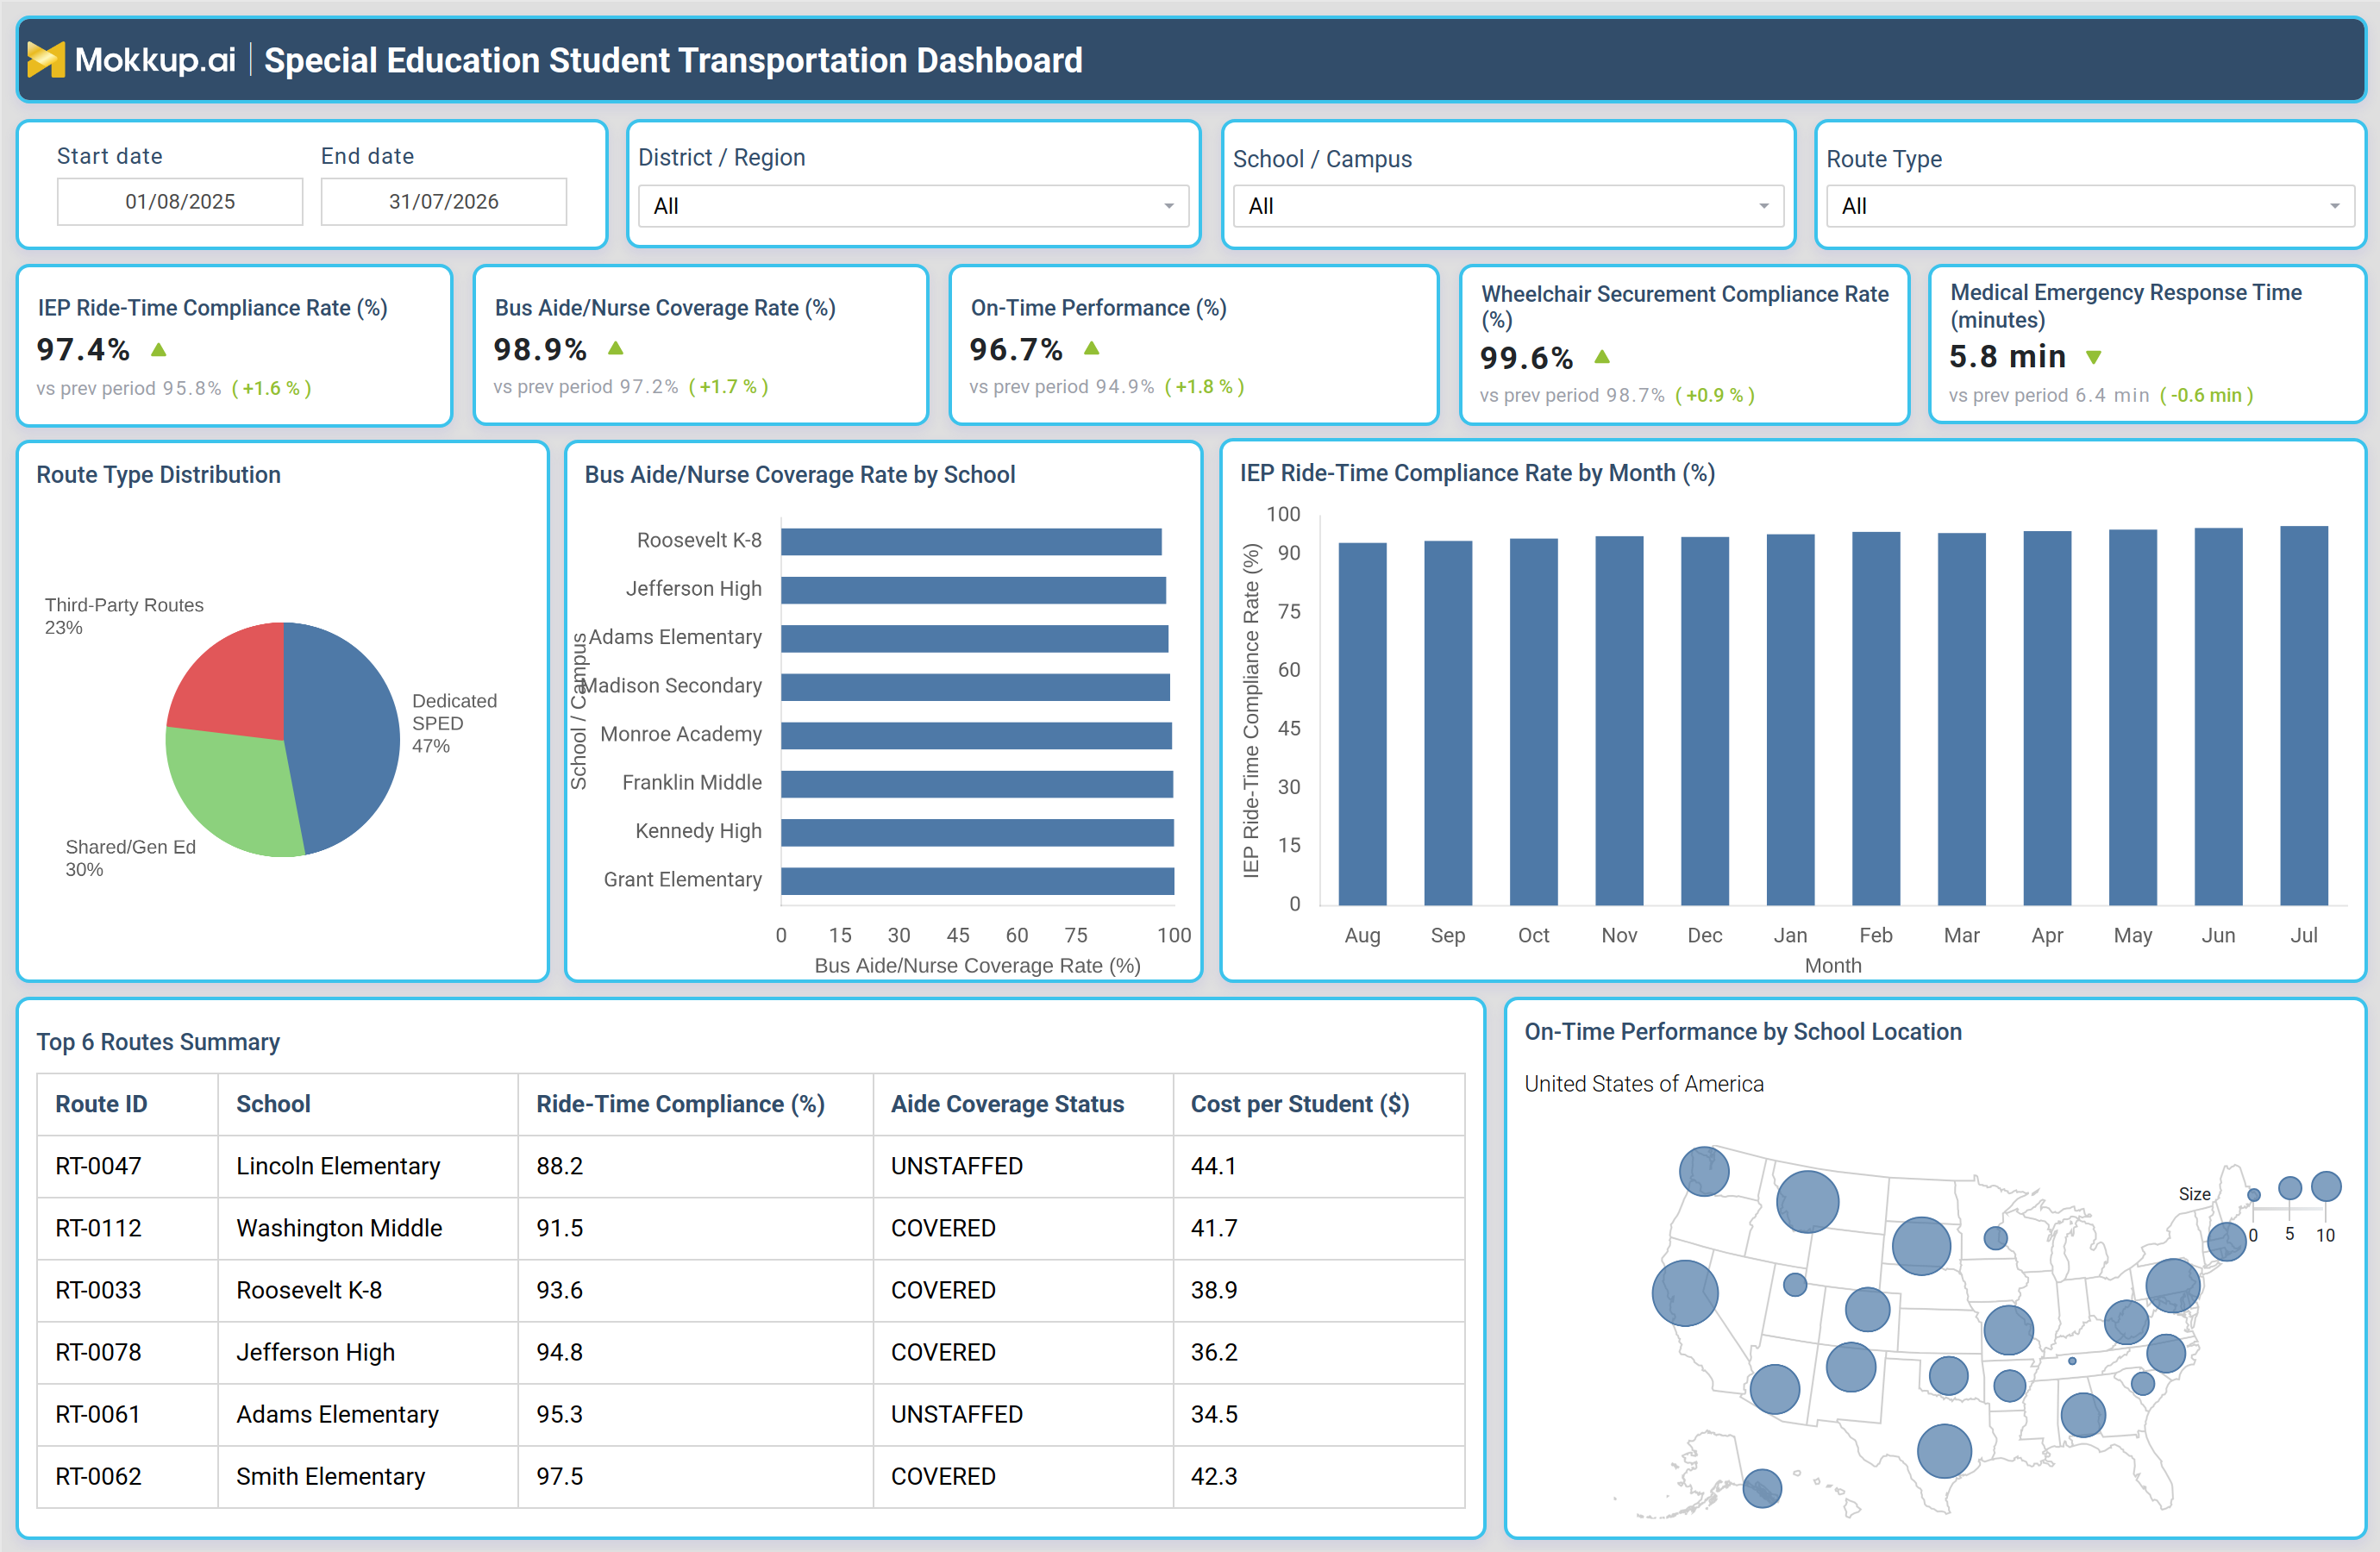
What is a Special Education Student Transportation Dashboard?
The Special Education Student Transportation Dashboard is a purpose-built special education student transportation dashboard that gives district transportation coordinators, special education directors, and compliance officers a single view into how safely and reliably students with IEPs are getting to and from school. It brings together ride-time compliance, aide and nurse staffing coverage, on-time arrivals, wheelchair securement adherence, and medical emergency response performance so transportation teams no longer have to reconcile route logs, staffing rosters, and incident reports separately.
Built around filters for date range, District/Region, School/Campus, and Route Type, the dashboard lets teams narrow their view from an entire transportation network down to a single school or a single route in seconds. Because special education transportation carries legal obligations under each student's Individualized Education Program, the dashboard is designed to surface exactly where those obligations are being met and where they are at risk, before a missed ride time or an unstaffed route turns into a compliance finding.
How to Create a Special Education Student Transportation Dashboard
You don't need to build your report from scratch—just start with a ready-to-use dashboard template from Mokkup. Add in your data and export it however you like. Here's how to do it:
1. Create or Log in to Your Mokkup Account
Start by signing up on Mokkup.ai using your email. If you already have an account, just log in, and you'll be good to go.
2. Choose and Customize Your Dashboard Template
Find the Special Education Student Transportation Dashboard template in the Templates section. Use the drag-and-drop editor to adjust KPIs, edit filters, or add elements based on your data.
3. Export to Your BI Tool
Once your dashboard wireframe is ready, use the BI Tool Export feature to send it directly to Power BI or Tableau for further analysis and enhancements. You can also download the dashboard as a PDF, PNG, or JPEG, embed it on a platform, or invite your team to collaborate.
Note: This is a Pro template. You'll need a Pro subscription on Mokkup to use and customize this dashboard wireframe. Upgrade anytime to unlock full access.
Special Education Student Transportation Dashboard Example
A district transportation coordinator typically opens this dashboard at the start of the week to understand whether IEP-mandated ride times are being honored across every route serving students with disabilities. Instead of pulling separate reports from the bus vendor, the special education office, and the nursing staff schedule, the coordinator can see route performance, staffing coverage, and safety compliance on one screen and immediately spot where attention is needed. From there, the coordinator can compare ride-time compliance and on-time performance across schools and campuses using this IEP ride-time compliance rate tracking tool, filtering by route type to distinguish dedicated SPED routes from shared general education runs and third-party contracted routes.
When a school shows compliance slipping below acceptable levels, the team can drill into that location to check whether an aide or nurse was assigned to the route, whether the vehicle carried a certified aide for wheelchair securement, and how quickly medical emergencies on that route have historically been resolved. Coordinators can prioritize retraining, reassign staff, or flag a vendor route for review based on the data, rather than waiting for a parent complaint or an audit to surface the issue. The outcome is a transportation program that special education leaders can defend to auditors, school boards, and parents alike: every IEP-mandated accommodation is tracked, every unstaffed or underperforming route is visible, and spend is accounted for against safety and compliance outcomes. Instead of reacting to incidents after the fact, transportation teams can act on trends before they turn into missed services or safety violations.
How to Analyze Data in a Special Education Student Transportation Dashboard
Here is how you can analyze data from this dashboard:
- Filter by District / School: Isolate transportation performance for a specific district, region, school, or campus.
- Segment by Route Type: Separate Dedicated SPED, Shared/Gen Ed, and Third-Party routes for focused analysis.
- Compare Ride-Time Compliance: Compare the IEP Ride-Time Compliance Rate with the prior period to identify emerging service gaps.
- Monitor Aide & Nurse Coverage: Cross-check coverage by school using the Aide Coverage Status column.
- Track Monthly Ride-Time Trends: Review monthly compliance trends to identify recurring or seasonal dips.
- Map On-Time Performance: Identify regional clusters of delayed routes using the school location map.
- Flag High-Cost Routes: Sort the Top 6 Routes Summary by Cost per Student to identify high-spend, low-compliance routes.
- Assess Vehicle Safety Readiness: Compare Medical Emergency Response Time with Wheelchair Securement Compliance to evaluate vehicle-level safety preparedness.
Benefits of a Special Education Student Transportation Dashboard
The following are the benefits of using this dashboard:
- Centralize Transportation Data: Bring ride-time, staffing, and safety compliance metrics into one special education transportation dashboard.
- Reduce Manual Reconciliation: Consolidate vendor reports, staffing rosters, and incident logs to reduce administrative effort.
- Monitor Wheelchair Securement: Track wheelchair securement compliance by school to identify safety gaps before audits.
- Flag Staffing Gaps: Identify unstaffed or under-covered routes before they become IEP compliance issues.
- Support Transportation Budgeting: Compare cost per student with compliance outcomes to inform budget decisions.
- Improve Accountability: Use prior-period comparisons to track changes across core transportation metrics.
- Maintain Compliance Records: Give district leaders a documented compliance record for parents, auditors, and school boards.
KPIs to Track in a Special Education Student Transportation Dashboard
Key Performance Indicators (KPIs) are the measurable values that show whether a program is meeting its goals — in this dashboard, they measure special education transportation safety, staffing, and compliance performance.
- IEP Ride-Time Compliance Rate (%): the central measure behind this IEP ride-time compliance rate tracking tool, showing the share of student rides completed within the ride time specified in each student's IEP.
- Bus Aide/Nurse Coverage Rate (%): tracks how many required routes have an assigned aide or nurse on board, the core metric behind this bus aide nurse coverage rate monitoring dashboard.
- On-Time Performance (%): measures the percentage of routes arriving within the scheduled pickup and drop-off window.
- Wheelchair Securement Compliance Rate (%): a wheelchair securement compliance tracking for schools metric confirming mobility equipment was properly secured on every applicable ride.
- Medical Emergency Response Time (minutes): the average time to respond to a medical incident on a route, central to this medical emergency response time analysis dashboard.
Frequently Asked Questions
1. What does the Special Education Student Transportation Dashboard track?
This special education student transportation dashboard tracks IEP ride-time compliance, bus aide and nurse coverage, on-time performance, wheelchair securement compliance, and medical emergency response across every route. It also breaks down cost per student and route type so districts can view compliance and spend together.
2. How does the dashboard support student safety during medical emergencies?
As a medical emergency response time analysis dashboard, it tracks how quickly staff respond to medical incidents on each route alongside wheelchair securement and aide coverage. Districts can use this view to identify routes where response times are slipping and act before an incident becomes a safety issue.
3. Can this dashboard help control transportation costs?
Yes. Used as a cost per student transportation tracking tool, it lets districts compare route-level spend against compliance and staffing outcomes, so budget decisions do not come at the expense of safety. It also helps flag high-cost, low-compliance routes for review.