
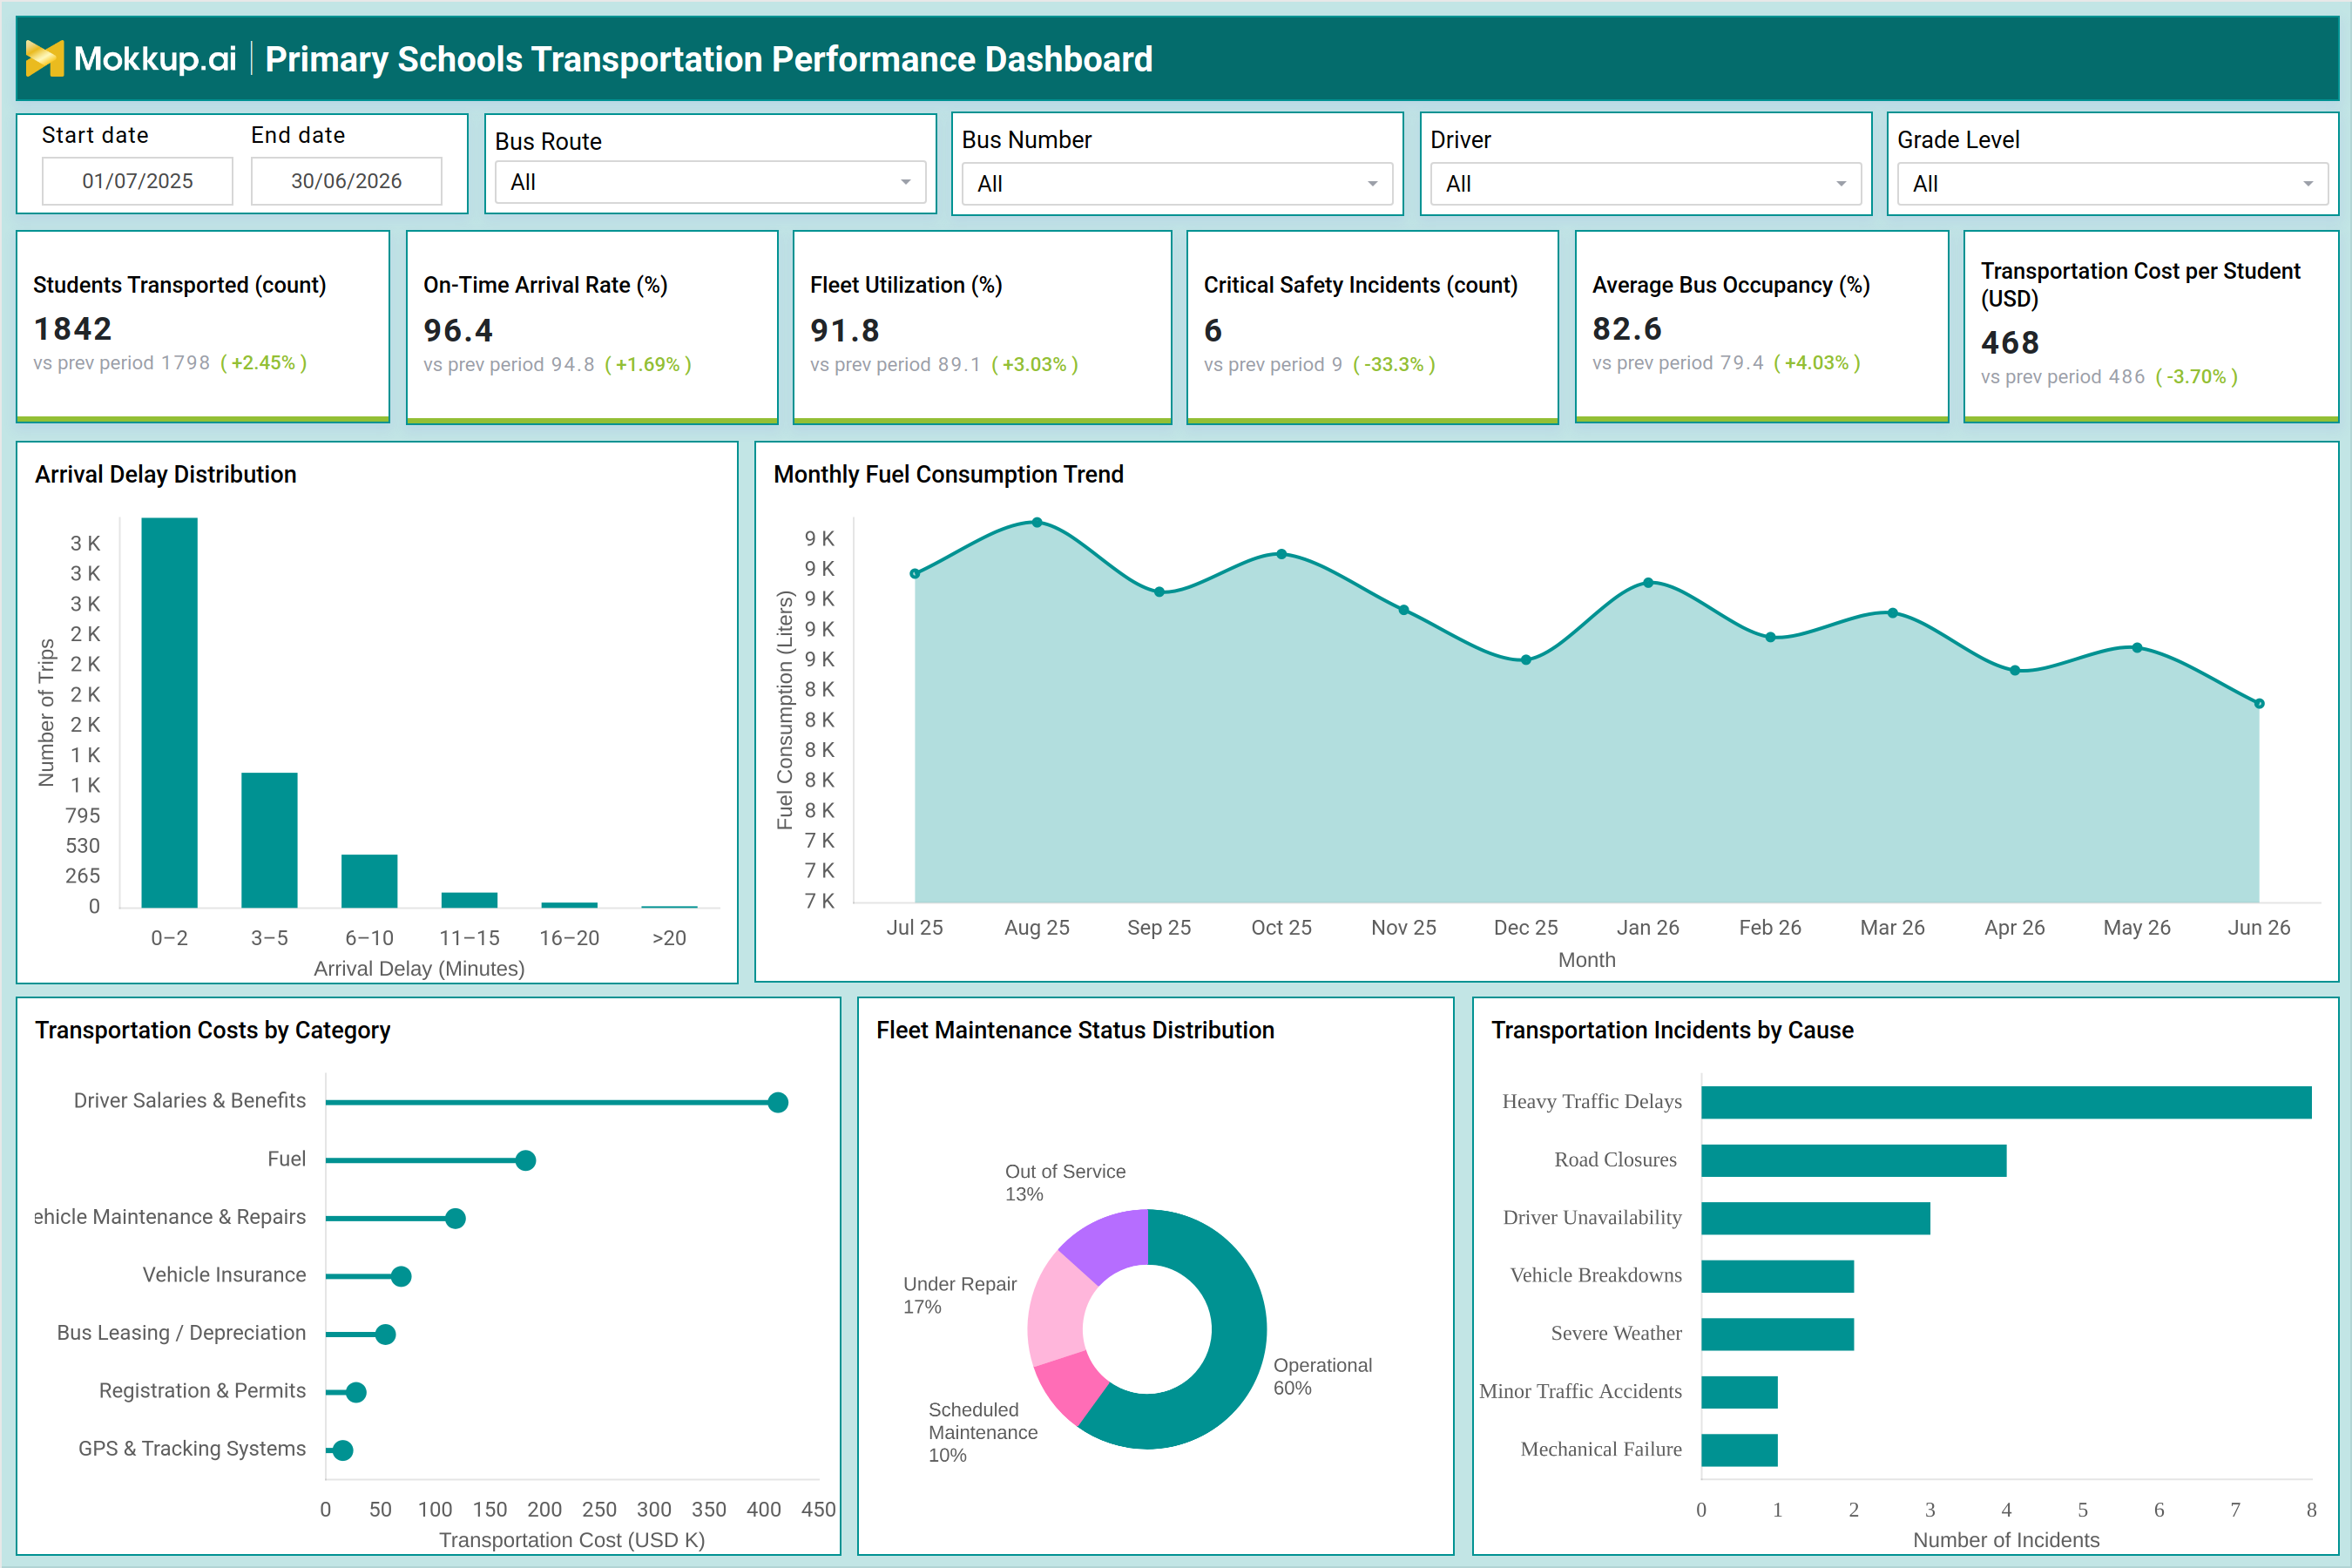
What is a Primary Schools Transportation Performance Dashboard
The Primary Schools Transportation Performance Dashboard is a dashboard template built for school transport administrators and fleet coordinators who need a single view of how student buses perform across routes, drivers, and grade levels. It brings ridership, punctuality, cost, and safety data together in one place, supporting school bus transportation performance tracking without pulling separate reports from route sheets, maintenance logs, and finance spreadsheets.
Filters for bus route, bus number, driver, and grade level, along with a start and end date selector, let administrators narrow the view to a specific segment of the fleet or a defined reporting period. Because the dashboard is built for primary school fleet utilization monitoring, it surfaces how many buses are actively deployed against total fleet capacity, alongside arrival punctuality and occupancy patterns. Transportation directors, safety officers, and finance teams can all rely on the same dashboard template to answer different questions without switching tools.
How to Create a Primary Schools Transportation Performance Dashboard
You don't need to build your report from scratch, just start with a ready-to-use dashboard template from Mokkup. Add in your data and export it however you like. Here's how to do it:
1. Create or Log in to Your Mokkup Account
Start by signing up on Mokkup.ai using your email. If you already have an account, just log in, and you'll be good to go.
2. Choose and Customize Your Dashboard Template
Find the Primary Schools Transportation Performance Dashboard template in the Templates section. Use the drag-and-drop editor to adjust KPIs, edit filters, or add elements based on your data.
3. Export to Your BI Tool
Once your dashboard wireframe is ready, use the BI Tool Export feature to send it directly to Power BI or Tableau for further analysis and enhancements. You can also download the dashboard as a PDF, PNG, or JPEG, embed it on a platform, or invite your team to collaborate.
Note: This is a Pro template. You'll need a Pro subscription on Mokkup to use and customize this dashboard wireframe. Upgrade anytime to unlock full access.
Primary Schools Transportation Performance Dashboard Example
A transportation director typically opens this dashboard at the start of a term or right after a service disruption to understand how the fleet performed against the prior period. Before making any staffing or budget decisions, they want to know whether punctuality is holding steady, whether the fleet is being used efficiently, and whether safety incidents are trending in the wrong direction. Selecting a specific bus route or driver narrows the view immediately, letting the director isolate a problem area instead of scanning the entire fleet. From this view, coordinators can identify which routes are consistently arriving late and investigate whether the delay traces back to traffic patterns, road closures, or driver unavailability. Fleet planners can compare bus occupancy against utilization to determine whether routes need to be consolidated or whether additional buses should be added during peak grade-level demand.
Finance teams can track how spend is distributed across driver salaries, fuel, maintenance, and insurance, then weigh that against the cost incurred per student. When safety incidents spike, administrators can trace the underlying cause and decide whether the response calls for driver retraining, route rescheduling, or fleet maintenance. The overall outcome is a transportation program that is easier to manage ahead of problems instead of after them. Rather than waiting for a parent complaint or a budget overrun to reveal an issue, administrators can catch a slipping arrival rate, a rising incident count, or an aging fleet segment early enough to act. That shift, from reviewing transportation performance after the fact to monitoring it consistently through the term, is what makes this dashboard valuable to school transportation teams.
How to Analyze Data in a Primary Schools Transportation Performance Dashboard
Here is how you can analyze data from this dashboard:
- Analyze route performance: Filter by bus route and bus number to evaluate a specific vehicle or transportation route.
- Compare driver performance: Use the driver filter to assess punctuality and safety incident history across drivers.
- Compare reporting periods: Adjust the date range to evaluate performance over a full term against the previous reporting period.
- Monitor arrival delays: Review the Arrival Delay Distribution chart to understand how frequently trips are delayed.
- Track fuel efficiency: Cross-reference the Monthly Fuel Consumption Trend with fleet utilization to identify unusual fuel costs.
- Analyze occupancy by grade: Segment data by grade level to determine how transportation demand varies across student age groups.
- Monitor on-time performance: Track school bus on-time arrival rates to identify routes that consistently miss punctuality targets.
- Investigate safety incidents: Connect transportation safety incidents with specific routes or drivers to identify recurring issues.
Benefits of a Primary Schools Transportation Performance Dashboard
The following are the benefits of using this dashboard:
- Centralize transportation data: Combine route, driver, and cost metrics into a single school transportation dashboard.
- Simplify cost analysis: Monitor student transportation costs without exporting data to spreadsheets.
- Improve safety monitoring: Track transportation safety incidents to identify issues early and enable faster corrective action.
- Optimize fleet utilization: Identify buses and routes that are operating below or above capacity.
- Support budget planning: Use cost-per-student metrics to justify transportation budget requests.
- Reduce reporting effort: Eliminate manual report preparation for school boards and district leadership.
- Align stakeholder decisions: Provide drivers, operations teams, and finance staff with a shared view of transportation performance.
KPIs to Track in a Primary Schools Transportation Performance Dashboard
The following key KPIs can be tracked by using this School transportation safety incident tracking dashboard:
- Students Transported (count) - the total number of students carried across all routes in the selected period, indicating overall ridership volume.
- On-Time Arrival Rate (%) - the share of trips arriving within the scheduled window, supporting school bus on-time arrival rate monitoring term over term.
- Fleet Utilization (%) - how much of the available fleet capacity is actively deployed against total fleet size.
- Critical Safety Incidents (count) - the number of serious safety events during transport, a direct signal of how safely the fleet is operating.
- Average Bus Occupancy (%) - how full buses are running relative to capacity, useful for route consolidation decisions.
- Transportation Cost per Student (USD) - total transportation spend divided by students transported, the core figure for student transportation cost management analysis.
Frequently Asked Questions
1. What does the Primary Schools Transportation Performance Dashboard track?
It tracks ridership, punctuality, fleet utilization, safety incidents, occupancy, and cost per student in one dashboard template, supporting school bus transportation performance tracking across every route and grade level. Filters for route, bus number, driver, and grade level narrow the view to any fleet segment.
2. How does the dashboard help with fleet utilization?
It supports primary school fleet utilization monitoring by comparing active fleet deployment against total capacity alongside occupancy trends. This helps administrators decide when to consolidate routes or add buses during peak demand.
3. Is this dashboard suitable for tracking bus maintenance schedules?
Yes, the Fleet Maintenance Status Distribution chart supports fleet maintenance status tracking for schools by showing how many buses are operational, under repair, in scheduled maintenance, or out of service. This helps administrators plan repairs before a bus is pulled from an active route.