
What is a Special Education Student Support Management Dashboard
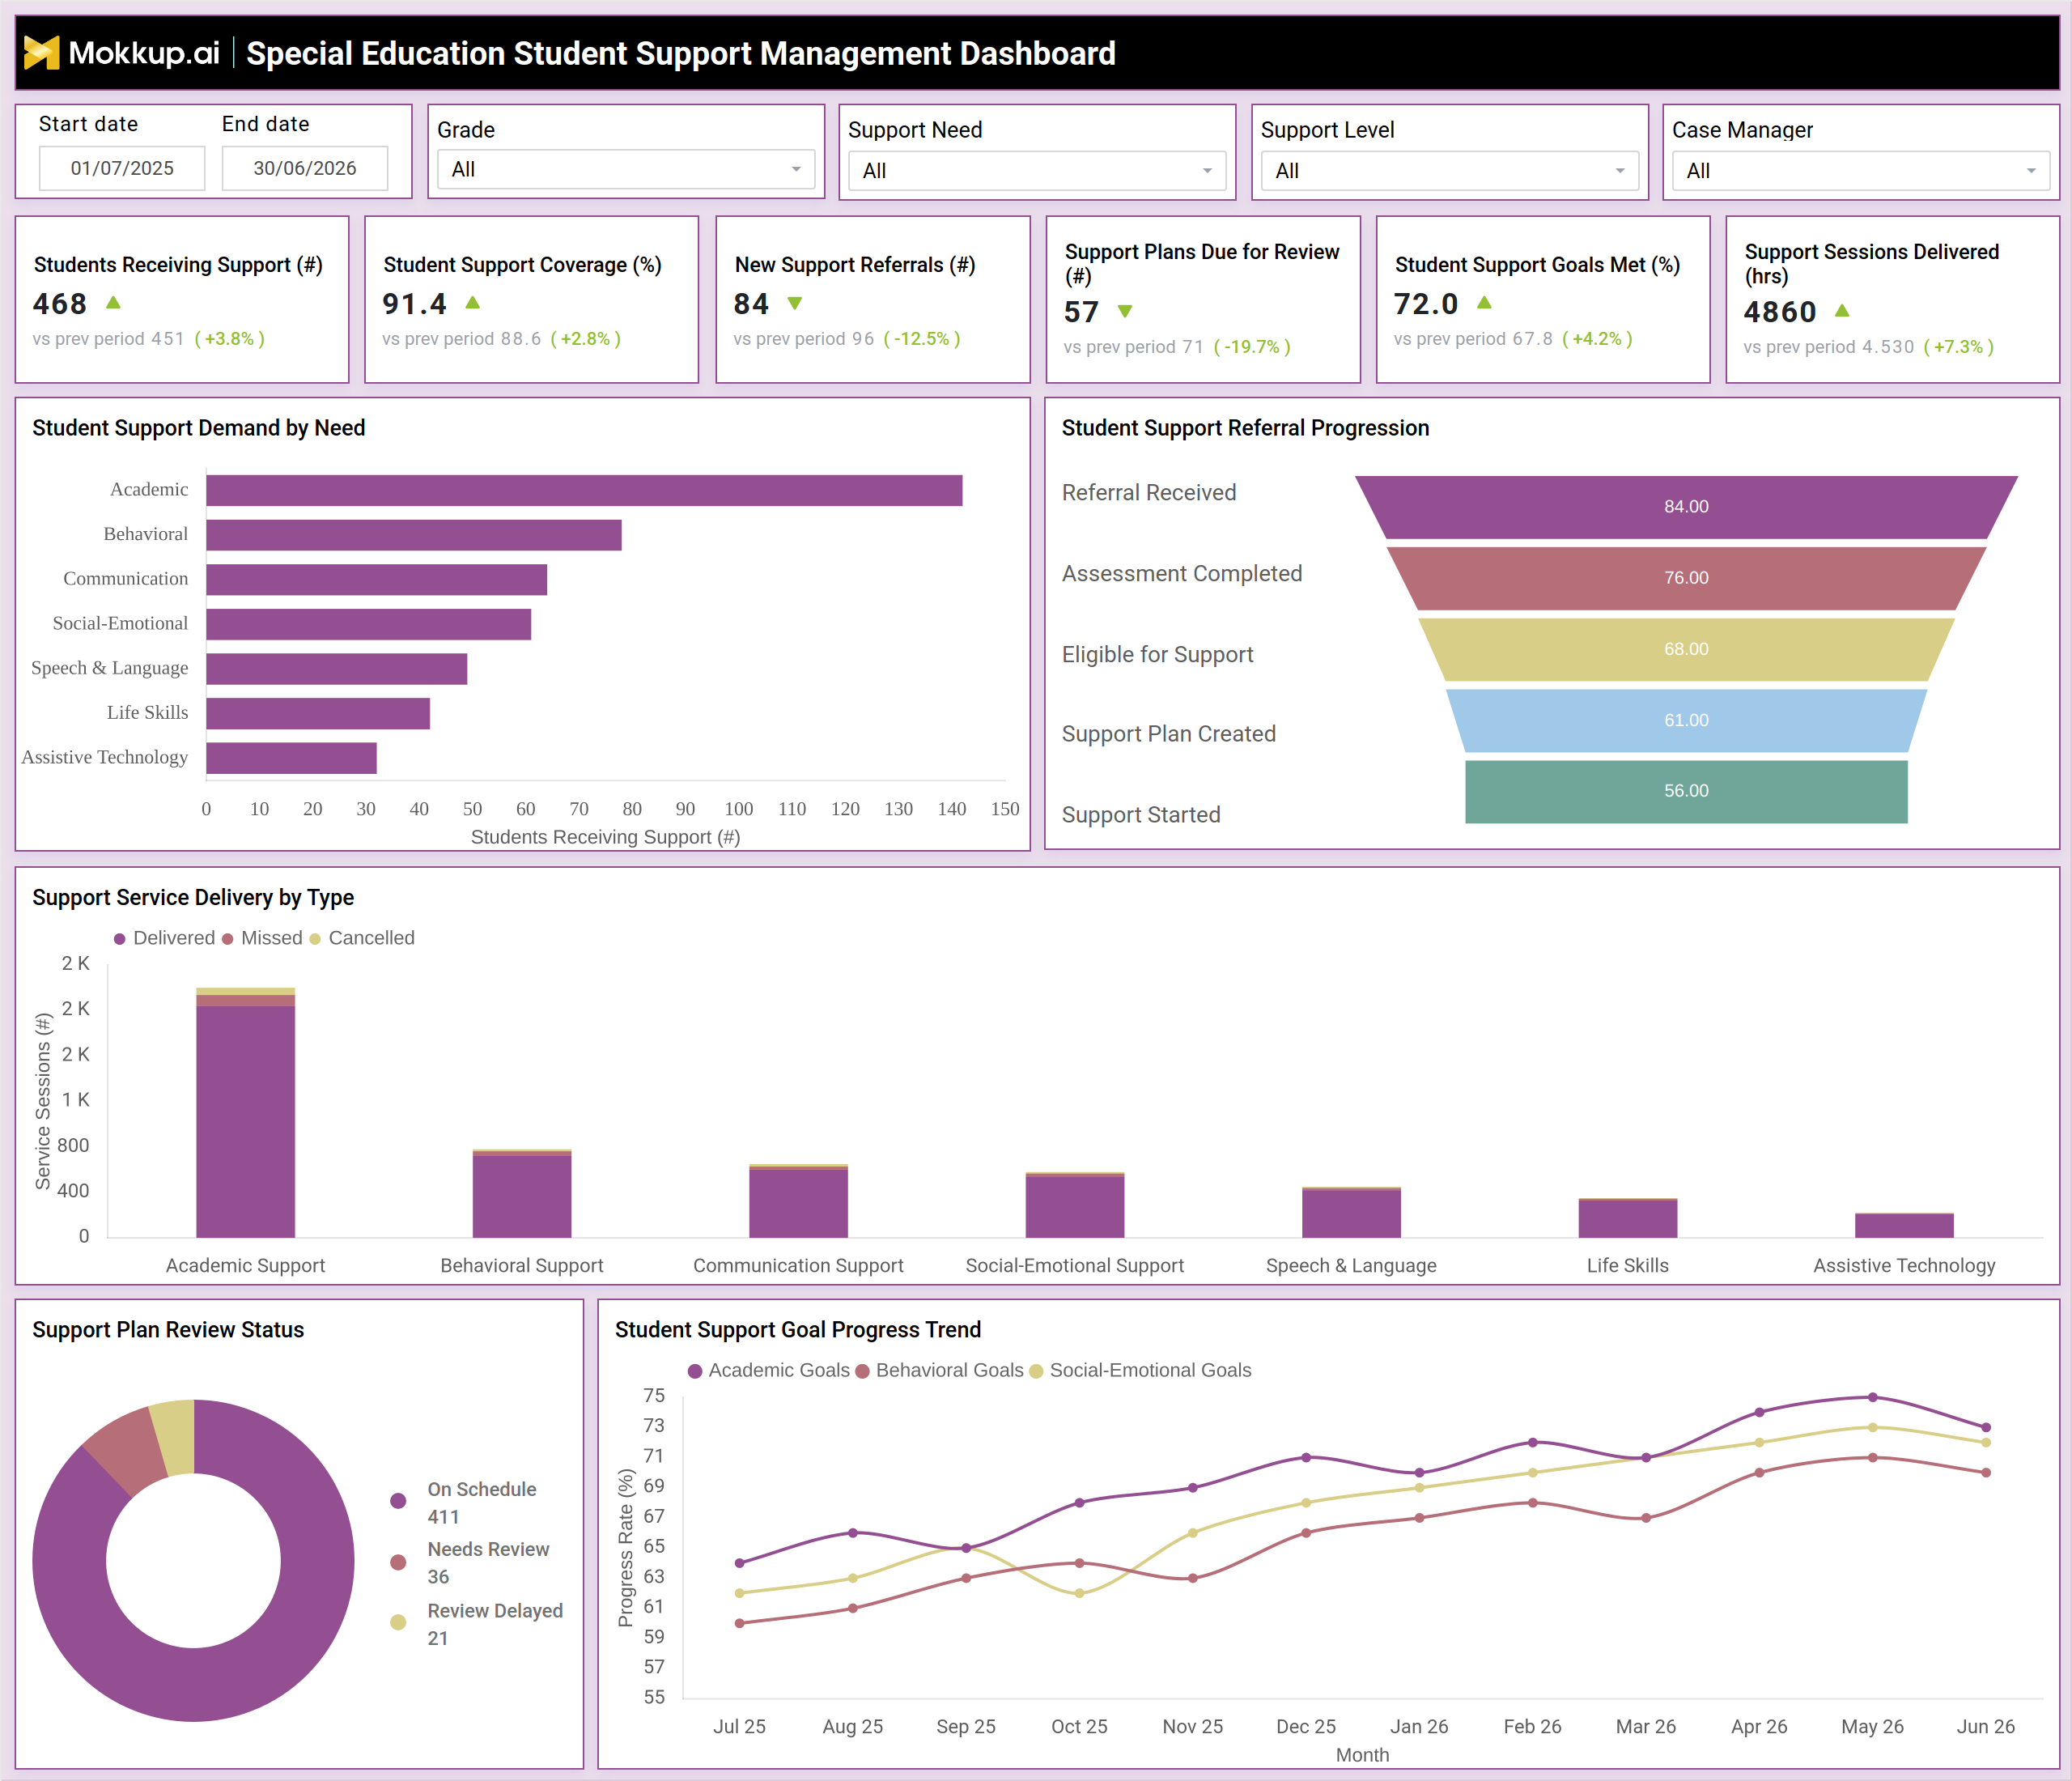
The Special Education Student Support Management Dashboard is a case management dashboard template built for special education coordinators, service providers, and school administrators who need one place to track how students move from referral to active support. It brings together caseload size, coverage, and goal progress so schools can see whether support plans and progress reviews are keeping pace with demand. Instead of piecing information together from separate spreadsheets, teams get a single view built around special education student support tracking, from the number of students currently receiving services to how many new referrals are still waiting on an eligibility decision. The dashboard also flags support plans approaching their review date, and it supports special education case management dashboard reporting across grades, support needs, support levels, and case managers.
How to Create a Special Education Student Support Management Dashboard
You don't need to build your report from scratch—just start with a ready-to-use dashboard template from Mokkup. Add in your data and export it however you like. Here's how to do it:
1. Create or Log in to Your Mokkup Account
Start by signing up on Mokkup.ai using your email. If you already have an account, just log in, and you'll be good to go.
2. Choose and Customize Your Dashboard Template
Find the Special Education Student Support Management Dashboard template in the Templates section. Use the drag-and-drop editor to adjust KPIs, edit filters, or add elements based on your data.
3. Export to Your BI Tool
Once your dashboard wireframe is ready, use the BI Tool Export feature to send it directly to Power BI or Tableau for further analysis and enhancements. You can also download the dashboard as a PDF, PNG, or JPEG, embed it on a platform, or invite your team to collaborate.
Note: This is a Pro template. You'll need a Pro subscription on Mokkup to use and customize this dashboard wireframe. Upgrade anytime to unlock full access.
Special Education Student Support Management Dashboard Example
A special education coordinator opens this dashboard at the start of a review cycle to understand where the caseload stands and whether service capacity matches demand. Filtering by grade, support need, support level, or case manager narrows the view down to a specific caseload segment before digging into trends. From the top-level view, the coordinator checks whether support coverage is keeping pace with the number of identified students and whether new referrals are being processed fast enough to avoid a backlog.
By following how referrals move from being received through assessment, eligibility determination, plan creation, and support start, the team can identify where delays are building up in the intake pipeline. This view of student support referral progression tracking lets managers prioritize the stage losing the most students before the bottleneck grows. Case managers use the same view to compare how sessions are being delivered against how many are missed or cancelled across support categories, applying special education service delivery monitoring to decide whether staffing or scheduling adjustments are needed in a specific service line. Tracking academic, behavioral, and social-emotional goal progress side by side over the school year lets teams spot which goal domain is falling behind and step in with additional support before an annual review.
Together, these views help special education teams keep every student's support plan current, resolve referral bottlenecks earlier, and show administrators and families that services are delivered as planned through consistent special education student support tracking.
How to Analyze Data in a Special Education Student Support Management Dashboard
Here is how you can analyze data from this dashboard:
- Filter by Grade / Support Need / Support Level / Case Manager: Focus on a specific student segment or support group.
- Compare Support Coverage vs. Demand: Assess whether available support services are keeping pace with the number of students receiving support.
- Track New Support Referrals: Compare referral volumes with the prior period to identify rising or declining demand early.
- Monitor Referral Progression: Follow the referral funnel to identify where students are dropping off and address delays before they create backlogs.
- Analyze Support Demand by Need: Identify the highest-demand support categories to prioritize staffing and resources.
- Monitor Service Delivery: Compare delivered, missed, and cancelled sessions by support type to evaluate service consistency.
- Track Support Plan Reviews: Review plan statuses to identify plans approaching or missing scheduled review deadlines.
- Monitor Goal Progress by Domain: Track student progress across different goal areas ahead of the next support plan review.
Benefits of a Special Education Student Support Management Dashboard
The following are the benefits of using this dashboard:
- Centralizes Student Support Data: Brings referrals, active support, and goal progress into one special education student support view.
- Reduces Manual Case Review: Uses an intake pipeline to highlight referral bottlenecks and simplify case tracking.
- Improves Support Plan Accountability: Provides clear visibility into support plan review status across the caseload.
- Supports Case Management: Gives coordinators a structured special education case management dashboard for managing large caseloads.
- Balances Service Workloads: Compares delivered, missed, and cancelled sessions to help service teams manage capacity.
- Tracks Goal Progress: Makes academic, behavioral, and social-emotional progress easier to monitor and report.
- Speeds Up Decision-Making: Provides filters for grade, support need, support level, and case manager to quickly isolate relevant cases.
KPIs to Track in a Special Education Student Support Management Dashboard
The following key KPIs can be tracked by using this dashboard:
- Students Receiving Support (#): the total number of students currently enrolled in a support plan.
- Student Support Coverage (%): the share of identified students actively receiving services against total eligible students.
- New Support Referrals (#): the count of new referrals submitted for evaluation and support in the selected period.
- Support Plans Due for Review (#): how many individualized support plans are approaching their scheduled review date.
- Student Support Goals Met (%): the proportion of set goals students have successfully achieved.
- Support Sessions Delivered (hrs): the total hours of support services provided across all service types.
Frequently Asked Questions
1. What is a Special Education Student Support Management Dashboard used for?
It is used to track how students move from referral to active special education support, including caseload size, coverage, referral volume, and goal progress. Coordinators and case managers use it to catch referral delays and stay ahead of upcoming plan deadlines.
2. How does this dashboard help with support plan reviews?
The support plan review status view separates plans that are on schedule from those needing review or delayed, supporting IEP support plan review tracking across the full caseload. This keeps required reviews from being missed.
3. Who should use this dashboard?
Special education coordinators, case managers, and school administrators responsible for caseload oversight and reporting are the primary users. Service providers also use it to track their own session delivery and student goal outcomes.