What Is an AI Adoption in Customer Case Resolution Dashboard?
An AI Adoption in Customer Case Resolution Dashboard is a centralized analytics tool that tracks how artificial intelligence improves the efficiency of customer support. It provides visibility into AI-driven case handling, resolution rates, cost savings, and operational performance. By integrating AI-powered automation, businesses monitor key metrics like AI-assisted queries, autonomous resolutions, success rates, and token utilization efficiency to optimize support workflows. This dashboard helps support teams identify bottlenecks, measure AI effectiveness, and balance automation with human intervention. It consolidates data from chatbots, ticketing systems, and NLP models to ensure faster, more accurate case resolutions while reducing manual workload.
How to Create an AI Adoption in the Customer Case Resolution Dashboard
You don't need to build your report from scratch, just start with a ready-to-use dashboard template from Mokkup. Add in your data and export it however you like. Here's how to do it:
1. Create or Log in to Your Mokkup Account
Start by signing up on Mokkup.ai using your email. If you already have an account, just log in, and you'll be good to go.
2. Choose and Customize Your Dashboard Template
Find the AI Adoption in Customer Case Resolution Dashboard template in the Templates section. Use the drag-and-drop editor to adjust KPIs, edit filters, or add elements based on your data.
3. Export to Your BI Tool
Once your dashboard wireframe is ready, use the BI Tool Export feature to send it directly to Power BI or Tableau for further analysis and enhancements. You can also download the dashboard as a PDF, PNG, or JPEG, embed it on a platform, or invite your team to collaborate.
Note: This is a Pro template. You'll need a Pro subscription on Mokkup to use and customize this dashboard wireframe. Upgrade anytime to unlock full access.
AI Adoption in Customer Case Resolution Dashboard Example
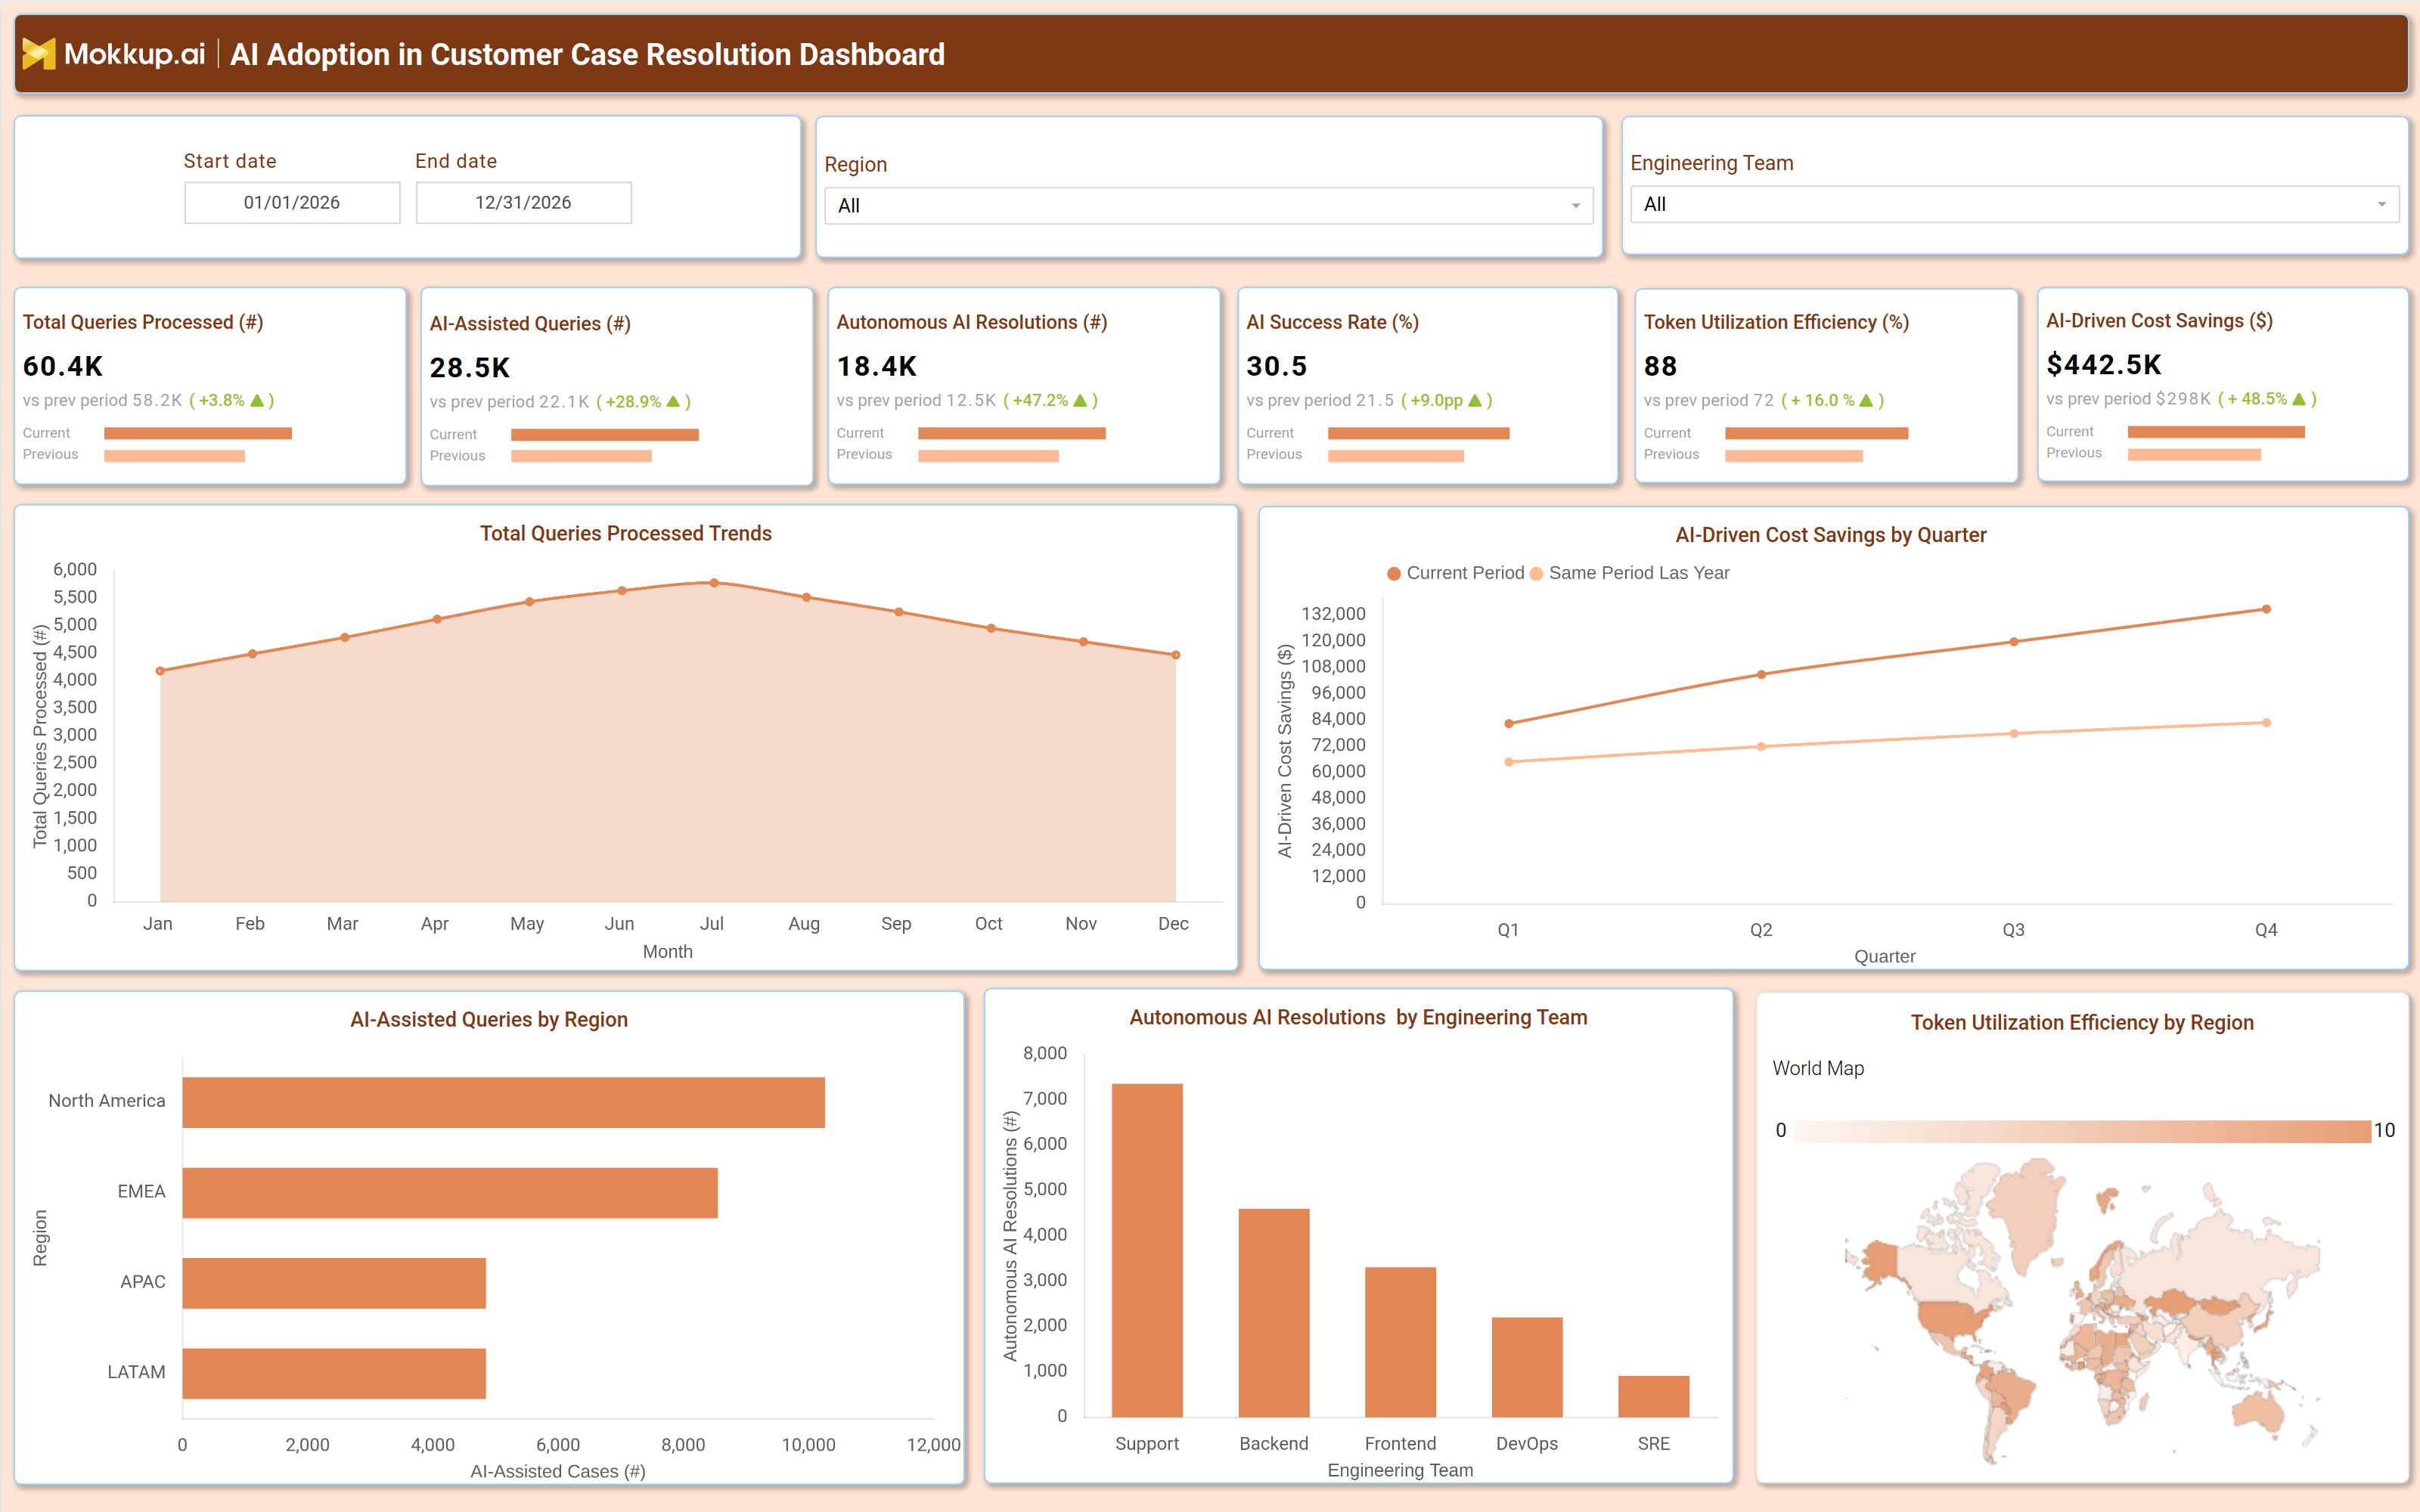
A typical AI adoption dashboard for customer case resolution includes interactive filters for date range, region, and engineering team (Support, Backend, Frontend, DevOps, SRE). Key performance tiles display metrics such as total cases resolved, AI-assisted cases, engineering tool adoption rate, and AI-driven cost savings. Trend charts show total cases resolved by month (Jan–Dec), with breakdowns by engineering team, helping managers track resolution volume and team workload distribution. A bar chart compares AI-assisted cases by region (North America, EMEA, APAC, LATAM, Central) to identify areas where AI adoption is strongest. A line chart tracks AI-driven cost savings by quarter (Q1–Q4), demonstrating the financial impact of AI automation. Engineering tool adoption is displayed as a KPI with a trend arrow, showing improvement over the previous period. Together, these components form a customer support AI adoption dashboard that enables teams to measure AI effectiveness, optimize resource allocation, and scale support operations efficiently.
How to Analyze Data in an AI Adoption in Customer Case Resolution Dashboard
Here is how you can analyze data from this dashboard:
- Review Total Queries Processed: Assess overall support volume trends to understand workload patterns and customer service demand.
- Compare AI-Assisted vs. Autonomous Resolutions: Measure the effectiveness of automation by analyzing the balance between AI-assisted and fully autonomous issue resolutions.
- Track AI Success Rates: Monitor AI accuracy and resolution success rates to evaluate performance and improve customer satisfaction.
- Monitor Token Utilization Efficiency: Analyze token consumption patterns to optimize AI model efficiency and control operational costs.
- Analyze AI-Driven Cost Savings: Evaluate cost reductions achieved through AI automation to measure ROI and justify AI investments.
- Break Down Performance by Region: Compare regional performance metrics to identify geographic strengths, weaknesses, and optimization opportunities.
- Evaluate Engineering Team Contributions: Assess the engineering team's impact on AI implementation and deployment success to improve operational strategies.
- Compare Current vs. Previous Periods: Benchmark current AI support performance against historical data to identify improvements, declines, or emerging trends.
Benefits of an AI Adoption in Customer Case Resolution Dashboard
The following are the benefits of using this AI-driven cost savings dashboard:
- Enables Faster Case Resolution: Accelerates issue resolution through AI-driven automation and intelligent support workflows.
- Reduces Manual Workload: Minimizes repetitive tasks by automating routine queries and support interactions.
- Improves Customer Satisfaction: Delivers quicker and more consistent responses to enhance overall customer experience.
- Drives Cost Savings: Optimizes AI token usage and operational efficiency to reduce support-related costs.
- Supports Data-Driven Decision-Making: Provides actionable insights to refine customer support strategies and improve service performance.
- Scales Support Operations Efficiently: Expands support capabilities without requiring proportional increases in hiring or operational resources.
- Optimizes Resource Allocation: Identifies high-impact AI use cases to focus resources on the most valuable automation opportunities.
- Enhances Performance Tracking: Uses real-time analytics and monitoring to improve visibility into support operations and AI effectiveness.
KPIs to Track in an AI Adoption in Customer Case Resolution Dashboard
The following key KPIs can be tracked by using this token utilization efficiency dashboard:
- Total Queries Processed (count): Measures overall support volume.
- AI Assisted Queries (count): Tracks cases where AI provided partial assistance.
- Autonomous AI Resolutions (count): Counts fully AI-resolved cases.
- AI Success Rate (%): Percentage of successful AI-driven resolutions.
- Token Utilization Efficiency (%): Evaluates AI model performance.
- AI Driven Cost Savings ($): Financial impact of AI automation.
Frequently Asked Questions
1. How does an AI success rate monitoring dashboard improve customer support?
It automates repetitive queries, reduces resolution time, and provides data-driven insights for better decision-making.
2. What data sources feed a customer support AI adoption dashboard?
Ticketing systems, chatbots, NLP models, and customer interaction logs.
3. Who should use an AI case resolution dashboard?
Customer support managers, AI operations teams, and business leaders optimizing support workflows.