
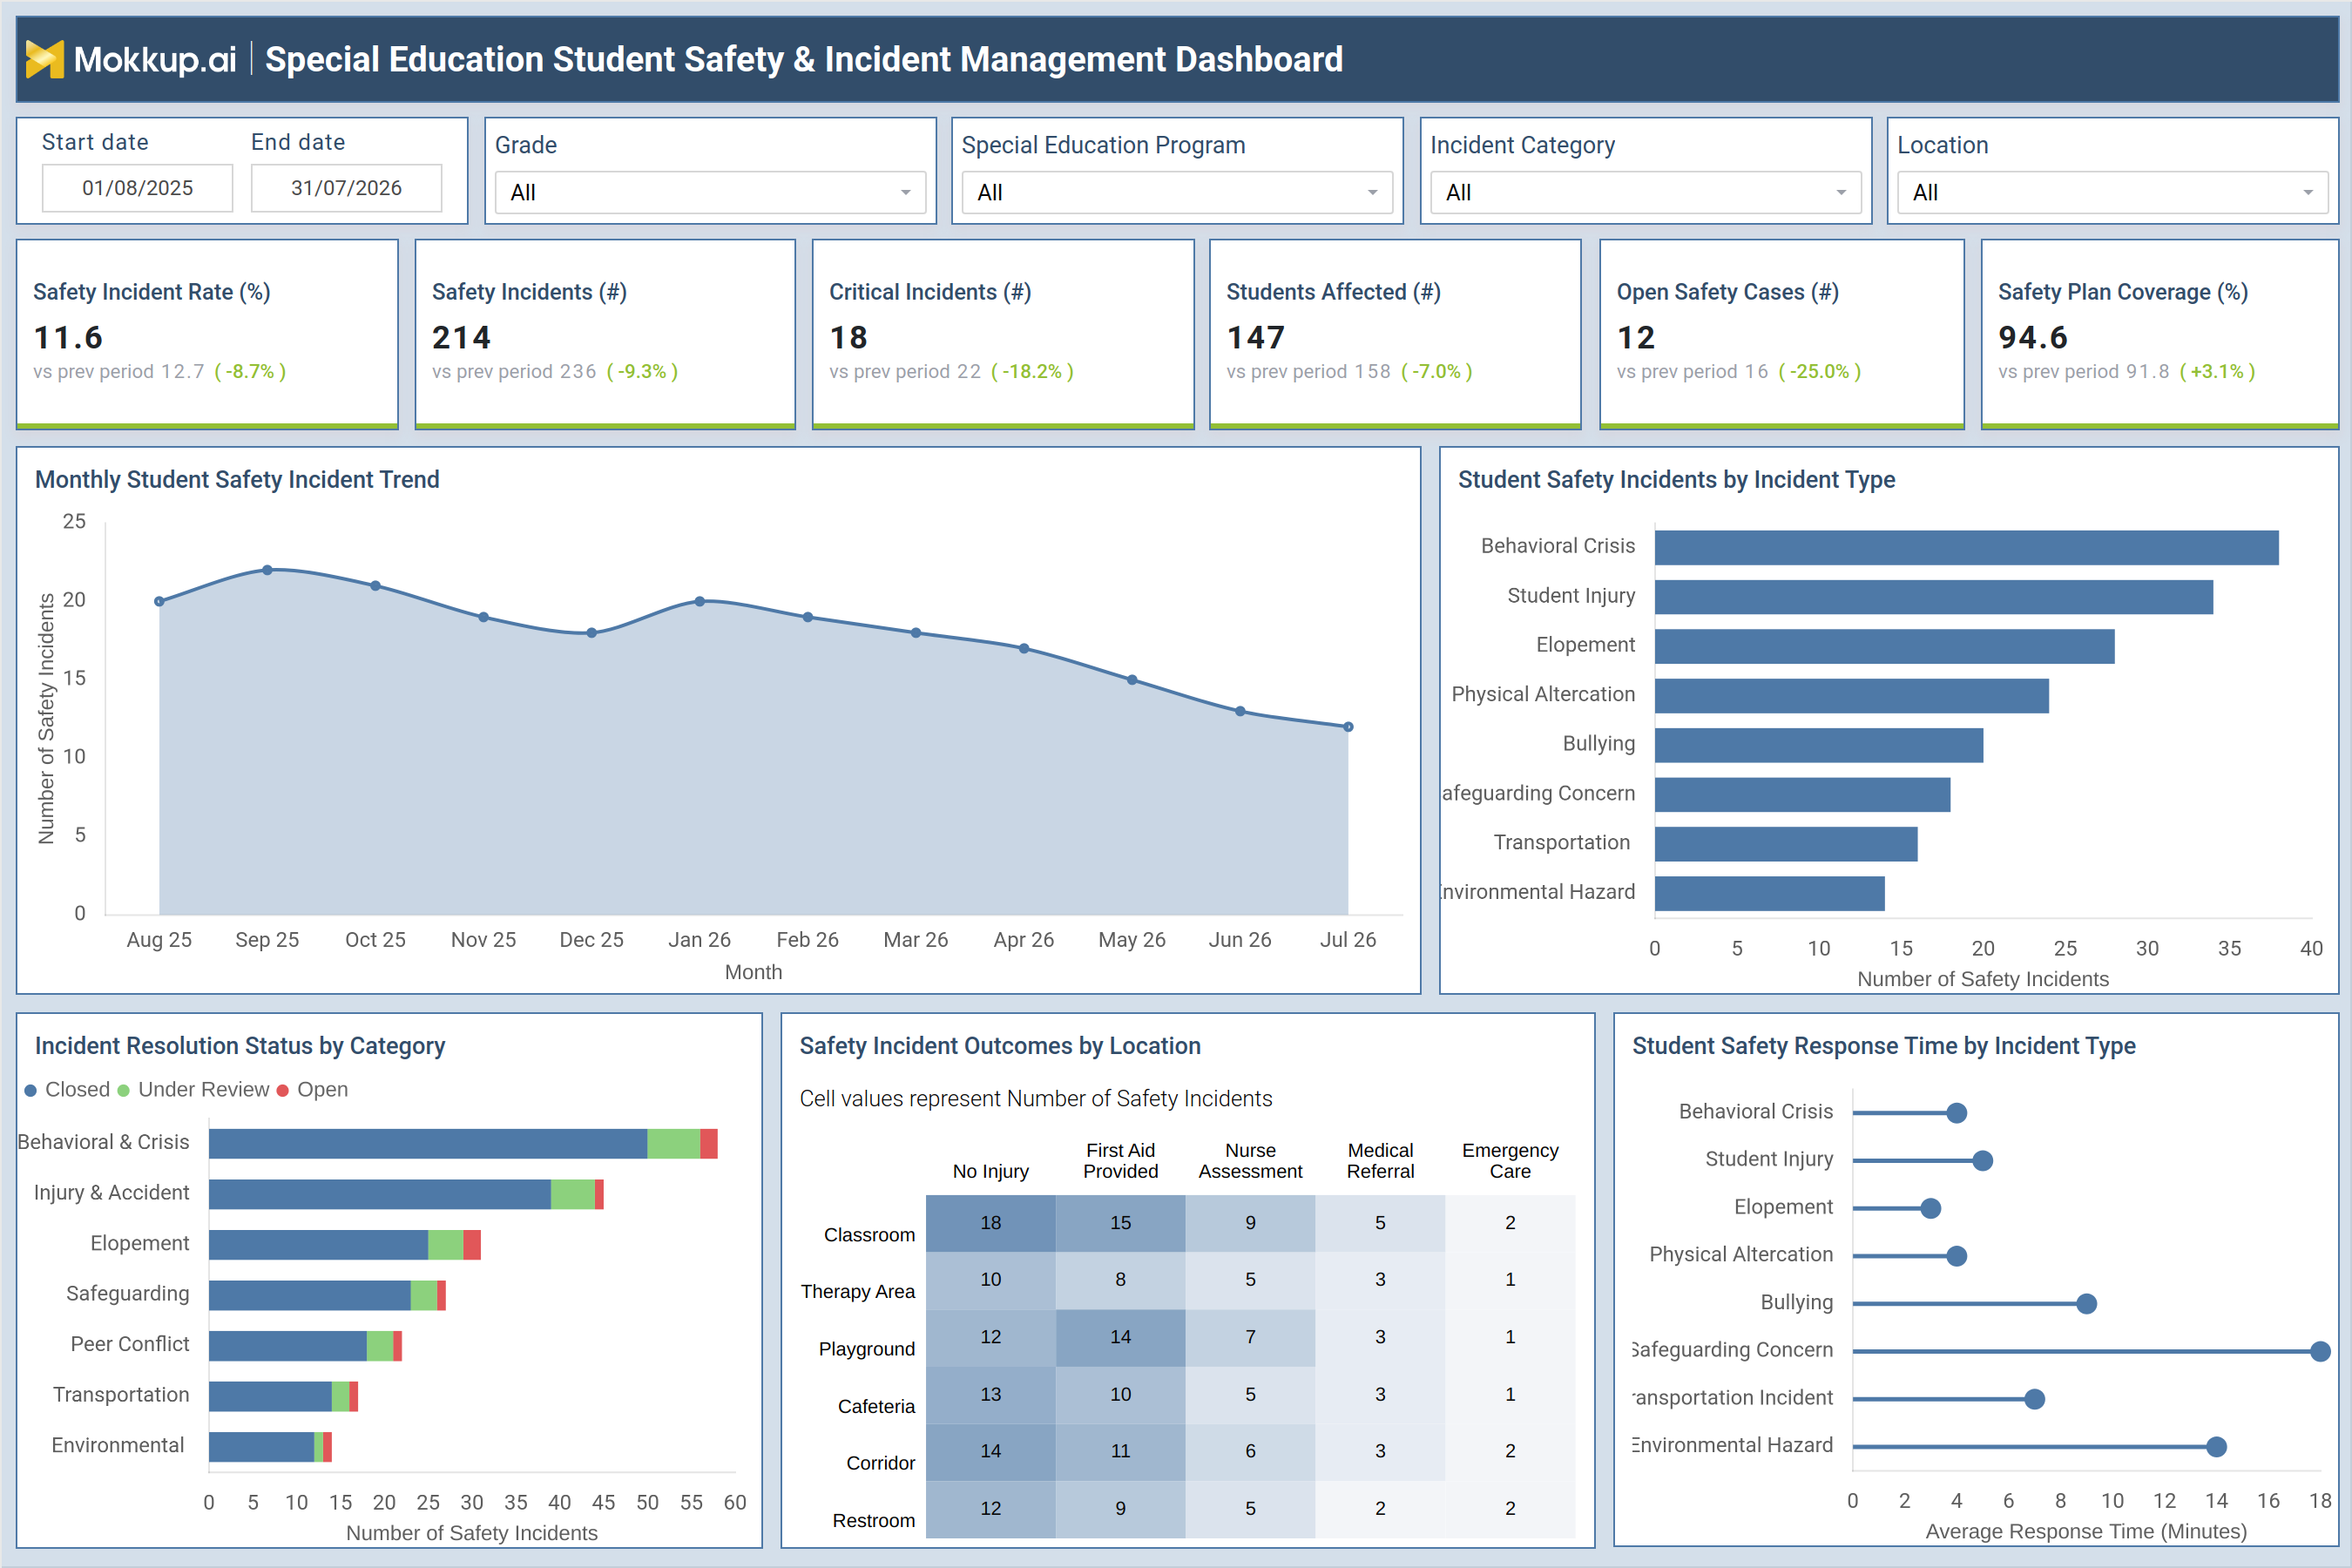
What is a Special Education Student Safety & Incident Management Dashboard?
The Special Education Student Safety & Incident Management Dashboard is a reporting template built for special education coordinators, school safety officers, and administrators who need special education student safety tracking across classrooms, therapy areas, and transportation routes. It consolidates incident volume, severity, and response outcomes into one view, filtered by grade, special education program, incident category, and location, so teams can see where risk is concentrated without pulling data from multiple case files. As a school incident management dashboard template, it brings safety incident rates, critical incident counts, and safety plan coverage together so administrators can compare current performance against the prior reporting period. Built for teams managing individualized education plans and behavioral support programs, it turns scattered incident logs into a single, structured view of student safety across a defined date range.
How to Create a Special Education Student Safety & Incident Management Dashboard
You don't need to build your report from scratch—just start with a ready-to-use dashboard template from Mokkup. Add in your data and export it however you like. Here's how to do it:
1. Create or Log in to Your Mokkup Account
Start by signing up on Mokkup.ai using your email. If you already have an account, just log in, and you'll be good to go.
2. Choose and Customize Your Dashboard Template
Find the Special Education Student Safety & Incident Management Dashboard template in the Templates section. Use the drag-and-drop editor to adjust KPIs, edit filters, or add elements based on your data.
3. Export to Your BI Tool
Once your dashboard wireframe is ready, use the BI Tool Export feature to send it directly to Power BI or Tableau for further analysis and enhancements. You can also download the dashboard as a PDF, PNG, or JPEG, embed it on a platform, or invite your team to collaborate.
Note: This is a Pro template. You'll need a Pro subscription on Mokkup to use and customize this dashboard wireframe. Upgrade anytime to unlock full access.
Special Education Student Safety & Incident Management Dashboard Example
A special education program coordinator typically opens this dashboard at the start of a review cycle to understand how safety incidents are trending across grades and programs. Before a district safety meeting, the team wants to know whether behavioral crises, elopement events, or safeguarding concerns are rising or easing compared to the previous period, and whether any location or program needs closer attention. The trend view lets coordinators identify whether monthly incident volume is climbing or declining and whether that shift is broad-based or concentrated in a specific incident type such as behavioral crisis or student injury. By comparing incident types side by side, program leads can prioritize which categories, such as bullying or safeguarding concerns, need updated intervention plans or additional staff training.
Special education incident response time tracking becomes part of this same review, since teams can compare how quickly different incident types are being addressed and flag categories where response is lagging. Reviewing resolution status by category helps administrators see which incident types are closing quickly versus accumulating open cases that need escalation, while the location-based outcome view shows whether certain spaces, like playgrounds or corridors, generate more first aid or nurse referrals than others. Together, this student safeguarding incident monitoring view gives special education leadership a clear basis for adjusting staffing, updating safety protocols, and reporting outcomes to district administrators with confidence.
How to Analyze Data in a Special Education Student Safety & Incident Management Dashboard
Here is how you can analyze data from this dashboard:
- Compare Safety Incident Rates: Compare the current incident rate with the prior period to determine whether overall risk is increasing or decreasing.
- Analyze Incident Types: Identify which categories, such as behavioral crises or elopement, contribute the most to incident volume.
- Track Incident Response Time: Compare response times by incident type to identify areas where faster intervention may be needed.
- Compare Critical Incidents vs. Students Affected: Assess the severity and reach of safety events, not just their frequency.
- Monitor Monthly Incident Trends: Review the trend over time to determine whether improvements are sustained or temporary.
- Track Incident Resolution Status: Distinguish incident types with quick resolution from those accumulating open cases.
- Filter by Grade / Program / Location: Isolate safety patterns within a specific classroom, special education program, or campus area.
- Compare Outcomes by Location: Identify areas generating a disproportionately high number of first aid or nurse referrals.
Benefits of a Special Education Student Safety & Incident Management Dashboard
The following are the benefits of using this dashboard:
- Filter Incident Data: Use grade, program, or location filters to analyze incidents without building reports from scratch.
- Centralize Safety Data: Bring special education safety information into one dashboard instead of manually compiling logs from multiple systems.
- Monitor Safeguarding Incidents: Track student safeguarding incidents across programs, grades, and locations from a single filtered view.
- Track Safety Plan Compliance: View safety plan compliance alongside incident volume and response performance.
- Identify Recurring Incidents: Spot repeated incident types early so staff can proactively update behavior support and safety plans.
- Support Safety Reviews: Provide administrators with a shared reference for district safety reviews and compliance reporting.
- Reduce Data Reconciliation: Minimize time spent reconciling incident counts across classrooms, therapy areas, and transportation records.
- Support Staffing & Training Decisions: Use documented incident and response trends to justify staffing or training needs.
KPIs to Track in a Special Education Student Safety & Incident Management Dashboard
The following key KPIs can be tracked by using this dashboard:
- Safety Incident Rate (%): measures the share of enrolled special education students involved in a reported safety incident during the selected period.
- Safety Incidents (#): counts total reported safety events across all categories, grades, and locations.
- Critical Incidents (#): tracks incidents classified as high severity, requiring immediate escalation or medical care.
- Students Affected (#): shows the number of individual students involved in one or more safety incidents.
- Open Safety Cases (#): counts incidents still under review or unresolved, a core input for school incident resolution status tracking.
- Safety Plan Coverage (%): measures the proportion of at-risk students with an active, up-to-date safety plan, supporting special education safety plan compliance tracking.
Frequently Asked Questions
1. What data does the Special Education Student Safety & Incident Management Dashboard track?
It tracks safety incident volume, severity, and response outcomes across grades, special education programs, and locations. This supports special education student safety tracking from the first reported event through resolution, using filters for date range, program, and incident category.
2. How often should this dashboard be reviewed?
Most special education teams review it monthly alongside safety committee meetings, and more frequently if critical incidents or open safety cases are rising. Regular review keeps response times and safety plan coverage aligned with district expectations.
3. Can this dashboard be customized for a specific school or program?
Yes, the Location, Grade, and Special Education Program filters let teams narrow the view to a single campus, classroom type, or program without altering the underlying template. Since it is a Mokkup wireframe, KPIs and charts can also be edited directly in the drag-and-drop editor.