
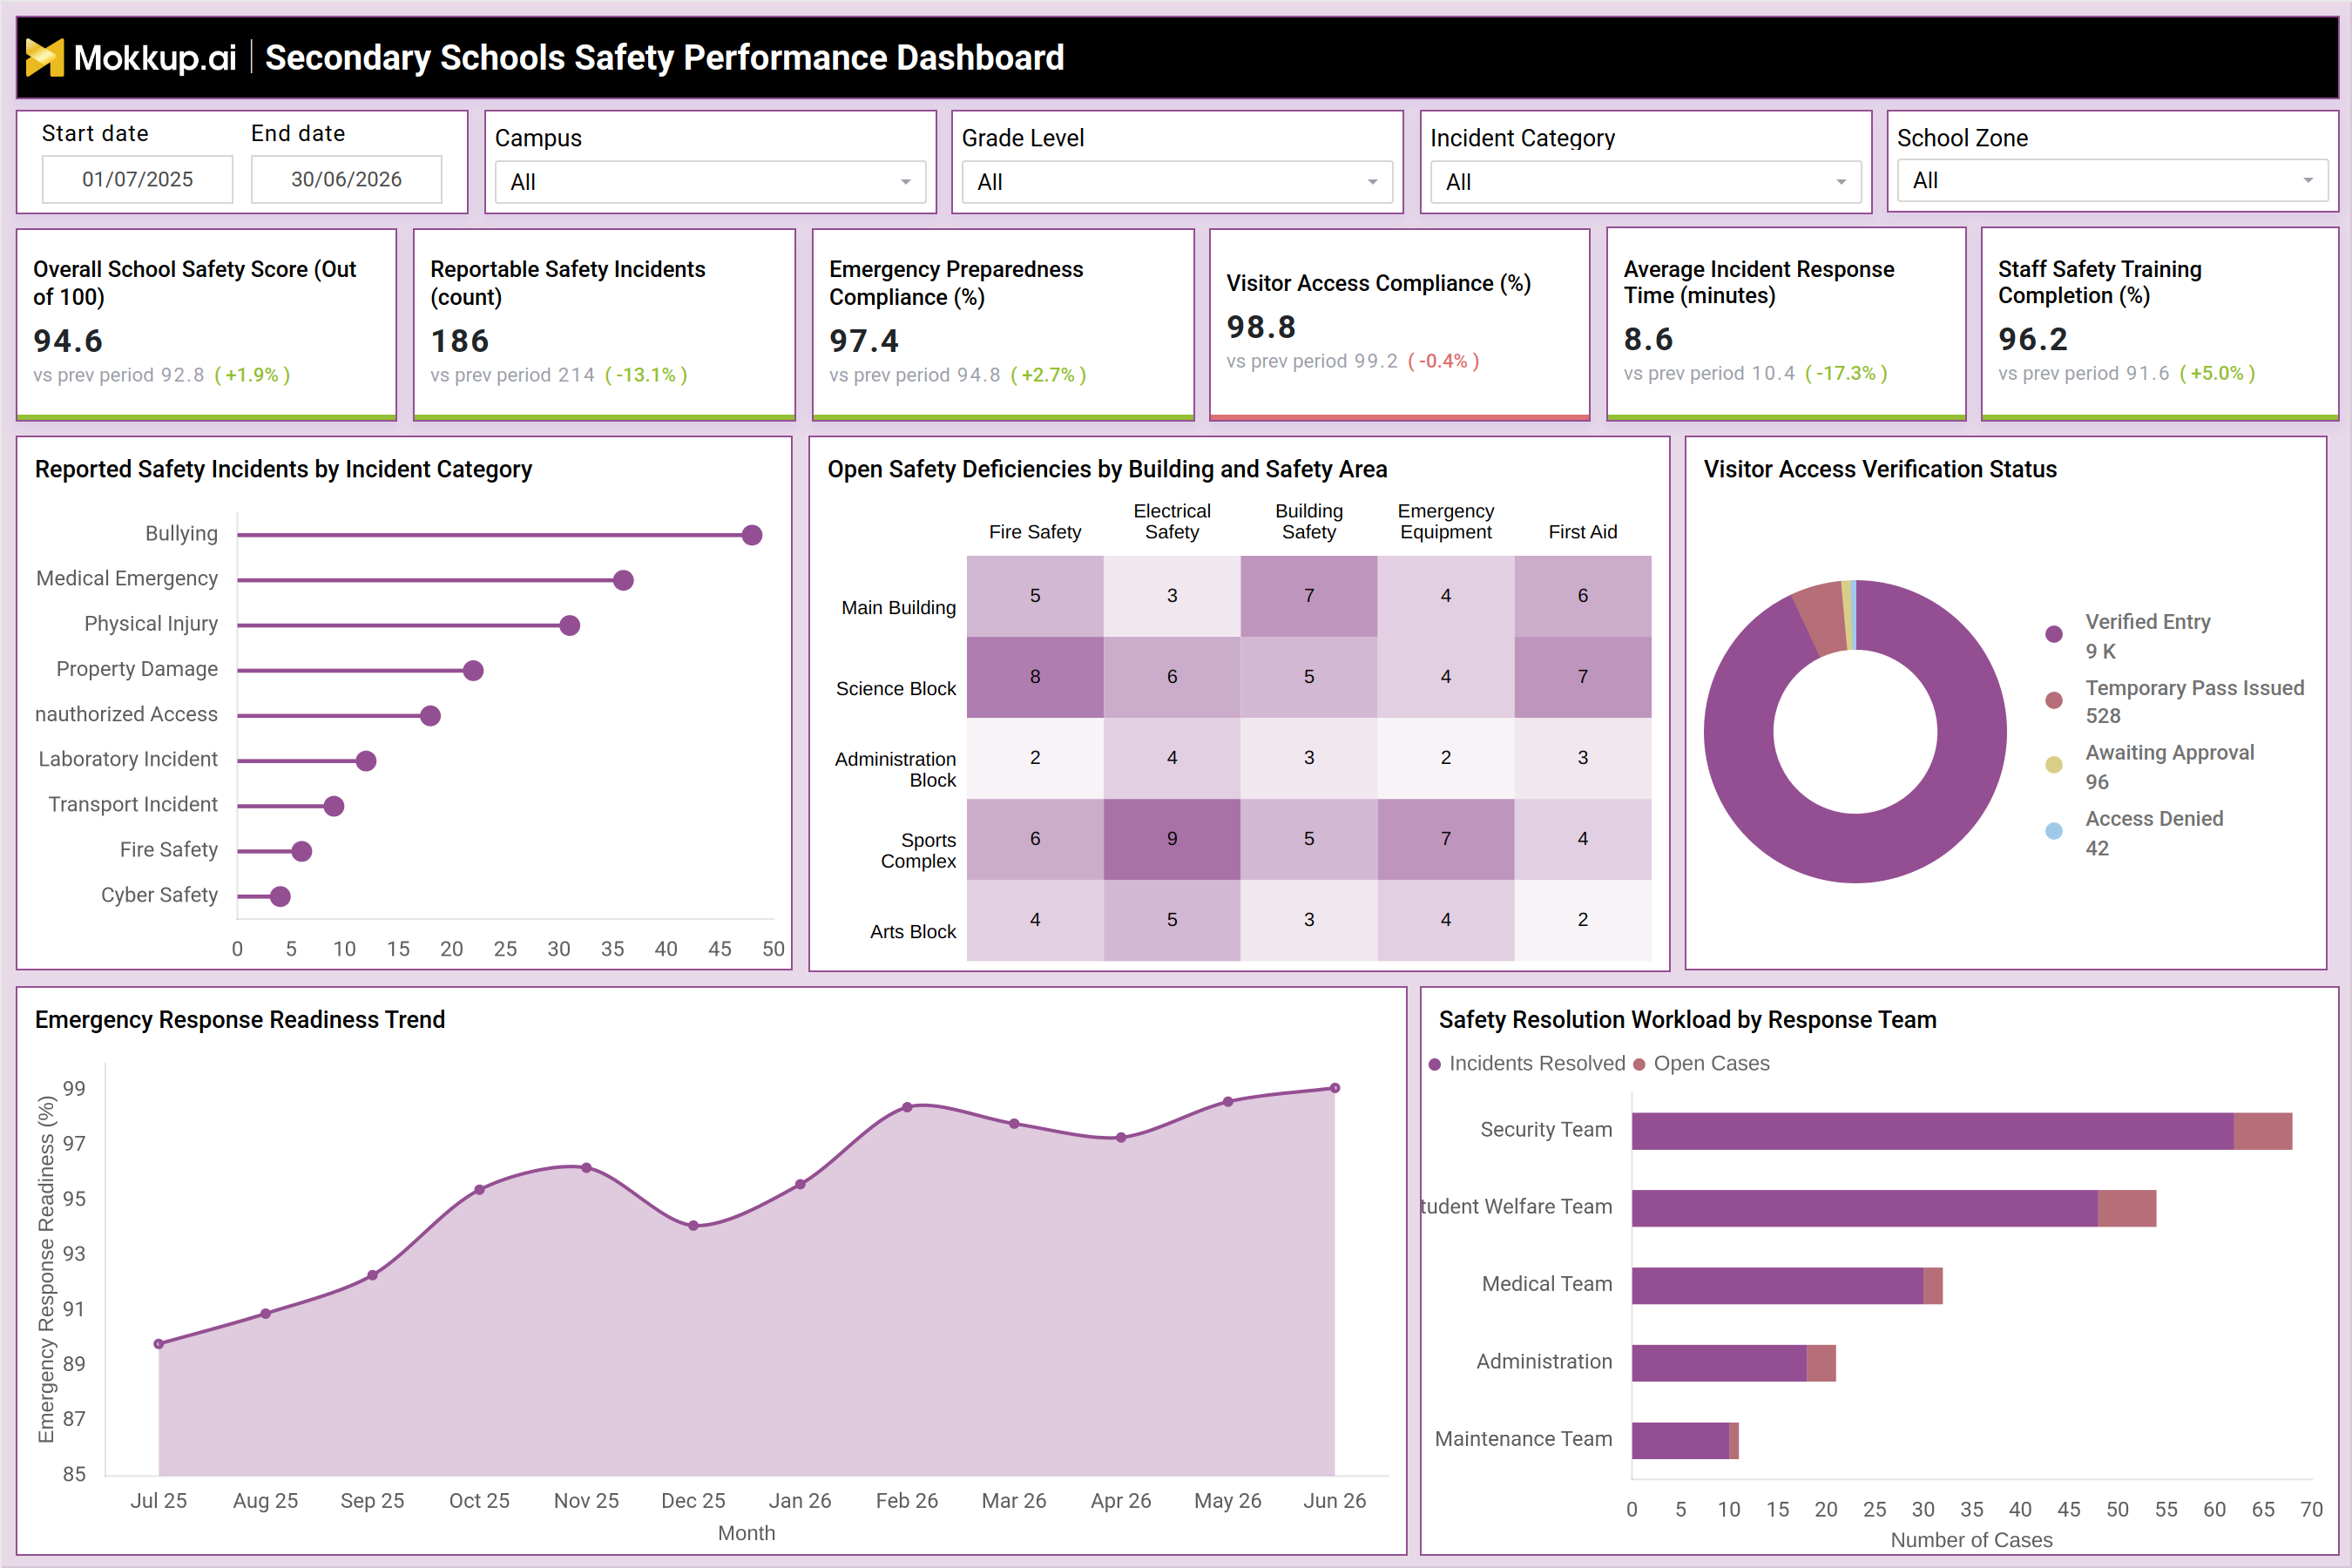
What is a Secondary Schools Safety Performance Dashboard
The Secondary Schools Safety Performance Dashboard gives school administrators, safety officers, and district leaders a single view of how well campus safety operations are performing across buildings, grade levels, and incident types. It brings safety scoring, incident volume, emergency preparedness, visitor access compliance, and staff training completion into one workspace, supporting secondary school safety performance tracking across an entire academic year. Filters for campus, grade level, incident category, and school zone let users narrow the view to a specific building or student segment without losing sight of the bigger picture.
Because the dashboard pairs school emergency preparedness compliance with day-to-day incident tracking and building-level deficiency data, safety teams can move between a summary view and detailed school building safety deficiency tracking on the same screen. The result is a consistent way to monitor how safe a campus actually is, not just how many incidents were logged.
How to Create a Secondary Schools Safety Performance Dashboard
You don't need to build your report from scratch; just start with a ready-to-use dashboard template from Mokkup. Add in your data and export it however you like. Here's how to do it:
1. Create or Log in to Your Mokkup Account
Start by signing up on Mokkup.ai using your email. If you already have an account, just log in, and you'll be good to go.
2. Choose and Customize Your Dashboard Template
Find the Secondary Schools Safety Performance Dashboard template in the Templates section. Use the drag-and-drop editor to adjust KPIs, edit filters, or add elements based on your data.
3. Export to Your BI Tool
Once your dashboard wireframe is ready, use the BI Tool Export feature to send it directly to Power BI or Tableau for further analysis and enhancements. You can also download the dashboard as a PDF, PNG, or JPEG, embed it on a platform, or invite your team to collaborate.
Note: This is a Pro template. You'll need a Pro subscription on Mokkup to use and customize this dashboard wireframe. Upgrade anytime to unlock full access.
Secondary Schools Safety Performance Dashboard Example
A district safety coordinator typically opens this dashboard ahead of a monthly safety review to understand whether campus conditions are trending in the right direction. Rather than paging through incident logs, they start with the overview to gauge whether the school's overall safety posture is holding steady, then apply the campus, grade level, or school zone filters to check whether a particular building or student group is driving that trend. This approach keeps secondary school safety performance tracking grounded in specifics rather than a single average score.
From there, safety teams can identify which incident categories are rising fastest and compare that against how deficiencies are distributed across buildings and safety areas, so a spike in one location does not go unnoticed. Facilities managers can compare fire safety, electrical safety, and building safety issues side by side to prioritize which block needs attention first, while security leads can assess how many visitor access requests are being verified, delayed, or denied. Response teams use the workload view to see how resolved cases stack up against open cases by team, helping supervisors rebalance assignments before backlogs grow. Reviewing the readiness trend over time also lets planners judge whether recent drills and training are translating into steadier response performance.
Taken together, the dashboard helps school leadership move from reactive incident logging to proactive safety management, giving them the visibility needed to close deficiencies, keep emergency preparedness compliance high, and demonstrate accountability to parents, staff, and regulators.
How to Analyze Data in a Secondary Schools Safety Performance Dashboard
Here is how you can analyze data from this dashboard:
- Filter by Campus / School Zone: Focus on safety performance for a specific building or site.
- Set Start and End Dates: Compare current-term safety performance with the previous period.
- Review Safety Incidents by Category: Identify which types of safety issues are increasing most quickly.
- Use the Building & Safety Area Heatmap: Pinpoint locations with recurring deficiencies and prioritize remediation.
- Monitor Visitor Access Verification: Identify unusual increases in denied or pending visitor entries.
- Track Emergency Response Readiness: Compare readiness trends month over month to support incident response time analysis.
- Compare Resolved vs. Open Cases: Identify workload imbalances across response teams and areas that may need additional support.
Benefits of a Secondary Schools Safety Performance Dashboard
The following are the benefits of using this dashboard:
- Centralizes Safety Incident Reporting: Groups incidents by category so leadership can identify patterns instead of reviewing isolated events.
- Reduces Manual Reporting: Combines safety scores, incidents, and compliance metrics in one view.
- Improves Response Team Accountability: Shows each team its resolution workload and outstanding cases.
- Monitors Visitor Access Compliance: Provides visibility into visitor access compliance to support faster safety decisions.
- Prioritizes Facility Improvements: Highlights buildings with the highest number of open safety deficiencies.
- Supports Audit Readiness: Keeps emergency preparedness and staff training metrics visible and up to date.
KPIs to Track in a Secondary Schools Safety Performance Dashboard
The following key KPIs can be tracked by using this dashboard:
- Overall School Safety Score: a composite score summarizing how safe the campus is across incidents, compliance, and readiness.
- Reportable Safety Incidents: the count of incidents that must be logged and reported under safety policy.
- Emergency Preparedness Compliance: measures how well the school meets required school emergency preparedness compliance standards.
- Visitor Access Compliance: reflects how consistently visitor entry follows verification procedures, supporting visitor access compliance monitoring for schools.
- Average Incident Response Time: the average time taken to respond to a reported safety incident, useful for campus incident response time analysis across teams.
- Staff Safety Training Completion: the percentage of staff who have completed required safety training.
Frequently Asked Questions
1. What does the Secondary Schools Safety Performance Dashboard track?
It tracks campus-wide safety metrics including incident volume, emergency preparedness, visitor access compliance, and staff training completion, and supports campus incident response time analysis across response teams.
2. Who uses this dashboard?
School safety officers, facilities managers, security teams, and district administrators use it to monitor safety performance and prioritize corrective action.
3. Does the dashboard support school building safety deficiency tracking?
Yes, the heatmap view breaks down open deficiencies by building and safety area, making school building safety deficiency tracking straightforward across multiple sites.