
What is a Special Education Student Health Services Dashboard?
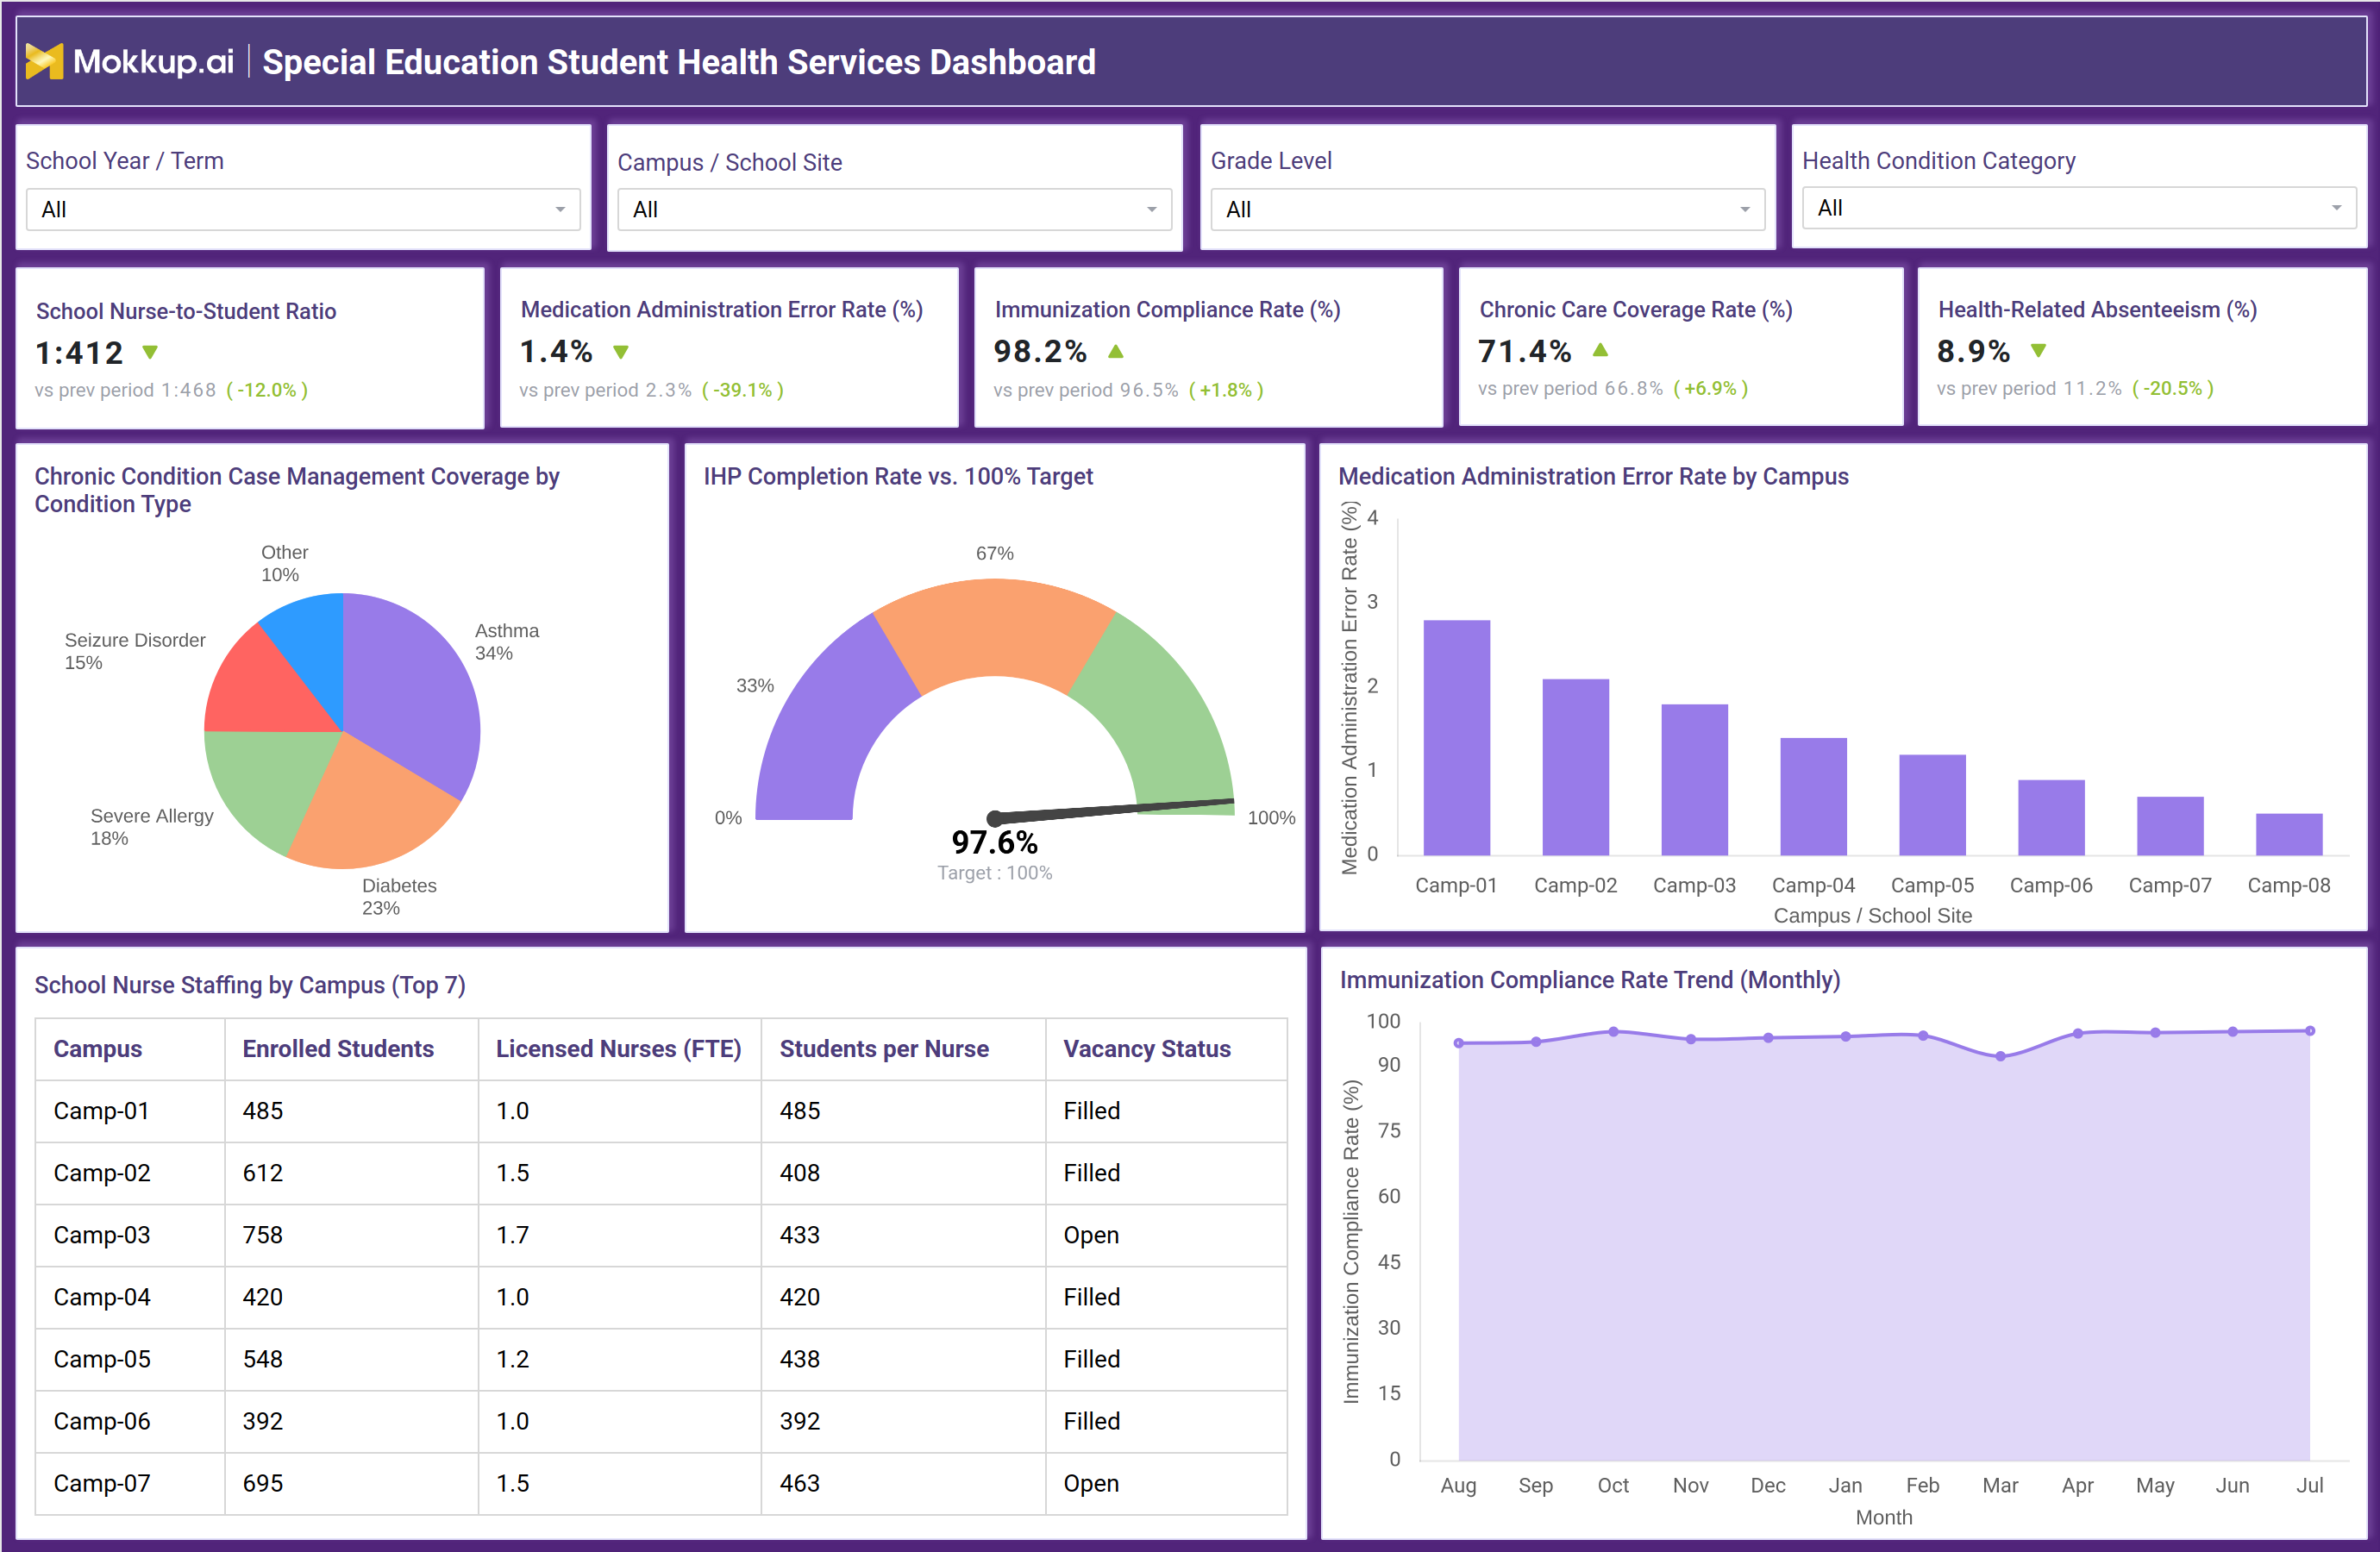
The Special Education Student Health Services Dashboard is a single-screen reporting tool built for school nurses, special education coordinators, and district health administrators who manage the medical and health-plan needs of students receiving special education services. It consolidates immunization records, medication administration logs, chronic condition case management, and nurse staffing data into one view, filterable by school year or term, campus, grade level, and health condition category. Because many special education students carry ongoing health conditions that require coordinated care, this special education student health services dashboard gives health teams a single reference point instead of scattered spreadsheets and paper files. Administrators can compare campuses side by side, spot compliance gaps early, and confirm that individualized health plans are being completed on schedule. The layout keeps every health metric visible without switching between separate reports, which shortens the time nurses and coordinators spend assembling data for board meetings or state audits.
How to Create a Special Education Student Health Services Dashboard
You don't need to build your report from scratch—just start with a ready-to-use dashboard template from Mokkup. Add in your data and export it however you like. Here's how to do it:
1. Create or Log in to Your Mokkup Account
Start by signing up on Mokkup.ai using your email. If you already have an account, just log in, and you'll be good to go.
2. Choose and Customize Your Dashboard Template
Find the Special Education Student Health Services Dashboard template in the Templates section. Use the drag-and-drop editor to adjust KPIs, edit filters, or add elements based on your data.
3. Export to Your BI Tool
Once your dashboard wireframe is ready, use the BI Tool Export feature to send it directly to Power BI or Tableau for further analysis and enhancements. You can also download the dashboard as a PDF, PNG, or JPEG, embed it on a platform, or invite your team to collaborate.
Note: This is a Pro template. You'll need a Pro subscription on Mokkup to use and customize this dashboard wireframe. Upgrade anytime to unlock full access.
Special Education Student Health Services Dashboard Example
A district's lead school nurse or special education health coordinator opens this dashboard at the start of a term to check whether campus health operations are running within safe and compliant limits before the state audit window opens. They want to know whether nurse staffing keeps pace with enrollment, whether medication is being administered without errors, and whether every student who needs an individualized health plan actually has one on file.
On this screen, coordinators can use this school nurse-to-student ratio analysis tool to compare staffing loads across campuses and identify which sites are falling behind, then drill into medication administration accuracy by campus to determine whether an error pattern is isolated to one location or spread across the district. When chronic care coverage rate monitoring for schools flags a lagging condition category, teams can prioritize outreach to the families or clinicians involved before a gap turns into a missed treatment. Nurse staffing data lets administrators flag campuses with open positions so they can redirect substitute coverage before ratios stretch too thin, and this individualized health plan completion rate tracking dashboard lets special education directors confirm plans are finished well ahead of the compliance deadline rather than scrambling in the final week.
Altogether, the dashboard helps districts move from reactive health record-keeping to a proactive review process, one where staffing gaps, medication risks, and incomplete health plans surface early enough to act on, keeping students receiving special education services safer and better supported throughout the school year.
How to Analyze Data in a Special Education Student Health Services Dashboard
Here is how you can analyze data from this dashboard:
- Filter by campus to compare nurse-to-student ratio, medication error rate, and immunization compliance across sites in one view.
- Use the Health Condition Category filter to focus on students with asthma, diabetes, severe allergy, seizure disorder, or other chronic conditions.
- Review the chronic condition case management coverage chart to see which condition types have the largest share of active care plans.
- Check the IHP completion gauge against the target to confirm individualized health plans are on track before the compliance deadline.
- Use this medication administration error rate tracking dashboard view to compare campuses and isolate sites needing tighter protocols.
- Rely on this immunization compliance rate tracking tool to monitor monthly trends and catch seasonal dips before they affect enrollment eligibility.
- Cross-reference the nurse staffing table to see which campuses carry the highest students-per-nurse load and open vacancies.
Benefits of a Special Education Student Health Services Dashboard
The following are the benefits of using this dashboard:
- Centralizes immunization, medication, and chronic care data for special education students in a single special education student health services dashboard.
- Helps campus health teams stay ahead of immunization compliance requirements before state and district audits.
- Surfaces medication administration error rate tracking dashboard trends by campus so training gaps get addressed quickly.
- Supports staffing decisions by flagging campuses where nurse-to-student ratio has stretched beyond safe coverage levels.
- Improves chronic care coverage rate monitoring for schools by highlighting condition types with lower plan completion.
- Reduces health-related absenteeism by identifying students and campuses that need earlier intervention.
- Gives special education directors one source of truth for board reporting and compliance documentation.
KPIs to Track in a Special Education Student Health Services Dashboard
Key Performance Indicators (KPIs) are measurable values that show how effectively a program is meeting its goals.
- School Nurse-to-Student Ratio: the core measure in this school nurse-to-student ratio analysis tool, showing how many students each licensed nurse supports per campus and where staffing is stretched thin.
- Medication Administration Error Rate: measures the share of medication doses given incorrectly, timed wrong, or missed, flagging campuses that need tighter protocols.
- Immunization Compliance Rate: the core metric inside this immunization compliance rate tracking tool, showing the percentage of enrolled students meeting required immunization records for state and district compliance.
- Chronic Care Coverage Rate: shows the percentage of students with a chronic health condition who have an active, up-to-date care plan on file.
- Health-Related Absenteeism Rate: measures the percentage of missed school days attributed to health conditions, helping teams spot students who need earlier support.
Frequently Asked Questions
1. What is a Special Education Student Health Services Dashboard used for?
It tracks immunization compliance, medication administration accuracy, chronic care coverage, and nurse staffing for students receiving special education services. School health teams use it to confirm compliance ahead of audits and identify campuses that need support.
2. Which KPIs matter most for special education health services?
Immunization compliance rate, medication administration error rate, and chronic care coverage rate are the core indicators, alongside school nurse-to-student ratio and individualized health plan completion rate. Together they show whether campuses are staffed and compliant enough to support students safely.
3. Can I customize this dashboard template for my district?
Yes. The Special Education Student Health Services Dashboard template can be customized in Mokkup's editor to match your district's campuses, filters, and reporting needs, then exported to Power BI or Tableau. Full customization requires a Pro subscription.