
What is a Boarding School Student Health Services Dashboard?
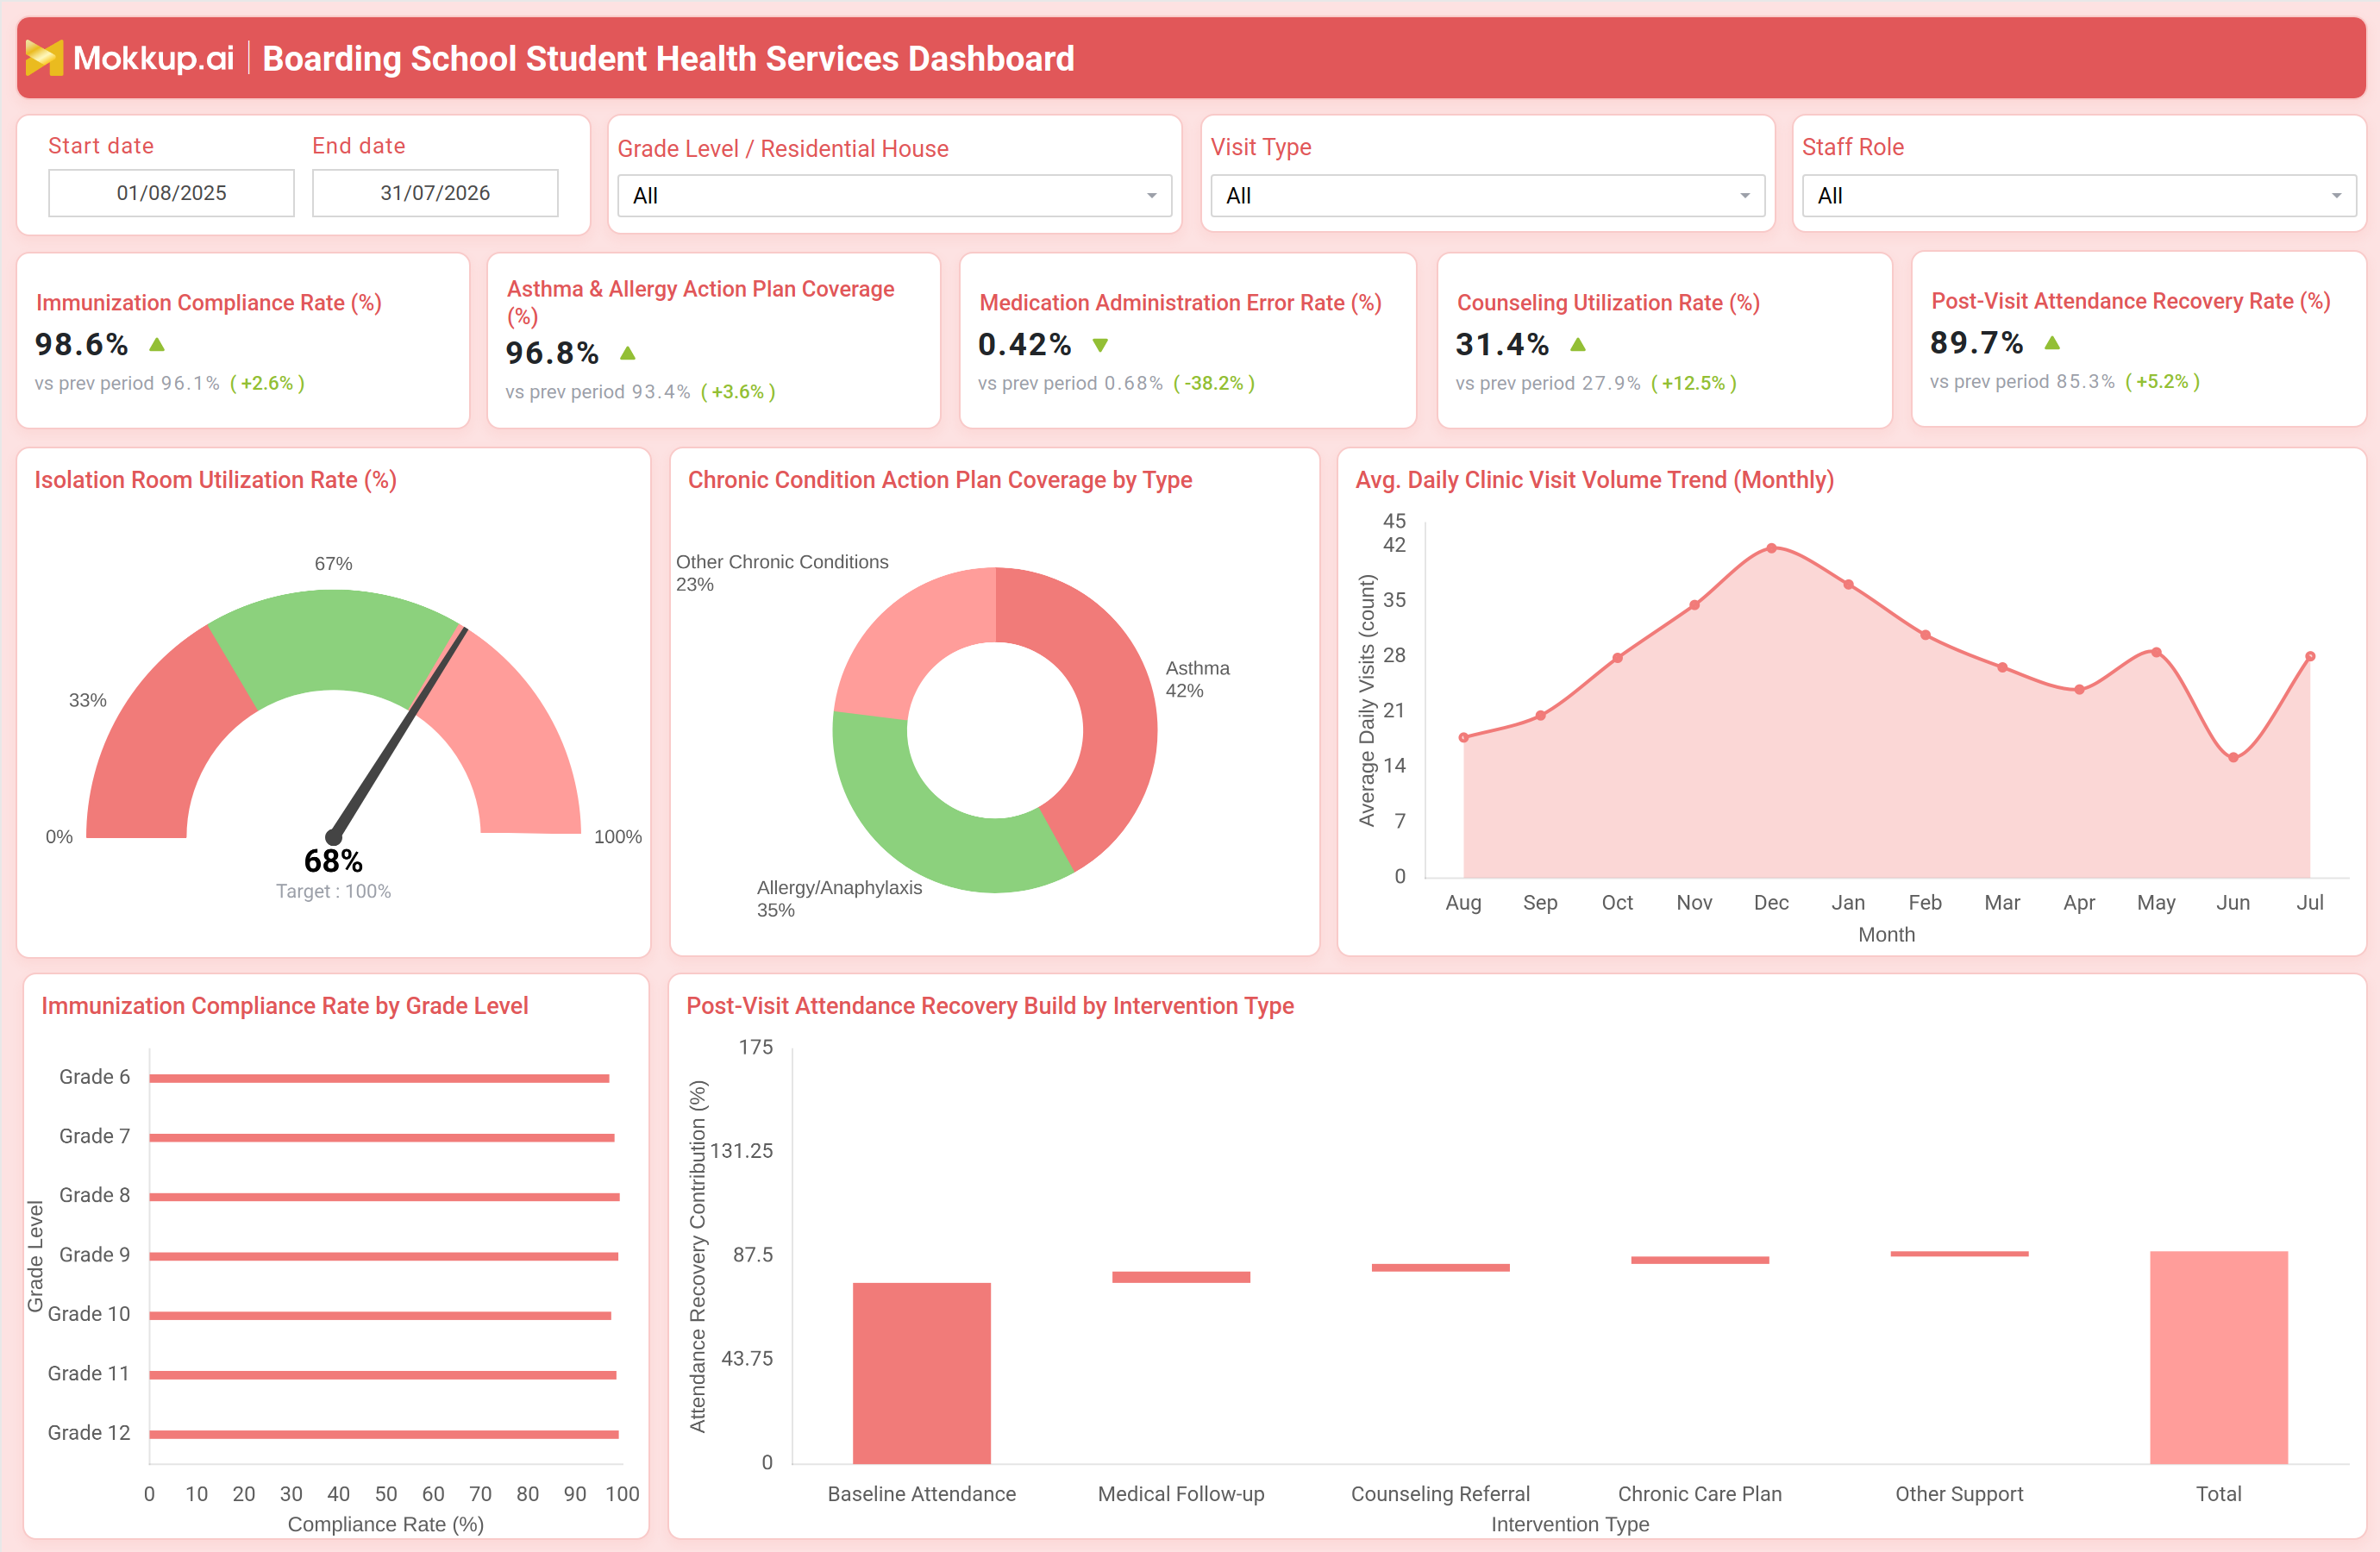
A boarding school student health services dashboard gives school nurses, health center directors, and residential life administrators a single view of clinical and wellness operations across a campus where students live as well as learn. Because boarding students cannot go home after a clinic visit, health teams need visibility into how quickly students recover, return to class, and stay supported through ongoing conditions. The Boarding School Student Health Services Dashboard template from Mokkup consolidates immunization records, medication safety, isolation room usage, and counseling activity into one wireframe, giving leadership a structured view of care quality instead of raw clinic logs. It functions as an immunization compliance rate tracking tool that also surfaces medication error trends, chronic condition coverage, and how students recover attendance after a health-related absence. Any team searching for a boarding school student health services dashboard that ties clinical safety to residential life outcomes will find this template a practical starting point.
How to Create a Boarding School Student Health Services Dashboard
You don't need to build your report from scratch, just start with a ready-to-use Boarding School Student Health Services Dashboard template. Add in your data and export it however you like. Here's how to do it:
1. Create or Log in to Your Mokkup Account
Start by signing up on Mokkup.ai using your email. If you already have an account, just log in, and you'll be good to go.
2. Choose and Customize Your Dashboard Template
Find the Boarding School Student Health Services Dashboard template in the Templates section. Use the drag-and-drop editor to adjust KPIs, edit filters, or add elements based on your data.
3. Export to Your BI Tool
Once your dashboard wireframe is ready, use the BI Tool Export feature to send it directly to Power BI or Tableau for further analysis and enhancements. You can also download the dashboard as a PDF, PNG, or JPEG, embed it on a platform, or invite your team to collaborate.
Note: This is a Pro template. You'll need a Pro subscription on Mokkup to use and customize this dashboard wireframe. Upgrade anytime to unlock full access.
Boarding School Student Health Services Dashboard Example
A boarding school health center director typically opens this dashboard at the start of a term to judge whether the health service is keeping pace with a residential population that never fully leaves campus. Filtering by grade level or residential house, the director checks whether immunization records are current, whether medication is being administered safely, and whether isolation space is sized correctly for the term ahead. From there, the team can identify which grade levels or houses are lagging on immunization compliance and prioritize outreach before an audit or outbreak forces the issue. Nurses can track how action plan coverage holds up across chronic conditions such as asthma and allergy, comparing it against the actual mix of conditions in the student population so care plans match real need instead of guesswork.
When medication error trends move in the wrong direction, staff can narrow by staff role and visit type to see where a process gap is forming, rather than treating each error as an isolated incident. Residential life leaders use the isolation room view to judge whether current capacity matches seasonal illness patterns, adjusting staffing accordingly. Counseling utilization trends help the wellness team gauge whether students are engaging with mental health support at a healthy rate, and whether that engagement is rising or falling against the prior period. Planners can compare how intervention types, including medical follow-up, counseling referral, and chronic care planning, contribute to restoring full attendance after a health-related absence, which helps the team decide where to invest support resources. Taken together, the dashboard helps a boarding school health services team move from reactive, case-by-case clinic management to a coordinated view of student wellbeing across the campus, so leadership can defend budget requests, satisfy accreditation reviewers, and reassure families that health and safety are actively managed.
How to Analyze Data in a Boarding School Student Health Services Dashboard
Here is how you can analyze data from this dashboard:
- Filter by Grade Level/Residential House to isolate compliance and utilization patterns for a specific student group.
- Segment by Visit Type to separate routine screenings from urgent or follow-up clinic visits.
- Apply Staff Role filters as part of medication administration error rate tracking for schools to catch process gaps early.
- Track the Avg. Daily Clinic Visit Volume Trend to spot seasonal spikes in health center demand.
- Review the Chronic Condition Action Plan Coverage by Type breakdown to confirm care plans match the campus condition mix.
- Use Immunization Compliance Rate by Grade Level as an immunization compliance rate tracking tool for outreach planning.
- Read the Post-Visit Attendance Recovery Build chart as a post-visit attendance recovery rate monitoring tool for intervention planning.
- Set a custom Start date and End date range to align analysis with a term, semester, or academic year.
Benefits of a Boarding School Student Health Services Dashboard
The following are the benefits of using this dashboard:
- Replaces scattered clinic logs with a single administrator view.
- Speeds identification of grade levels or houses falling behind on immunization compliance.
- Functions as an isolation room utilization rate monitoring dashboard for residential life capacity planning.
- Connects clinical care quality to attendance recovery outcomes after a health absence.
- Supports counseling utilization rate analysis for boarding schools wellness and residential teams rely on each term.
- Helps health teams prepare accreditation and licensing reviews with documented compliance trends.
- Strengthens medication administration error rate tracking for schools so safety issues surface before they escalate.
KPIs to Track in a Boarding School Student Health Services Dashboard
The following key KPIs can be tracked by using this dashboard:
- Immunization Compliance Rate (%): Share of students with immunization records meeting requirements, an immunization compliance rate tracking tool that flags grades needing outreach.
- Asthma & Allergy Action Plan Coverage (%): Percentage of students with asthma or allergy diagnoses who have a current, documented action plan on file.
- Medication Administration Error Rate (%): Rate of medication administration incidents relative to total doses given, a core patient-safety measure.
- Counseling Utilization Rate (%): Share of students accessing counseling support, useful for counseling utilization rate analysis for boarding schools tracking wellness engagement.
- Post-Visit Attendance Recovery Rate (%): Percentage of students returning to full attendance after a clinic visit, framed as a post-visit attendance recovery rate monitoring tool.
Frequently Asked Questions
1. What does the Boarding School Student Health Services Dashboard track?
It tracks immunization compliance, medication safety, chronic condition action plan coverage, counseling utilization, isolation room usage, and post-visit attendance recovery. Filters narrow by grade level, residential house, visit type, and staff role.
2. Who uses a boarding school student health services dashboard day to day?
School nurses, health center directors, and residential life administrators use it together, since boarding students remain on campus during recovery. It supports counseling utilization rate analysis for boarding schools wellness teams share with leadership.
3. Can this dashboard be customized for my school's data and BI tool?
Yes. Add your own data, adjust KPIs and filters, and export to Power BI or Tableau, or download as PDF, PNG, or JPEG. It works as a post-visit attendance recovery rate monitoring tool once your clinic and attendance data are connected.