
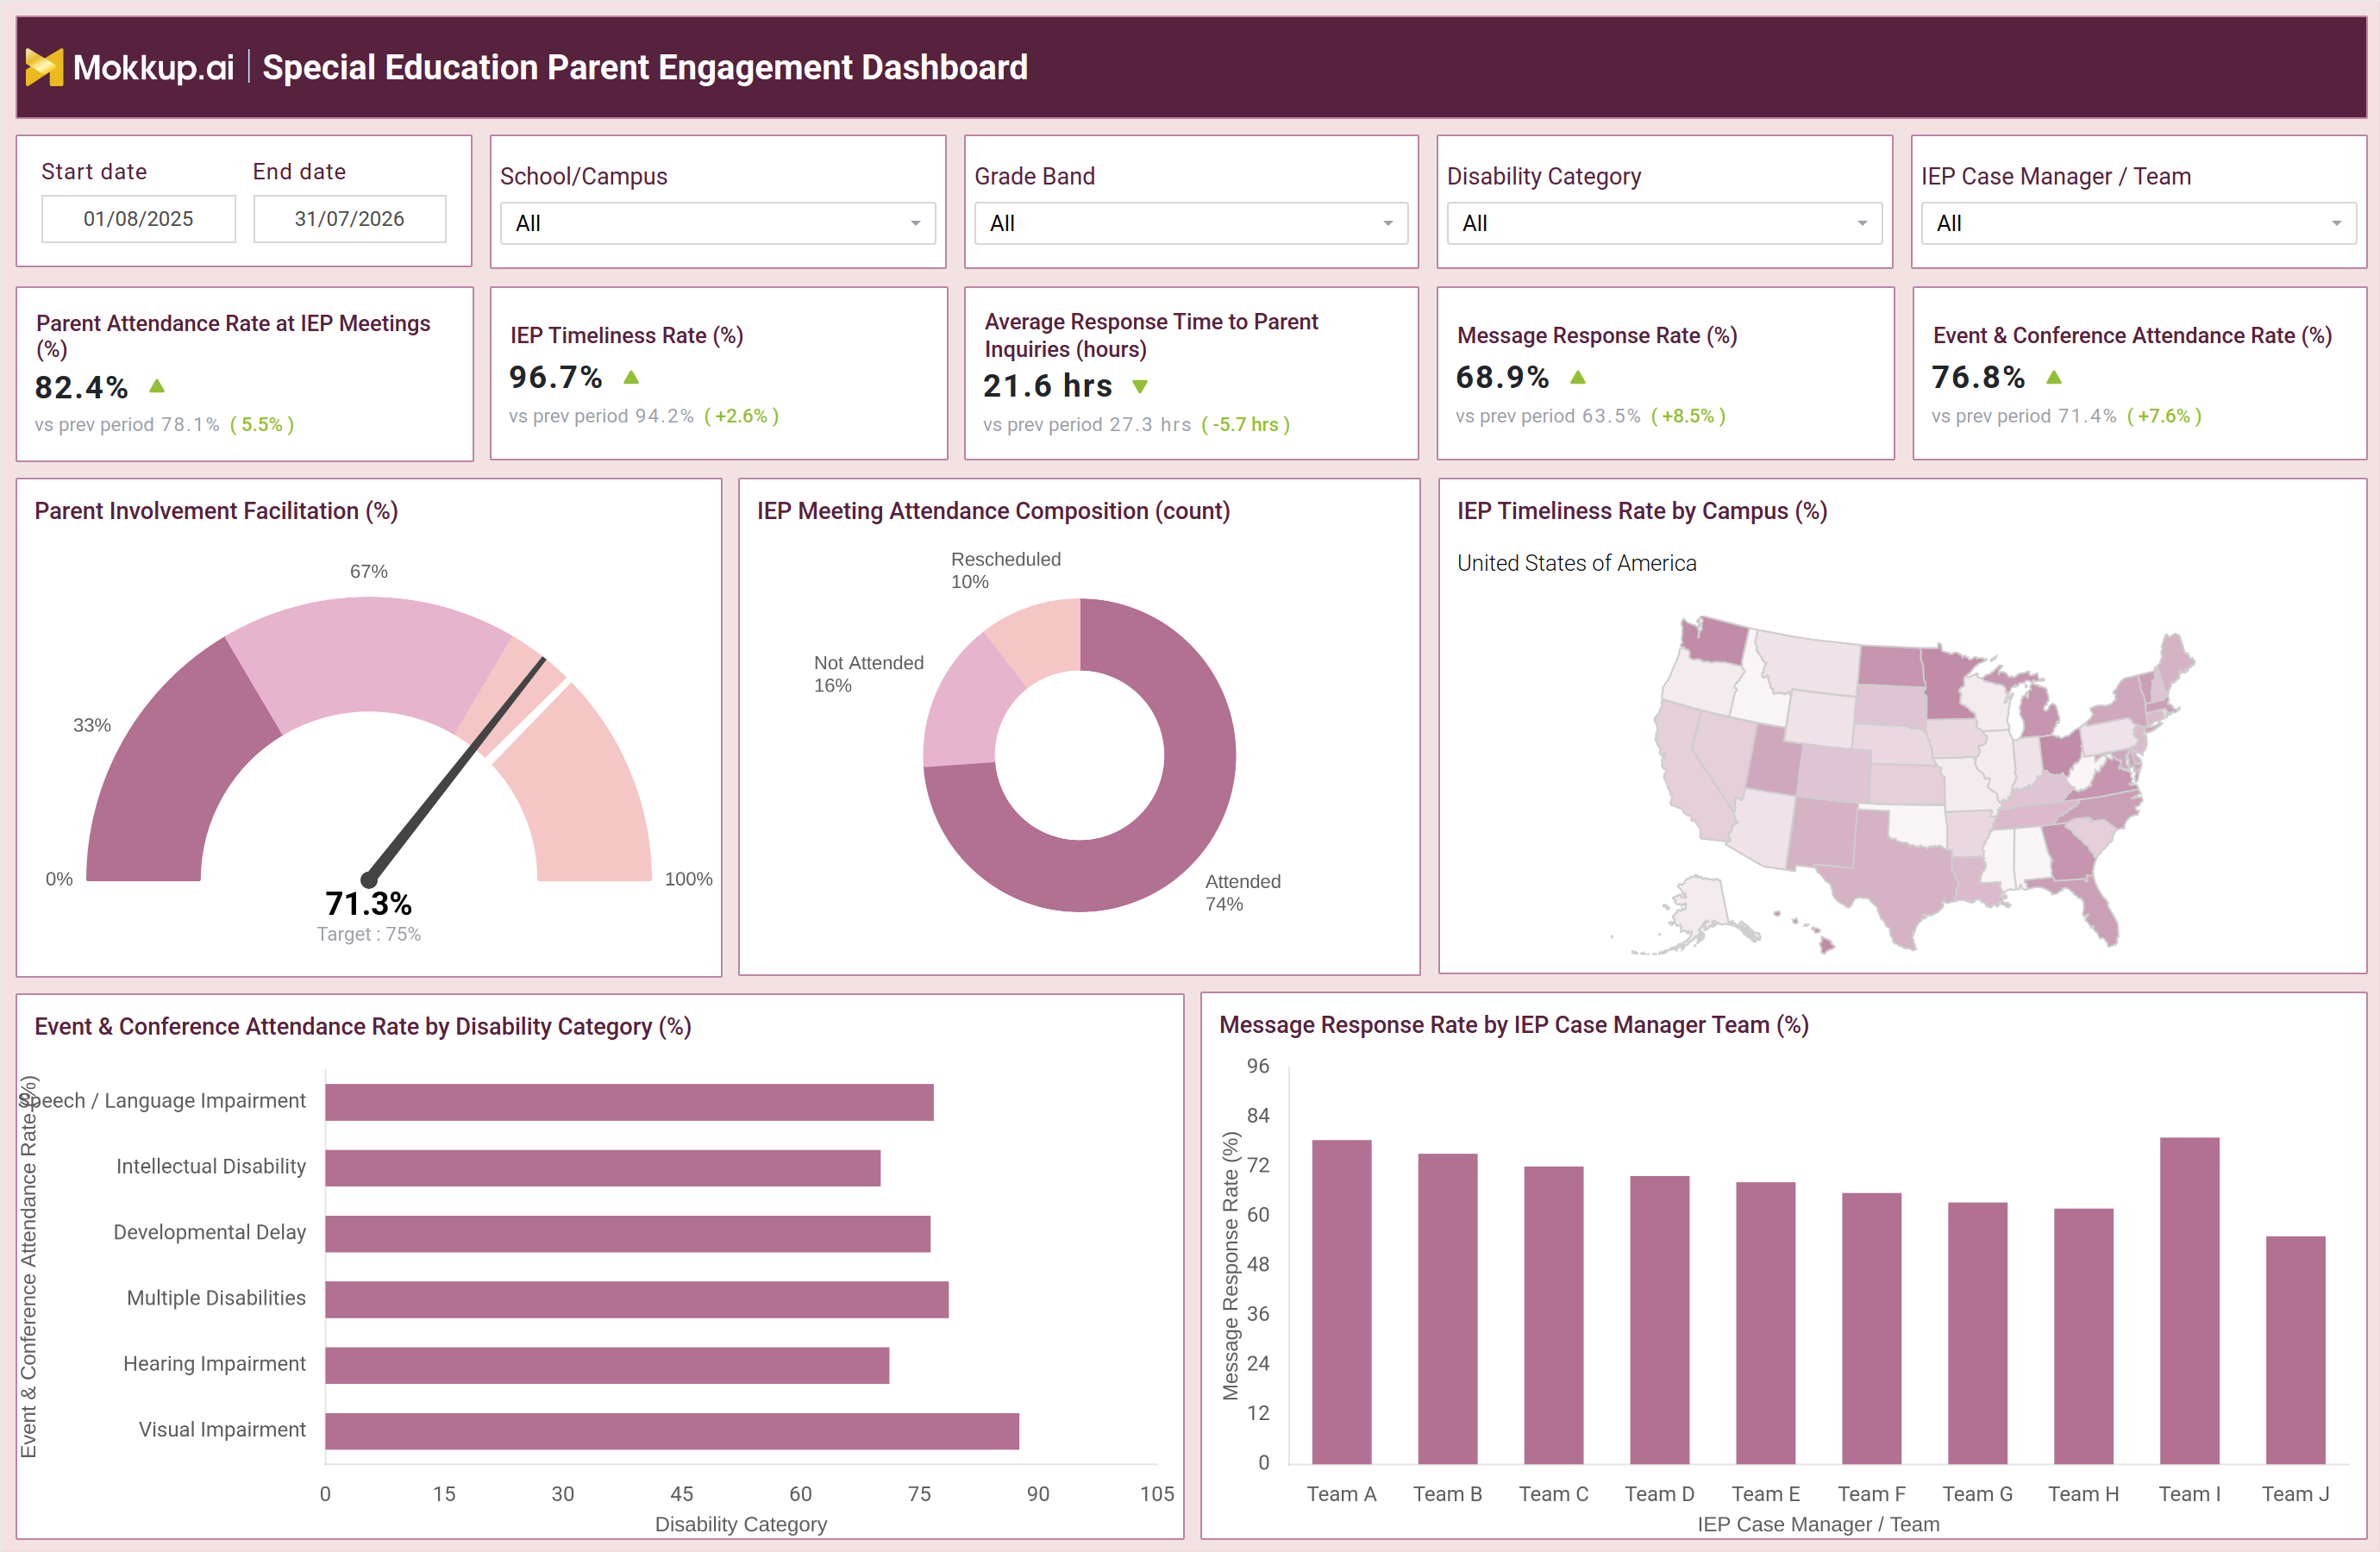
What is a Special Education Parent Engagement Dashboard
The Special Education Parent Engagement Dashboard is a single-screen reporting template built for special education coordinators, IEP case managers, and school administrators who need one consolidated view of how families are engaging with their child's educational planning process. It brings together parent attendance at IEP meetings, communication responsiveness, and event participation into a single workspace, filterable by school or campus, grade band, disability category, and IEP case manager or team. Rather than pulling attendance logs from one system and message logs from another, staff can use this special education parent engagement dashboard to see engagement patterns across an entire district or a single campus in one place. The layout is built for schools already using Power BI or Tableau, so the template can be customized with actual data and rolled out to case management teams without starting the design work from scratch.
How to Create a Special Education Parent Engagement Dashboard
You don't need to build your report from scratch—just start with a ready-to-use dashboard template from Mokkup. Add in your data and export it however you like. Here's how to do it:
1. Create or Log in to Your Mokkup Account
Start by signing up on Mokkup.ai using your email. If you already have an account, just log in, and you'll be good to go.
2. Choose and Customize Your Dashboard Template
Find the Special Education Parent Engagement Dashboard template in the Templates section. Use the drag-and-drop editor to adjust KPIs, edit filters, or add elements based on your data.
3. Export to Your BI Tool
Once your dashboard wireframe is ready, use the BI Tool Export feature to send it directly to Power BI or Tableau for further analysis and enhancements. You can also download the dashboard as a PDF, PNG, or JPEG, embed it on a platform, or invite your team to collaborate.
Note: This is a Pro template. You'll need a Pro subscription on Mokkup to use and customize this dashboard wireframe. Upgrade anytime to unlock full access.
Special Education Parent Engagement Dashboard Example
A special education case manager typically opens the Special Education Parent Engagement Dashboard before a compliance review or a team meeting, looking to understand how well families are staying involved in the IEP process across the district. Rather than checking attendance sheets and email threads separately, the case manager can use one screen to gauge whether engagement is trending in the right direction for the current reporting period.
From the main view, coordinators can compare how consistently parents are attending IEP meetings across campuses and grade bands and identify which disability categories or case manager teams are seeing lower engagement or slower response to outreach. If IEP documentation is slipping behind schedule at a particular school, staff can filter down to that campus and investigate before it becomes a compliance issue. When message response rates dip for a specific case manager team, program leads can prioritize coaching or redistribute outreach work rather than waiting for a parent complaint to surface the gap.
The result is a team that can act on parent engagement trends as they emerge rather than reconstructing them after the fact, using the special education parent engagement dashboard to keep IEP communication accountable, timely, and consistent across every campus and disability category the program serves.
How to Analyze Data in a Special Education Parent Engagement Dashboard
Here is how you can analyze data from this dashboard:
- Filter by School / Campus and Grade Band: Focus on engagement trends for a specific site or age group.
- Track IEP Meeting Attendance: Compare attendance patterns across different grade bands.
- Filter by Disability Category: Compare meeting attendance and response rates across student groups.
- Filter by IEP Case Manager / Team: Analyze message response rates across special education teams.
- Review IEP Meeting Attendance Composition: Compare attended, missed, and rescheduled meetings to understand participation patterns.
- Monitor IEP Timeliness by Campus: Identify campuses falling behind on documentation deadlines.
- Track Response Time to Parent Inquiries: Monitor average response times to identify potential delays in parent communication.
- Compare Parent Involvement Facilitation: Measure the current engagement level against its target to assess progress toward the program goal.
Benefits of a Special Education Parent Engagement Dashboard
The following are the benefits of using this dashboard:
- Centralizes Parent Engagement Data: Gives coordinators one special education parent engagement dashboard instead of separate attendance and messaging reports.
- Identifies IEP Delays: Quickly highlights campuses or teams falling behind on IEP timelines and documentation deadlines.
- Supports Team Coaching: Provides clear message response rate analysis to identify where special education case manager teams may need support.
- Reduces Compliance Reporting: Minimizes manual reporting work ahead of district compliance reviews and audits.
- Tracks Attendance by Disability Category: Shows event and conference attendance rates across disability categories rather than only providing district-wide totals.
- Monitors Parent Response Times: Helps program leads identify response-time trends early so communication delays do not affect parent trust.
KPIs to Track in a Special Education Parent Engagement Dashboard
Key Performance Indicators (KPIs) are measurable values that show how well a program is meeting its goals.
- Parent Attendance Rate at IEP Meetings (%): measures how many scheduled meetings parents actually attend, making it the primary IEP meeting attendance rate tracking tool on this dashboard.
- IEP Timeliness Rate (%): measures the share of IEPs completed within required deadlines, viewable through the IEP timeliness rate tracking by campus map.
- Average Response Time to Parent Inquiries (hours): measures how quickly staff respond to parent questions or requests.
- Message Response Rate (%): measures the share of parent messages that receive a reply, the basis for message response rate analysis for special education teams.
- Event & Conference Attendance Rate (%): the metric behind the event and conference attendance rate tracking dashboard view of parent turnout beyond IEP meetings.
Frequently Asked Questions
1. What is the Special Education Parent Engagement Dashboard used for?
It gives special education coordinators and IEP case managers one view of parent attendance, communication responsiveness, and event participation. Teams use the Special Education Parent Engagement Dashboard to track engagement by campus, grade band, and disability category.
2. Which teams benefit most from this dashboard?
Special education program coordinators, IEP case managers, and school administrators overseeing family engagement use it most. It also supports district compliance staff preparing for IEP timeliness reviews.
3. Can the dashboard be customized with our own data?
Yes. The template can be customized with your own data using the drag-and-drop editor and exported to Power BI, Tableau, or as a PDF, PNG, or JPEG file.