
What is a Meeting Volume Tracker?
A Meeting Volume Tracker is a workplace analytics tool that provides visibility into how meetings are distributed across different regions and departments. It tracks meeting frequency, meeting modes (virtual vs. in-person), back-to-back sessions, and performance trends over time. By combining regional data with departmental breakdowns, organizations can identify collaboration patterns, optimize workload distribution, and improve cross-team efficiency. This dashboard is especially useful for leadership, HR, and operations teams who need a clear picture of where collaboration time is spent and how it affects productivity.
How To Create a Meeting Volume Tracker?
You don’t need to build your report from scratch—just start with a ready-to-use Meeting Volume Tracker dashboard template from Mokkup. Plug in your own data and export it however you like. Here’s how to do it:
1. Create or Log in to Your Mokkup Account
Start by signing up on Mokkup.ai using your email. Already have an account? Just log in, and you’re good to go.
2. Choose and Customize Your Dashboard Template
Find the Meeting Volume Tracker template in the Templates section. Use the drag-and-drop editor to adjust KPIs, edit filters, or add elements based on your data.
3. Export to Your BI Tool
Once your dashboard is ready, use the BI Tool Export feature to send it directly to Power BI or Tableau for further analysis and enhancements. You can also download the dashboard as a PDF, PNG, or JPEG, embed it on a platform, or invite your team to collaborate.
Note: This is a Pro template. To use and customize this dashboard wireframe, you’ll need a Pro subscription on Mokkup. Upgrade anytime to unlock full access.
Meeting Volume Tracker Example
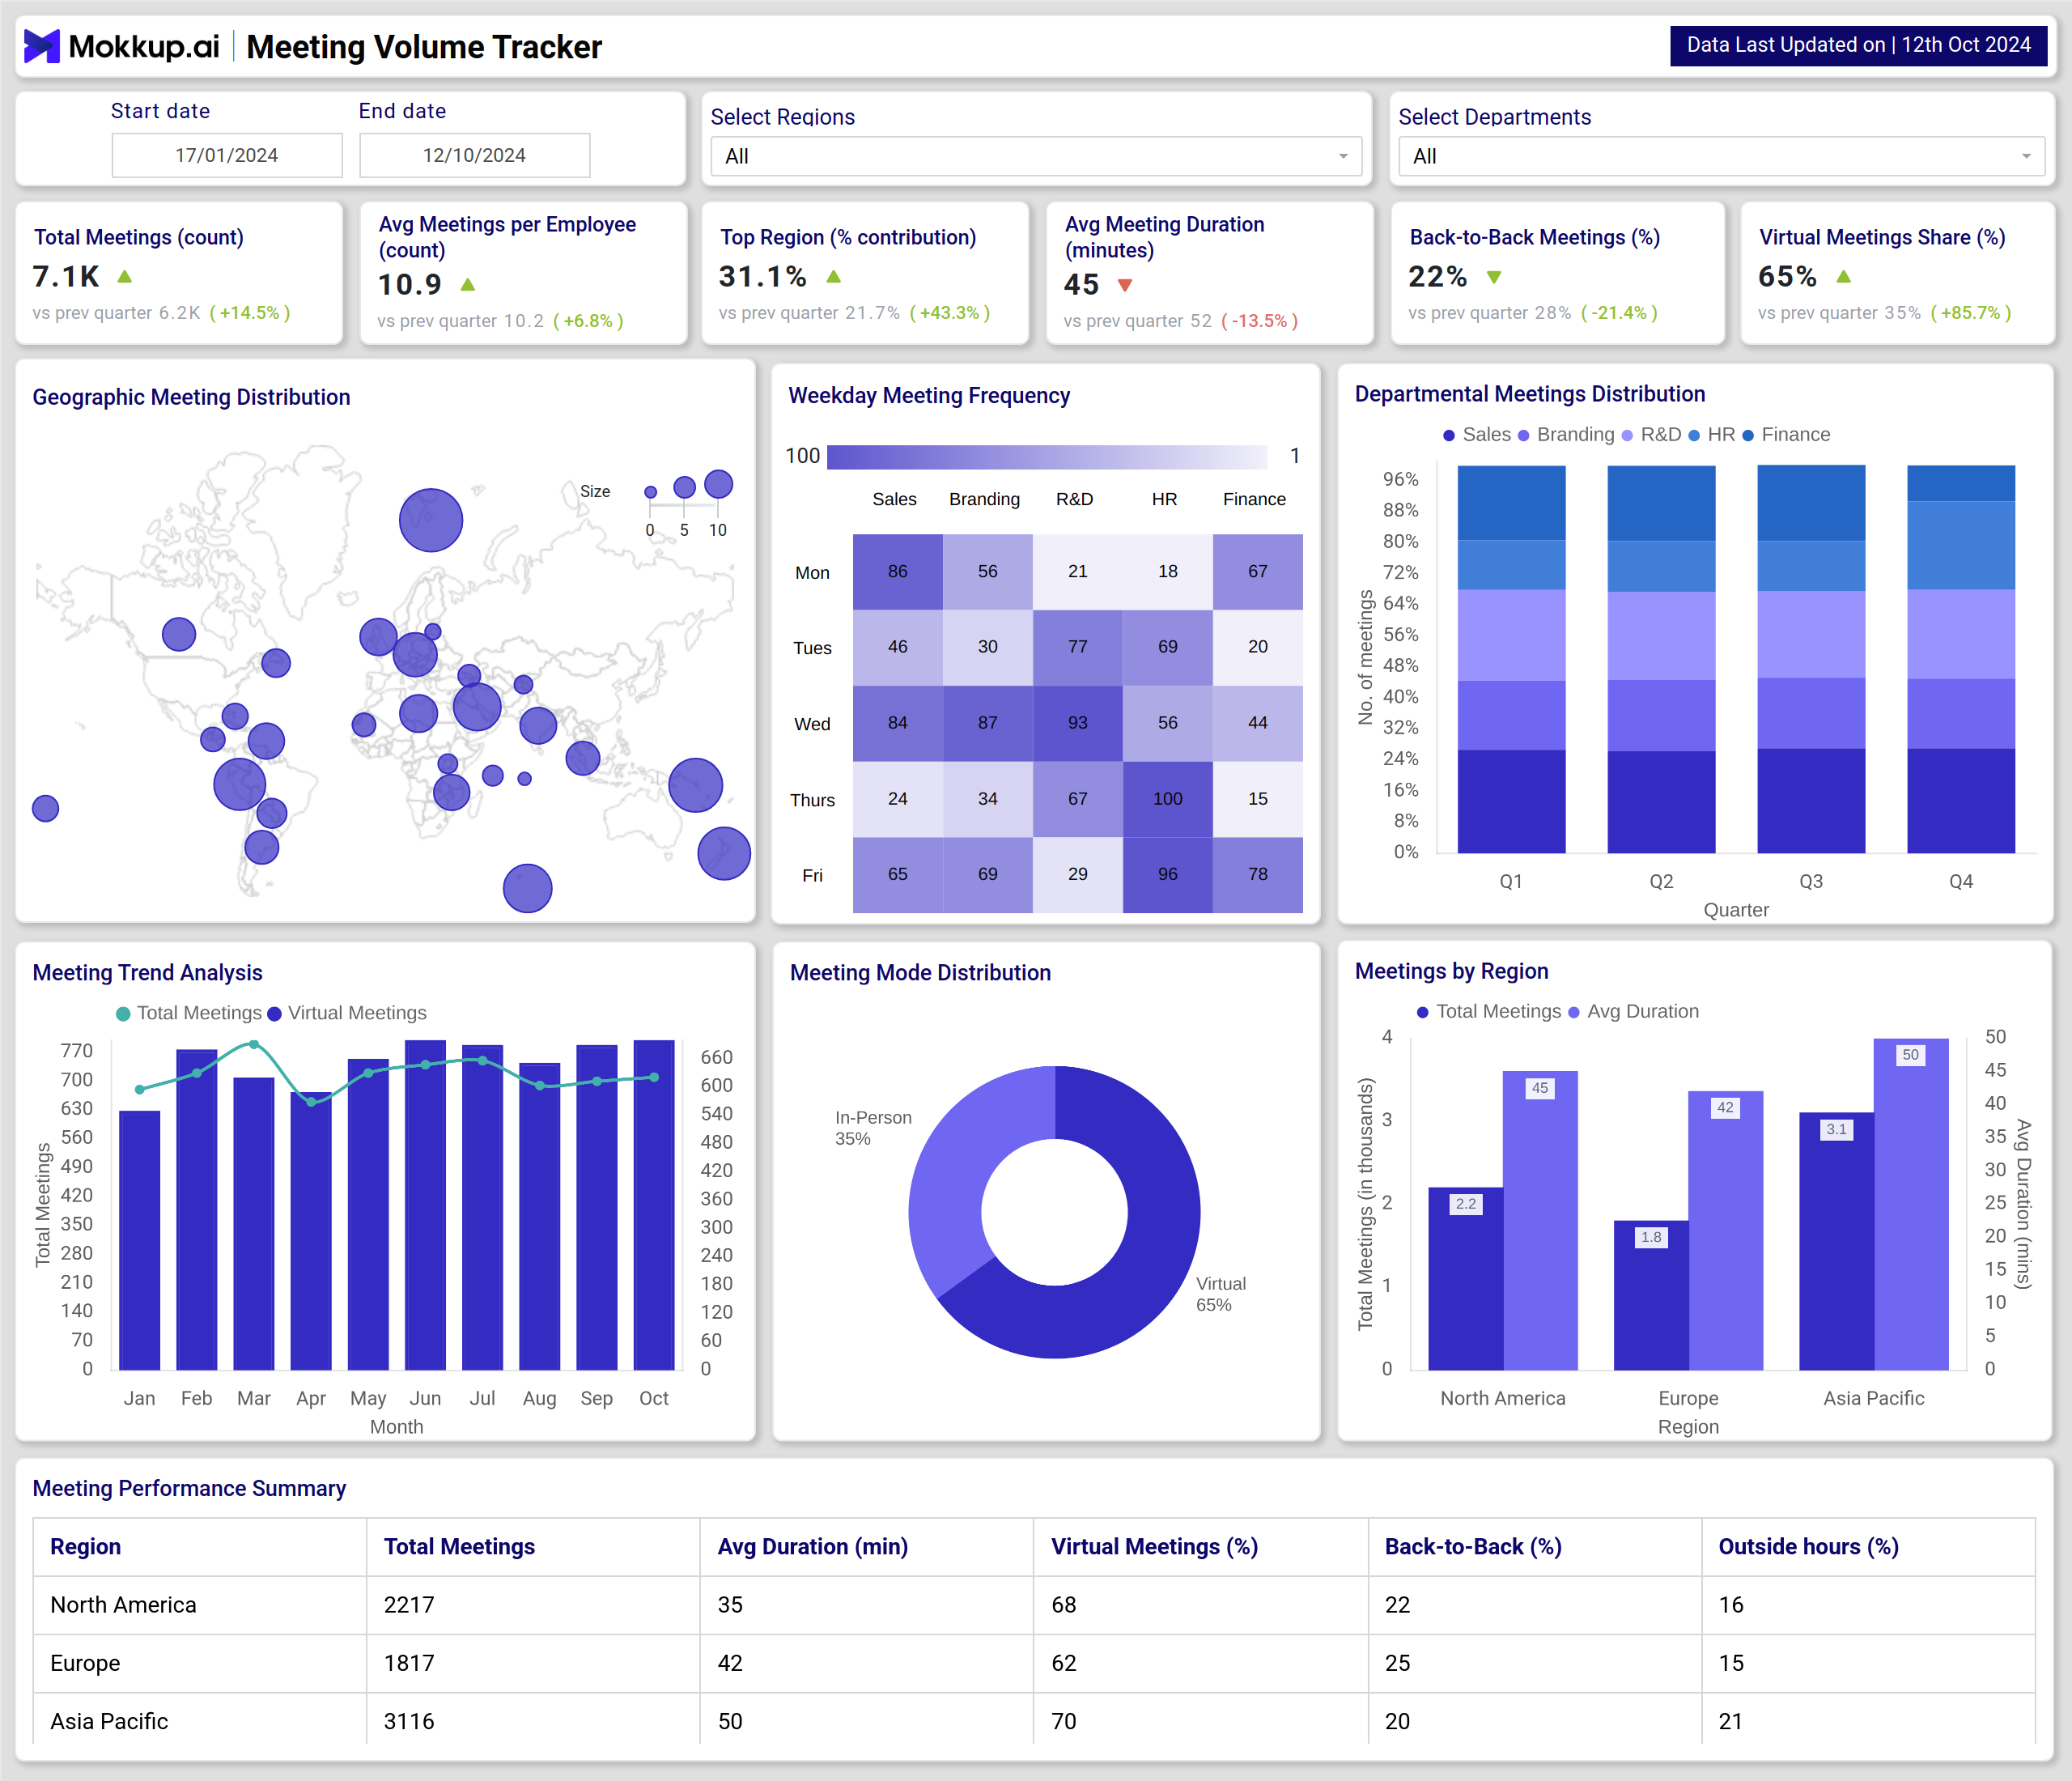
A Meeting Volume Tracker consolidates collaboration data into a structured view by tracking total meetings, average meetings per employee, and regional contributions to overall volume. It combines visual elements such as geographic distribution maps, regional comparison charts, and weekday frequency heatmaps to highlight where and when meetings occur most often. Departmental breakdowns provide clarity on how different business units manage collaboration, while trend charts reveal shifts in total and virtual meetings over time. Advanced features may include outside working hours tracking, and back-to-back meeting percentages, giving organizations the insights needed to optimize scheduling, reduce meeting fatigue, and improve cross-departmental collaboration efficiency.
How to Analyze Data in Meeting Volume Tracker?
Analyzing data in a Meeting Volume Tracker helps you move beyond counting meetings. It uncovers collaboration patterns that directly affect productivity and employee well-being. By looking at trends across regions, departments, and timeframes, companies can make smarter decisions about how collaboration happens.
- Track Regional Meeting Distribution: Compare different regions to identify which areas have the highest meeting volume.
- Measure Departmental Meeting Volume: Determine which departments or teams carry the heaviest meeting schedules.
- Monitor Meeting Duration Trends: Track changes in average meeting length over time to identify increases or decreases.
- Check Virtual vs. In-Person Ratios: Evaluate the balance between remote and in-office meetings.
- Identify Back-to-Back Meeting Load: Spot teams or regions with high percentages of consecutive meetings.
- Analyze Weekday Patterns: Review which days of the week experience peak meeting activity.
- Evaluate After-Hours Impact: Monitor meetings scheduled outside regular working hours to manage workload and work-life balance.
Benefits of Meeting Volume Tracker
Beyond counting meetings, these dashboards provide leaders a powerful lens into how collaboration practices affect employee engagement, productivity, and efficiency. With actionable insights, organizations can redesign meeting culture for better outcomes.
- Provides insights into regional and departmental meeting practices to enhance collaboration.
- Reduces meeting fatigue by highlighting back-to-back sessions and optimizing schedules.
- Supports data-driven decision-making by leveraging KPIs for HR, operations, and leadership strategies.
- Optimizes remote work effectiveness by measuring virtual collaboration across locations.
- Tracks seasonal and quarterly meeting trends to inform proactive schedule adjustments.
KPIs to Track in the Meeting Volume Tracker
When using this dashboard template, focus on KPIs that directly impact productivity and collaboration:
- Total Meetings (count): Tracks the total number of meetings over a specified timeframe.
- Average Meetings per Employee: Measures the average number of meetings attended per employee to assess workload distribution.
- Top Region Contribution (%): Highlights the share of meetings coming from key regions to understand regional meeting patterns.
- Virtual vs. In-Person Meetings (%): Tracks the balance between remote and in-person meetings to evaluate collaboration modes.
- Back-to-Back Meetings (%): Flags consecutive meetings to help reduce scheduling fatigue and improve productivity.
- Meetings Outside Working Hours (%): Identifies meetings scheduled beyond standard working hours to manage work-life balance.
- Departmental Meeting Trend: Breaks down meeting volume by department (R&D, Sales, HR, Finance, etc.) to inform resource allocation.
Together, these KPIs give a clear view of how meetings affect organizational performance. A balanced focus ensures meetings remain effective without overloading employees.
Frequently Asked Questions
Q1. Who should use a Meeting Volume Tracker?
HR, operations, and leadership teams use it to analyze collaboration trends and improve workplace efficiency.
Q2. What makes this dashboard different from a standard meeting tracker?
Unlike basic trackers, it integrates regional and departmental data, visualized through heatmaps, bar charts, trend lines, and distribution graphs.
Q3. Can this dashboard track remote work collaboration?
Yes, it highlights virtual vs. in-person meeting ratios, making it valuable for hybrid and remote work policies.
Q4. Which KPI is most critical for productivity analysis?
While total meetings matter, back-to-back meetings (%) and meeting duration have the biggest impact on employee productivity.
Q5. How often should this dashboard be reviewed?
Most companies review it quarterly to capture trends and adjust policies, though high-volume organizations may prefer a monthly review.