
What is a Boarding School Parent Engagement Dashboard
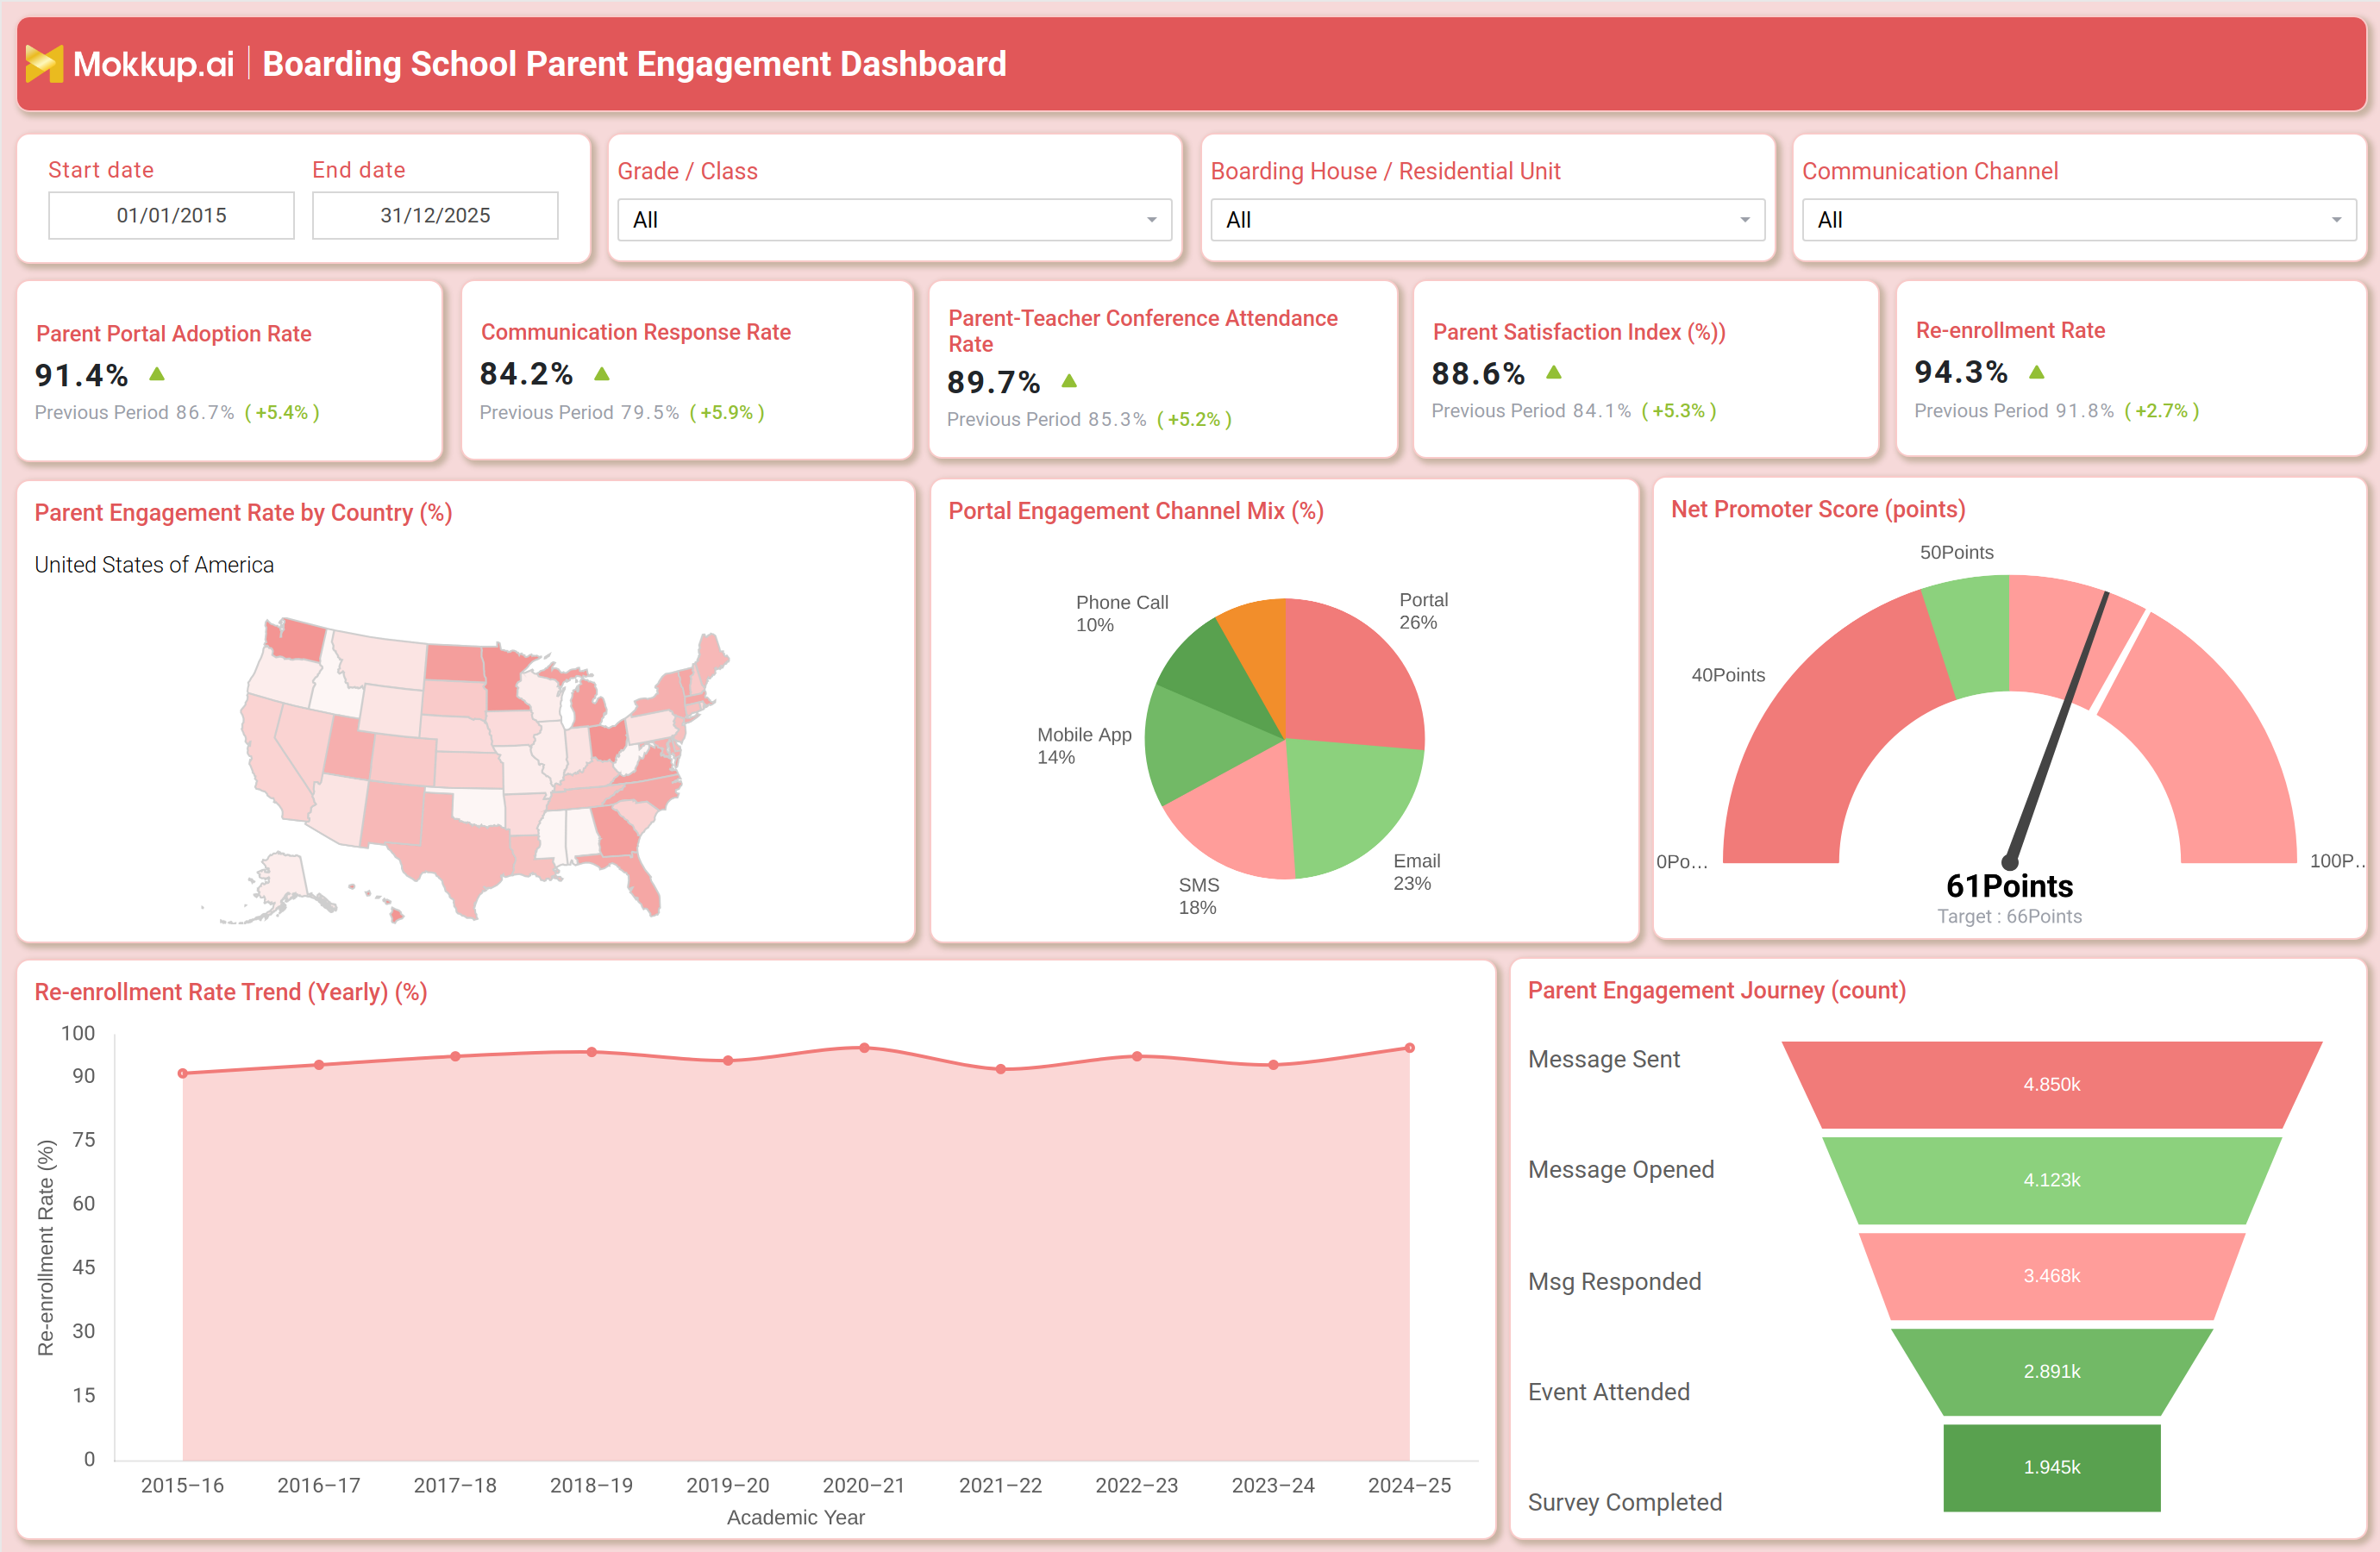
A boarding school parent engagement dashboard template gives residential schools a single view of how well they are communicating with and involving families who often live far from campus. Boarding schools depend on structured communication far more than day schools, since parents cannot walk in for daily updates and instead rely on portals, messaging, and scheduled events to stay informed. This Boarding School Parent Engagement Dashboard brings portal usage, conference attendance, response rates, and re-enrollment trends onto one screen, giving communications and admissions teams a clear read on whether the school is closing that distance. Filters for grade or class, boarding house or residential unit, and communication channel let staff isolate performance for a specific house, cohort, or messaging tool instead of working from a school-wide average. Because it also functions as a parent portal adoption rate tracking tool, it gives IT and admissions leaders a way to justify continued investment in the platforms that keep families connected.
How to Create a Boarding School Parent Engagement Dashboard
You don't need to build your report from scratch; just start with a ready-to-use dashboard template from Mokkup. Add in your data and export it however you like. Here's how to do it:
1. Create or Log in to Your Mokkup Account
Start by signing up on Mokkup.ai using your email. If you already have an account, just log in, and you'll be good to go.
2. Choose and Customize Your Dashboard Template
Find the Boarding School Parent Engagement Dashboard template in the Templates section. Use the drag-and-drop editor to adjust KPIs, edit filters, or add elements based on your data.
3. Export to Your BI Tool
Once your dashboard wireframe is ready, use the BI Tool Export feature to send it directly to Power BI or Tableau for further analysis and enhancements. You can also download the dashboard as a PDF, PNG, or JPEG, embed it on a platform, or invite your team to collaborate.
Note: This is a Pro template. You'll need a Pro subscription on Mokkup to use and customize this dashboard wireframe. Upgrade anytime to unlock full access.
Boarding School Parent Engagement Dashboard Example
A boarding school's communications director opens this dashboard at the start of a term, wanting to know whether families are staying engaged as students settle in, or whether contact is quietly dropping off. The starting point is understanding which houses, grades, or channels show softening engagement before a parent's disengagement turns into a re-enrollment risk. On this screen, the team can trace parent activity across the full engagement funnel, from the moment a message is sent through to whether it is opened, responded to, or converted into event attendance and completed surveys.
Comparing engagement across countries and boarding houses lets staff identify pockets of families who need a different outreach approach, whether that means shifting channel mix toward the methods a segment actually responds to or prioritizing personal outreach ahead of a parent-teacher conference. Communications teams can also weigh sentiment captured through the parent satisfaction index and net promoter score tracking for boarding schools against harder engagement numbers, so a house that looks active on paper but scores poorly on sentiment gets flagged for a closer look.
Together, these views help the school move from reacting to disengaged families after re-enrollment decisions are already made to catching the warning signs earlier in the year. Teams leave the dashboard with a shortlist of houses, channels, or communication touchpoints to prioritize, rather than a stack of disconnected reports.
How to Analyze Data in a Boarding School Parent Engagement Dashboard
Here is how you can analyze data from this dashboard:
- Filter by Grade / Class and Boarding House: Compare parent engagement patterns across different residential units and student groups.
- Track Portal Adoption vs. Response Rate: Compare parent portal adoption with communication response rates to identify channels losing traction.
- Monitor Parent-Teacher Conference Attendance: Identify boarding houses with declining conference participation and turnout.
- Review the Parent Engagement Journey Funnel: See where families drop off between receiving a message and completing a survey.
- Compare Engagement by Country: Identify geographic segments that may benefit from more localized outreach.
- Cross-Check NPS vs. Satisfaction Index: Distinguish overall parent sentiment from actual engagement activity.
- Monitor Re-Enrollment Trends: Compare re-enrollment rates by academic year to understand how engagement efforts may influence retention.
Benefits of a Boarding School Parent Engagement Dashboard
The following are the benefits of using this dashboard:
- Centralizes Engagement Data: Gives communications teams one view of parent engagement instead of pulling data from multiple messaging platforms.
- Simplifies Response Rate Analysis: Supports communication response rate analysis without requiring manual spreadsheet reconciliation.
- Prioritizes Outreach: Helps house parents and administrators use parent-teacher conference attendance trends to identify groups that need more outreach.
- Connects Engagement to Retention: Links portal adoption and conference attendance with re-enrollment trends to support retention planning.
- Improves Channel Performance Visibility: Shows which communication methods families actually use, helping teams make smarter budget allocation decisions.
- Speeds Up Leadership Reporting: Provides a ready-made view of engagement trends by term and academic year for faster reporting.
KPIs to Track in a Boarding School Parent Engagement Dashboard
Key Performance Indicators (KPIs) are measurable values that show how well a school is achieving specific engagement objectives, and this parent portal adoption rate tracking tool anchors its view around six of them:
- Parent Portal Adoption Rate (%): share of parents actively using the school's digital communication portal
- Communication Response Rate (%): percentage of school messages that receive a parent reply within the tracked period
- Parent-Teacher Conference Attendance Rate (%): proportion of scheduled conferences that parents actually attend
- Parent Satisfaction Index (%): aggregated sentiment score from parent feedback on communication and engagement
- Re-enrollment Rate (%): percentage of enrolled students whose families commit to returning the following year.
Frequently Asked Questions
1. What does a boarding school parent engagement dashboard measure?
It measures how actively parents interact with school communication channels, attend conferences and events, and respond to outreach, alongside sentiment indicators like satisfaction and net promoter score. Together, these signals show whether family engagement is strengthening or weakening over a term.
2. How does this dashboard support re-enrollment planning?
The re-enrollment rate trend analysis dashboard view lines up yearly retention against portal adoption, conference attendance, and satisfaction scores. Admissions teams can flag houses or cohorts where declining engagement puts re-enrollment at risk before decisions are finalized.
3. Can I customize this dashboard for my school's boarding houses?
Yes. The Mokkup template lets you edit filters for grade, boarding house, and communication channel, and adjust KPI tiles to match your own data before exporting to Power BI or Tableau.