
What is a Special Education Operations Dashboard?
The Special Education Operations Dashboard is a reporting template built for special education directors, compliance coordinators, and school administrators who need one place to monitor how special education services are being delivered across a district. It brings together IEP compliance, service delivery, placement distribution, and per-pupil spending data so operations teams don't have to pull separate reports from student information systems, billing platforms, and compliance trackers. Instead of digging through spreadsheets to answer basic questions about program health, staff can open a single special education operations dashboard and immediately see where students are being served, how quickly IEPs are being processed, and how funding is being allocated across campuses. Because the dashboard filters by campus, program area, and disability category, teams responsible for different parts of the special education program can each view the segment relevant to their role without losing sight of district-wide totals.
How to Create a Special Education Operations Dashboard
You don't need to build your report from scratch—just start with a ready-to-use dashboard template from Mokkup. Add in your data and export it however you like. Here's how to do it:
1. Create or Log in to Your Mokkup Account
Start by signing up on Mokkup.ai using your email. If you already have an account, just log in, and you'll be good to go.
2. Choose and Customize Your Dashboard Template
Find the Special Education Operations Dashboard template in the Templates section. Use the drag-and-drop editor to adjust KPIs, edit filters, or add elements based on your data.
3. Export to Your BI Tool
Once your dashboard wireframe is ready, use the BI Tool Export feature to send it directly to Power BI or Tableau for further analysis and enhancements. You can also download the dashboard as a PDF, PNG, or JPEG, embed it on a platform, or invite your team to collaborate.
Note: This is a Pro template. You'll need a Pro subscription on Mokkup to use and customize this dashboard wireframe. Upgrade anytime to unlock full access.
Special Education Operations Dashboard Example
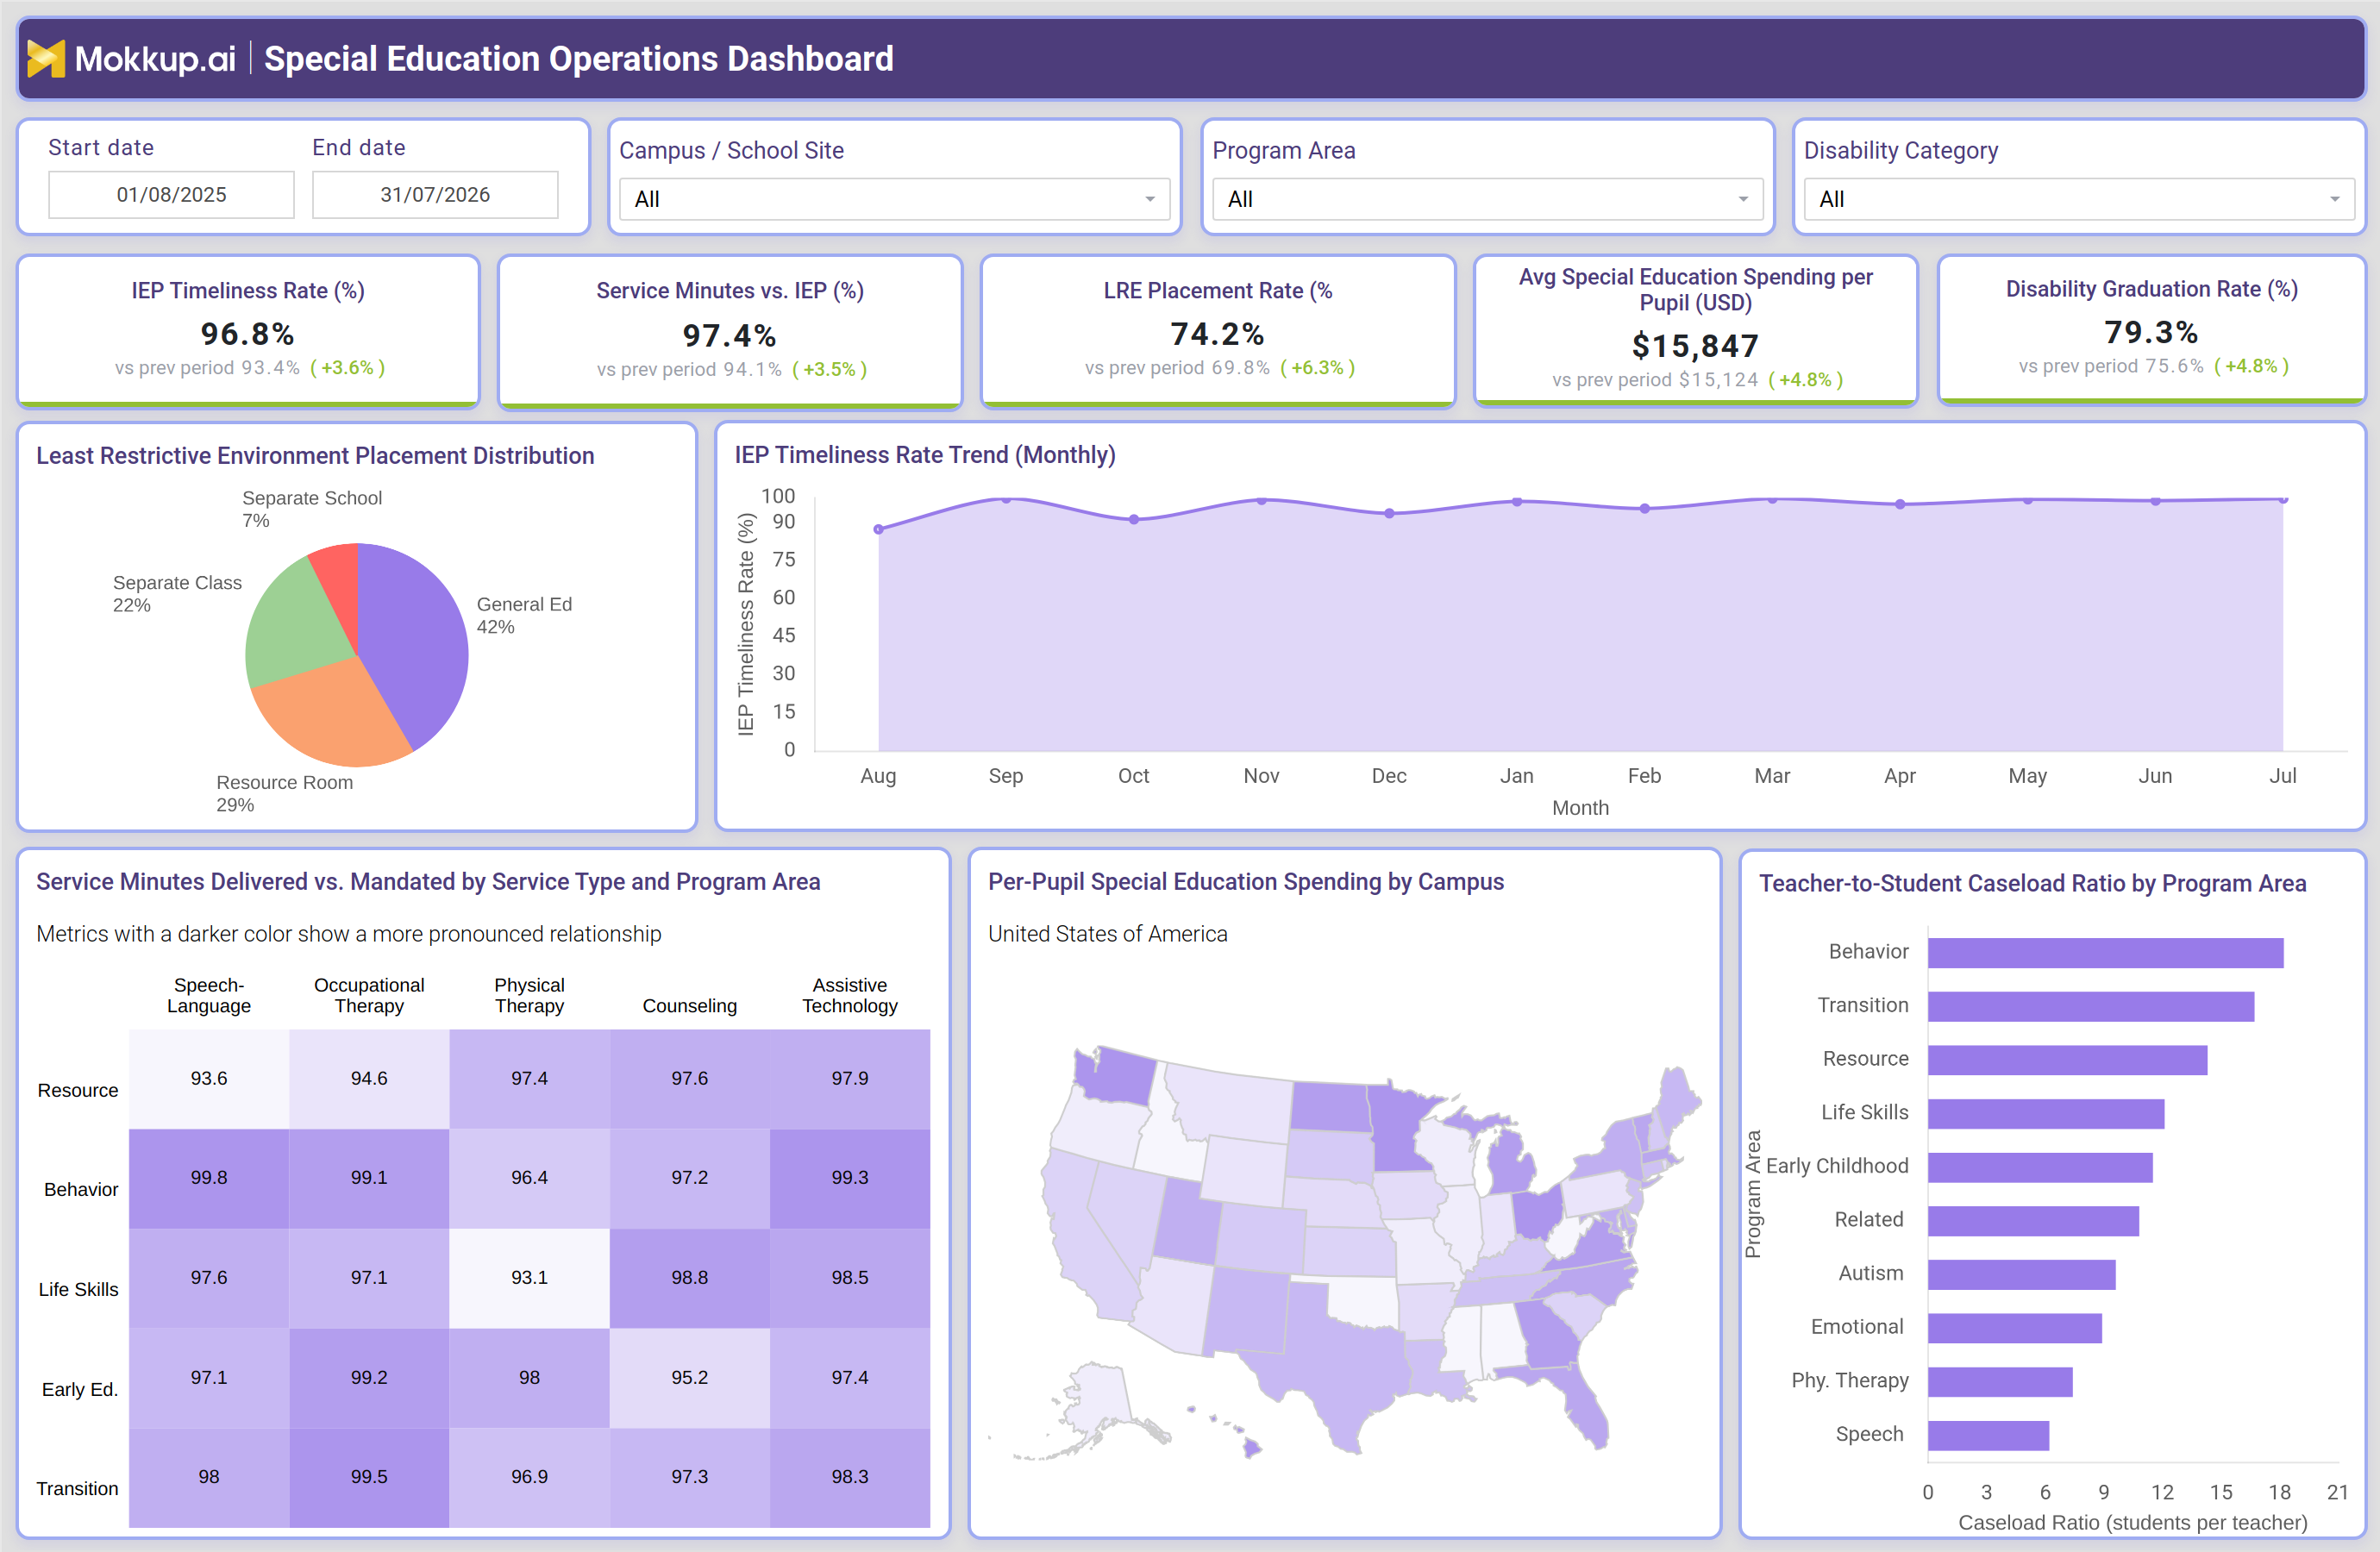
A special education director typically opens this dashboard at the start of a compliance review cycle or ahead of a board meeting, looking to understand whether the program is meeting state and federal timelines and whether resources are being used well. The question driving that first look is rarely about a single number — it is about whether IEP processing, service delivery, and placement decisions are trending in the right direction across the district as a whole.
From the top of the dashboard, the director can gauge whether IEP timeliness is holding steady against compliance deadlines and whether contracted service minutes are actually being delivered against what each IEP mandates. If service minutes start slipping for a particular therapy type or program area, the team can trace that gap down to the specific combination of service and program driving it, rather than treating it as a district-wide problem. Placement data feeds a least restrictive environment placement analysis that lets coordinators assess whether students are being served appropriately and whether that mix is shifting in a way that needs review. Spending patterns by campus help finance and operations leads compare where per-pupil investment is concentrated and flag campuses carrying a caseload out of step with their spending.
Together, this lets special education leadership move from reactive compliance checks to proactive program management, catching timeliness slippage before it becomes a finding, balancing caseloads across program areas, and defending budget decisions with a clear view of where spending and outcomes align.
How to Analyze Data in a Special Education Operations Dashboard
Here is how you can analyze data from this dashboard:
- Compare IEP Timeliness: Compare the IEP Timeliness Rate with the previous period to catch early signs of compliance drift.
- Analyze Service Delivery: Cross-check Service Minutes vs. IEP with the service-by-program heatmap to identify therapy areas falling behind requirements.
- Analyze LRE Placements: Review Least Restrictive Environment Placement Distribution to identify shifts in placement patterns before annual reviews.
- Compare Spending by Campus: Filter by campus or school site to compare per-pupil special education spending across locations.
- Monitor Caseload Ratios: Use the Program Area filter to compare Teacher-to-Student Caseload Ratios across programs.
- Track IEP Timeliness Trends: Review monthly IEP Timeliness Rate trends to confirm improvements are sustained over time.
- Compare Disability Categories: Segment graduation and placement outcomes by disability category to identify differences across student groups.
Benefits of a Special Education Operations Dashboard
The following are the benefits of using this dashboard:
- Centralize IEP & Service Tracking: Replace manual tracking with a single special education operations dashboard.
- Track Spending per Pupil: Monitor special education spending across campuses to support budget planning.
- Identify Service Delivery Gaps: Surface gaps by program area before they become compliance findings.
- Analyze LRE Placements: Review least restrictive environment placement patterns to support LRE decisions across campuses.
- Support Staffing Requests: Use caseload data by program area to provide evidence for staffing needs.
- Streamline Compliance Reporting: Reduce the time spent preparing reports for board and state reviews.
KPIs to Track in a Special Education Operations Dashboard
Key Performance Indicators (KPIs) are the measurable metrics teams track to gauge whether a program is meeting its goals — in a special education operations dashboard, they turn raw service and compliance data into indicators leadership can act on.
- IEP Timeliness Rate: share of IEPs completed within required compliance deadlines.
- Service Minutes vs. IEP: percentage of contracted service minutes actually delivered against what each IEP mandates.
- LRE Placement Rate: percentage of students served in the least restrictive environment appropriate to their needs.
- Avg Special Education Spending per Pupil: average dollar investment per student receiving services, a core input for special education spending per pupil tracking across campuses.
- Disability Graduation Rate: percentage of students with disabilities completing their program on schedule, a key measure for any disability graduation rate tracking dashboard.
Frequently Asked Questions
1. What data does the Special Education Operations Dashboard track?
It tracks IEP timeliness, service minutes delivered against mandates, least restrictive environment placement, per-pupil spending, and disability graduation rate, giving leadership a single disability graduation rate tracking dashboard view across the district.
2. Who should use this dashboard?
Special education directors, compliance coordinators, and campus administrators use it to monitor service delivery and compliance, applying it as an IEP timeliness rate tracking tool ahead of state reporting deadlines.
3. Can I customize this dashboard for my district?
Yes, use Mokkup's drag-and-drop editor to adjust KPIs, filters, and layout to match your district's program areas and campuses before exporting the special education operations dashboard to your BI tool.