
What is an International School University Placement Dashboard
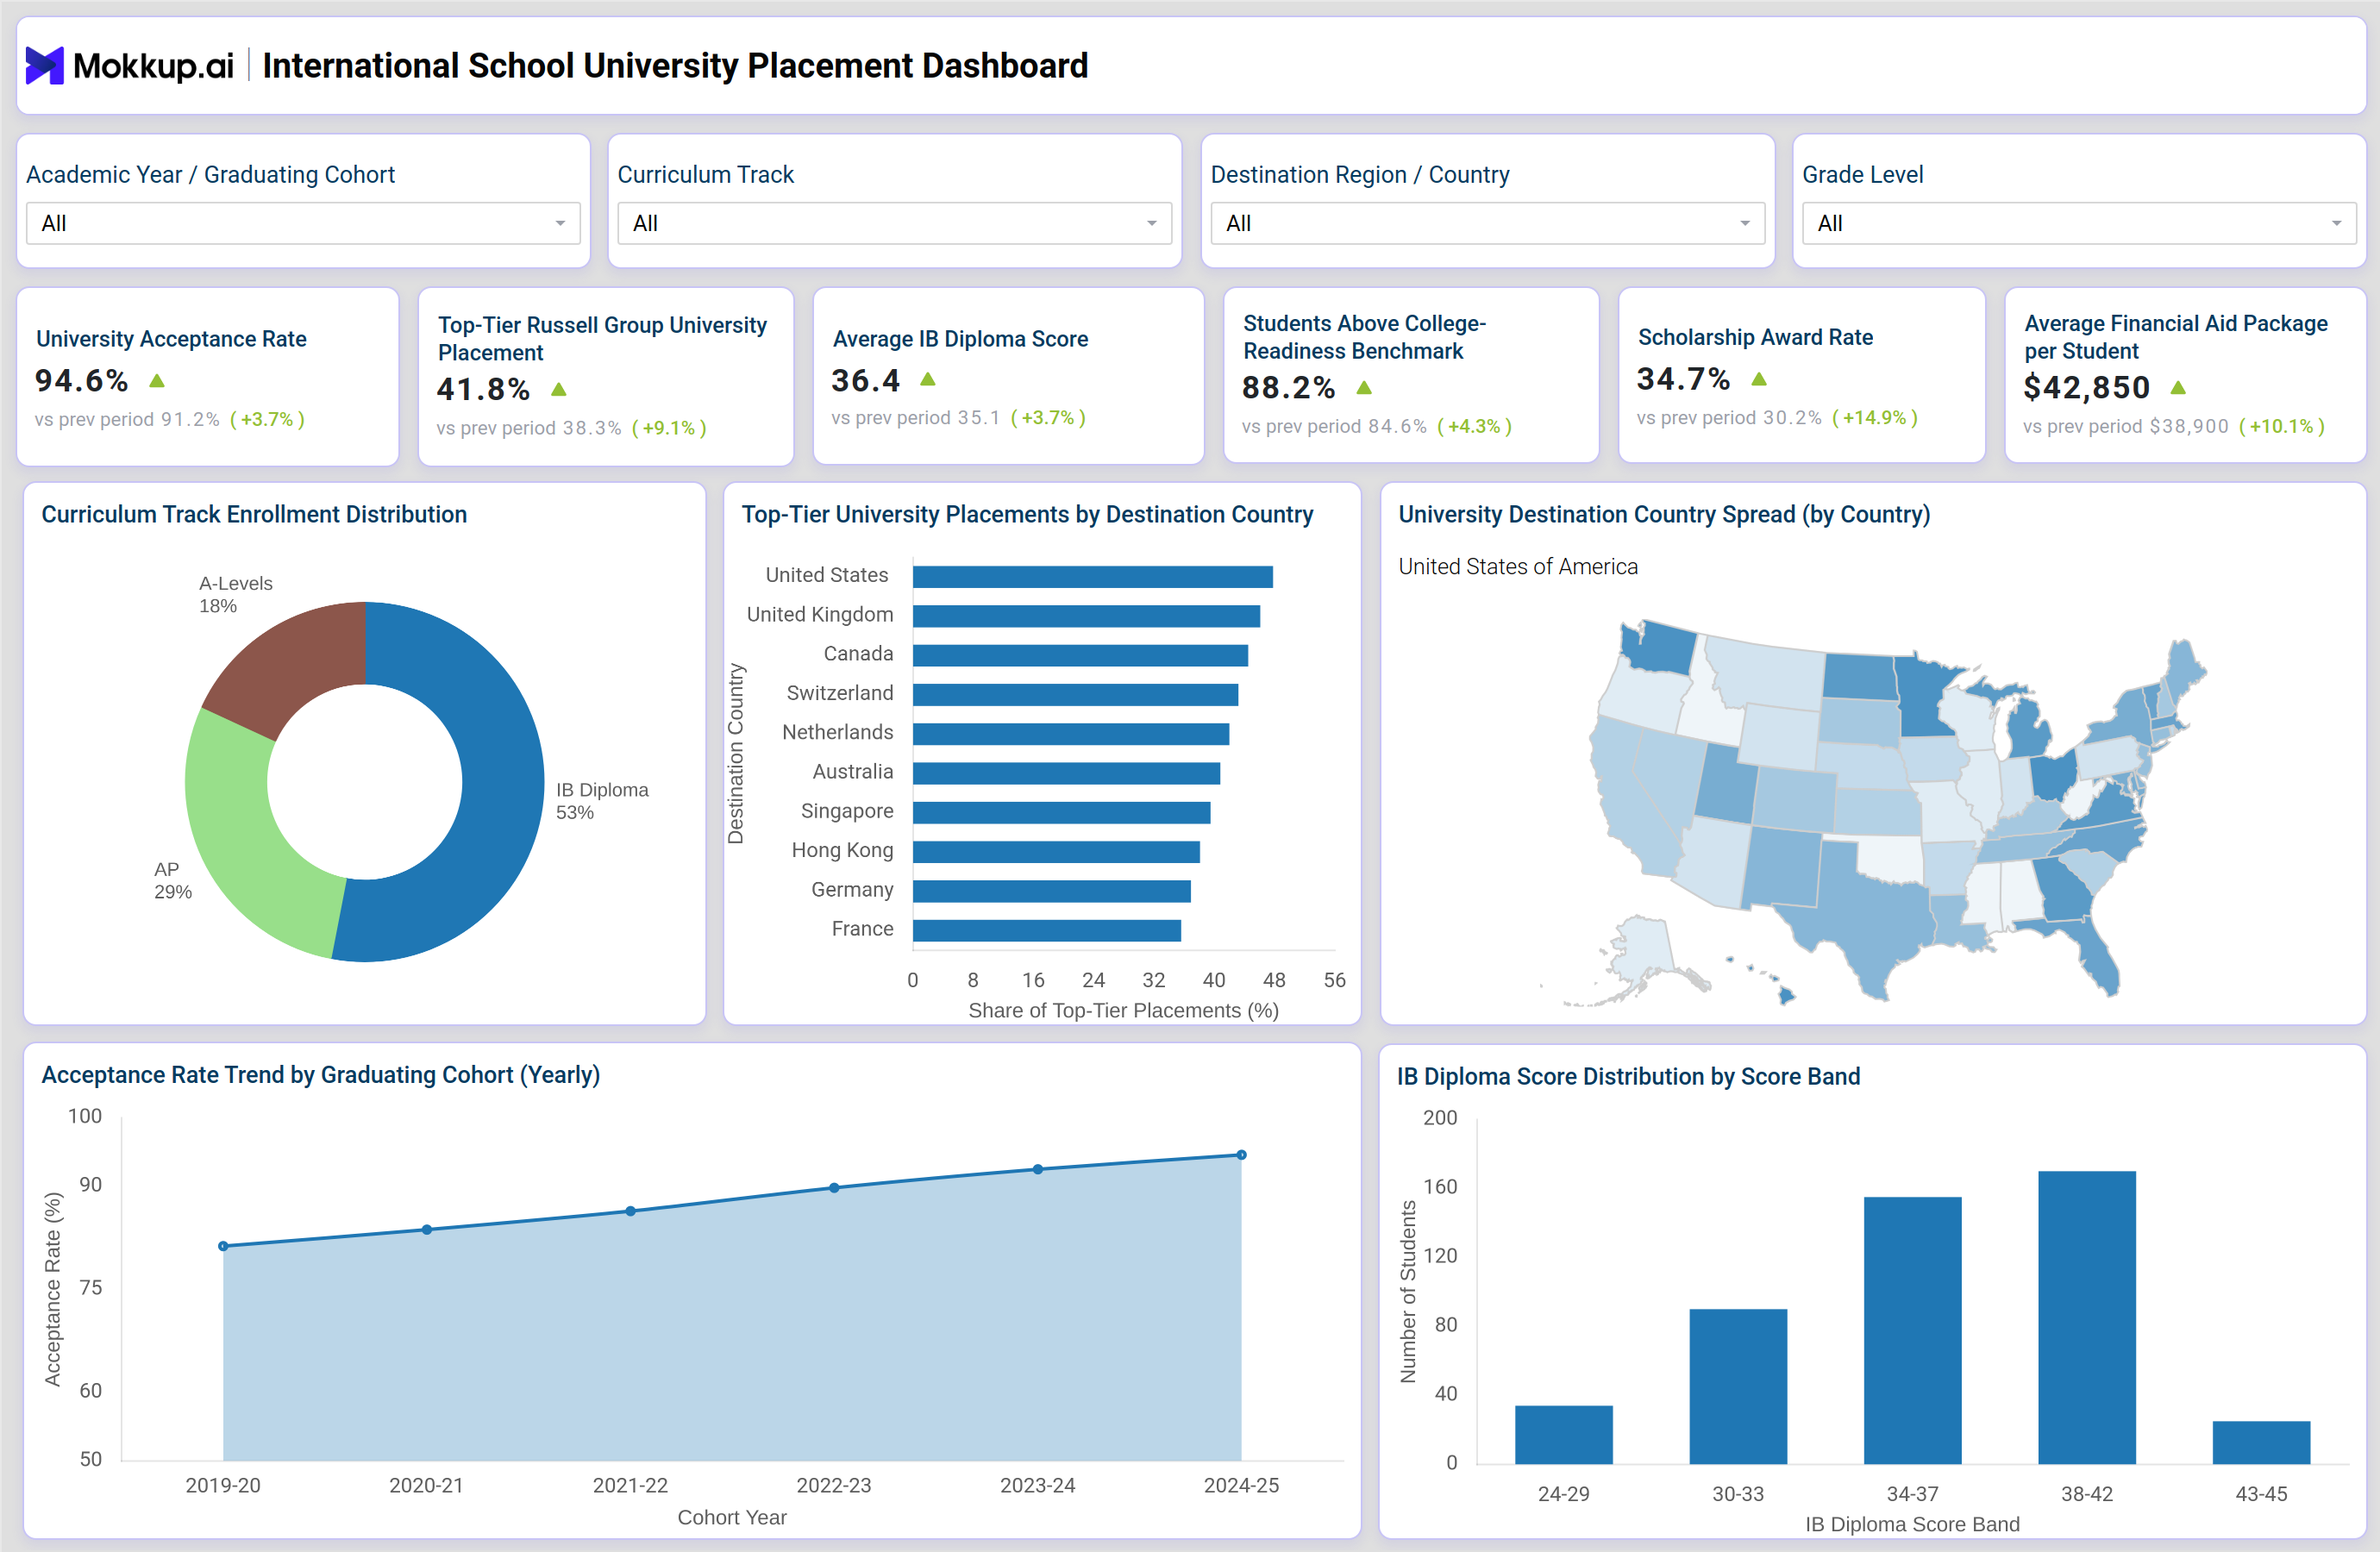
The International School University Placement Dashboard is a wireframe template built for college counseling teams at international schools to track how graduating cohorts perform in the university admissions process. It functions as a college counseling dashboard for international schools that need one place to review acceptance outcomes, curriculum performance, and financial aid activity instead of piecing together separate spreadsheets.
As an international school university placement dashboard, it is structured around schools that send students into multiple countries and curriculum systems, including IB Diploma, AP, and A-levels programs. Counseling teams rely on it for university acceptance rate tracking for international schools, comparing how each graduating cohort measures up against prior years and where destination country interest is shifting. Filters for academic year, curriculum track, destination region, and grade level sit across the top of the layout, so the same template supports cohort-level review, curriculum-specific analysis, or early grade-level planning conversations ahead of application season.
How to Create an International School University Placement Dashboard
You don't need to build your report from scratch-just start with a ready-to-use dashboard template from Mokkup. Add your data and export it as needed. Here's how to do it:
1. Create or Log in to Your Mokkup Account
Start by signing up on Mokkup.ai using your email. If you already have an account, just log in, and you'll be good to go.
2. Choose and Customize Your Dashboard Template
Find the International School University Placement Dashboard template in the Templates section. Use the drag-and-drop editor to adjust KPIs, edit filters, or add elements based on your data.
3. Export to Your BI Tool
Once your dashboard wireframe is ready, use the BI Tool Export feature to send it directly to Power BI or Tableau for further analysis and enhancements. You can also download the dashboard as a PDF, PNG, or JPEG, embed it on a platform, or invite your team to collaborate.
Note: This is a Pro template. You'll need a Pro subscription on Mokkup to use and customize this dashboard wireframe. Upgrade anytime to unlock full access.
International School University Placement Dashboard Example
A university counselor at an international school opens this dashboard ahead of a placement review meeting to answer one question: how is this year's graduating cohort tracking against previous cohorts, and where does counseling attention need to focus before application deadlines close? Filtering by academic year or curriculum track lets the counselor isolate a specific graduating class or compare how IB Diploma, AP, and A-Levels students are performing against one another, rather than treating the whole school as a single group.
From there, counselors can identify which destination countries and universities are absorbing the largest share of top-tier placements, effectively supporting top-tier university placement tracking by country before advising sessions begin. If one curriculum track is producing stronger outcomes, or if placements are concentrating in a handful of destination countries, the counseling team can adjust how it advises students earlier in the process.
Working through the IB diploma score distribution analysis tool alongside acceptance outcomes also helps teams recognize whether students are clearing the thresholds top universities expect, so support can be directed toward middle-band students before final exams. Scholarship and financial aid patterns surface in the same view, giving counselors a way to gauge whether affordability is shaping where students choose to apply. The outcome is a counseling team that walks into placement reviews, parent meetings, and board updates with a clear, defensible view of how the school is performing on university outcomes, rather than a judgment based on last year's anecdotes.
How to Analyze Data in an International School University Placement Dashboard
Here is how you can analyze data from this dashboard:
- Filter by Academic Year / Graduating Cohort: Focus on one graduating class before comparing outcomes.
- Segment by Curriculum Track: Compare placement performance across IB Diploma, AP, and A-Levels.
- Apply Destination Region / Country filter: Narrow the analysis to a specific market.
- Use the Grade Level filter: Review early placement indicators before graduation.
- Track Acceptance Rate Trend: Compare cohorts to identify multi-year placement momentum.
- Analyze IB Diploma Score Distribution: See how many students meet top-university score thresholds.
- Track Top-Tier University Placements: Identify where scholarship-caliber placements are concentrated by country.
- Compare Curriculum Enrollment vs. Placements: Assess whether curriculum choices align with placement outcomes.
- Review University Destination Country Spread: Identify emerging markets where students are increasingly enrolling.
Benefits of an International School University Placement Dashboard
The following are the benefits of using this dashboard:
- Centralizes Placement Data: Brings acceptance rates, IB Diploma scores, and financial aid data into one international school university placement dashboard.
- Supports College Counseling: Gives counselors one shared view instead of relying on scattered spreadsheets.
- Tracks Acceptance Rates: Monitors university acceptance rates across multiple graduating cohorts.
- Highlights Placement Trends: Shows which destination countries and curriculum tracks contribute to top-tier placements.
- Monitors Scholarship Awards: Tracks scholarship award rates alongside academic and placement outcomes.
- Creates a Shared View: Gives counselors, administrators, and the board the same reference point for placement performance.
- Enables Role-Based Analysis: Adjustable filters let each team focus on the data relevant to their responsibilities.
- Supports Easy Reporting: Exports dashboard views to Power BI, Tableau, PDF, or image formats for external reporting.
KPIs to Track in an International School University Placement Dashboard
The following key KPIs can be tracked by using this dashboard:
- University Acceptance Rate: measures the share of graduating students admitted to at least one university they applied to.
- Top-Tier Russell Group University Placement: tracks the percentage of students placed into Russell Group-caliber or equivalent top-tier institutions.
- Average IB Diploma Score: reflects the mean IB Diploma point score achieved across the graduating cohort.
- Students Above College-Readiness Benchmark: shows the proportion of students meeting the academic threshold associated with college readiness.
- Scholarship Award Rate: supports scholarship award rate monitoring for schools by tracking the percentage of students receiving a scholarship offer.
- Average Financial Aid Package per Student: captures the average value of financial aid awarded per student across the cohort.
Frequently Asked Questions
1. What is an International School University Placement Dashboard used for?
It is used by college counseling teams to track university acceptance outcomes, IB Diploma performance, and financial aid trends for a graduating cohort in a single view. It replaces manual spreadsheet reporting during placement reviews and board updates.
2. Which curriculum tracks does this dashboard support?
The dashboard covers IB Diploma, AP, and A-Levels tracks, letting counselors compare placement outcomes across curriculum types. Filters allow the view to be narrowed to a single track when needed.
3. Can this dashboard template be customized for a specific school?
Yes. As a college counseling dashboard for international schools, it can be customized in Mokkup.ai's editor to reflect a school's own KPIs, curriculum tracks, and destination countries before exporting to Power BI or Tableau.