
What is a Special Education Financial Performance Dashboard
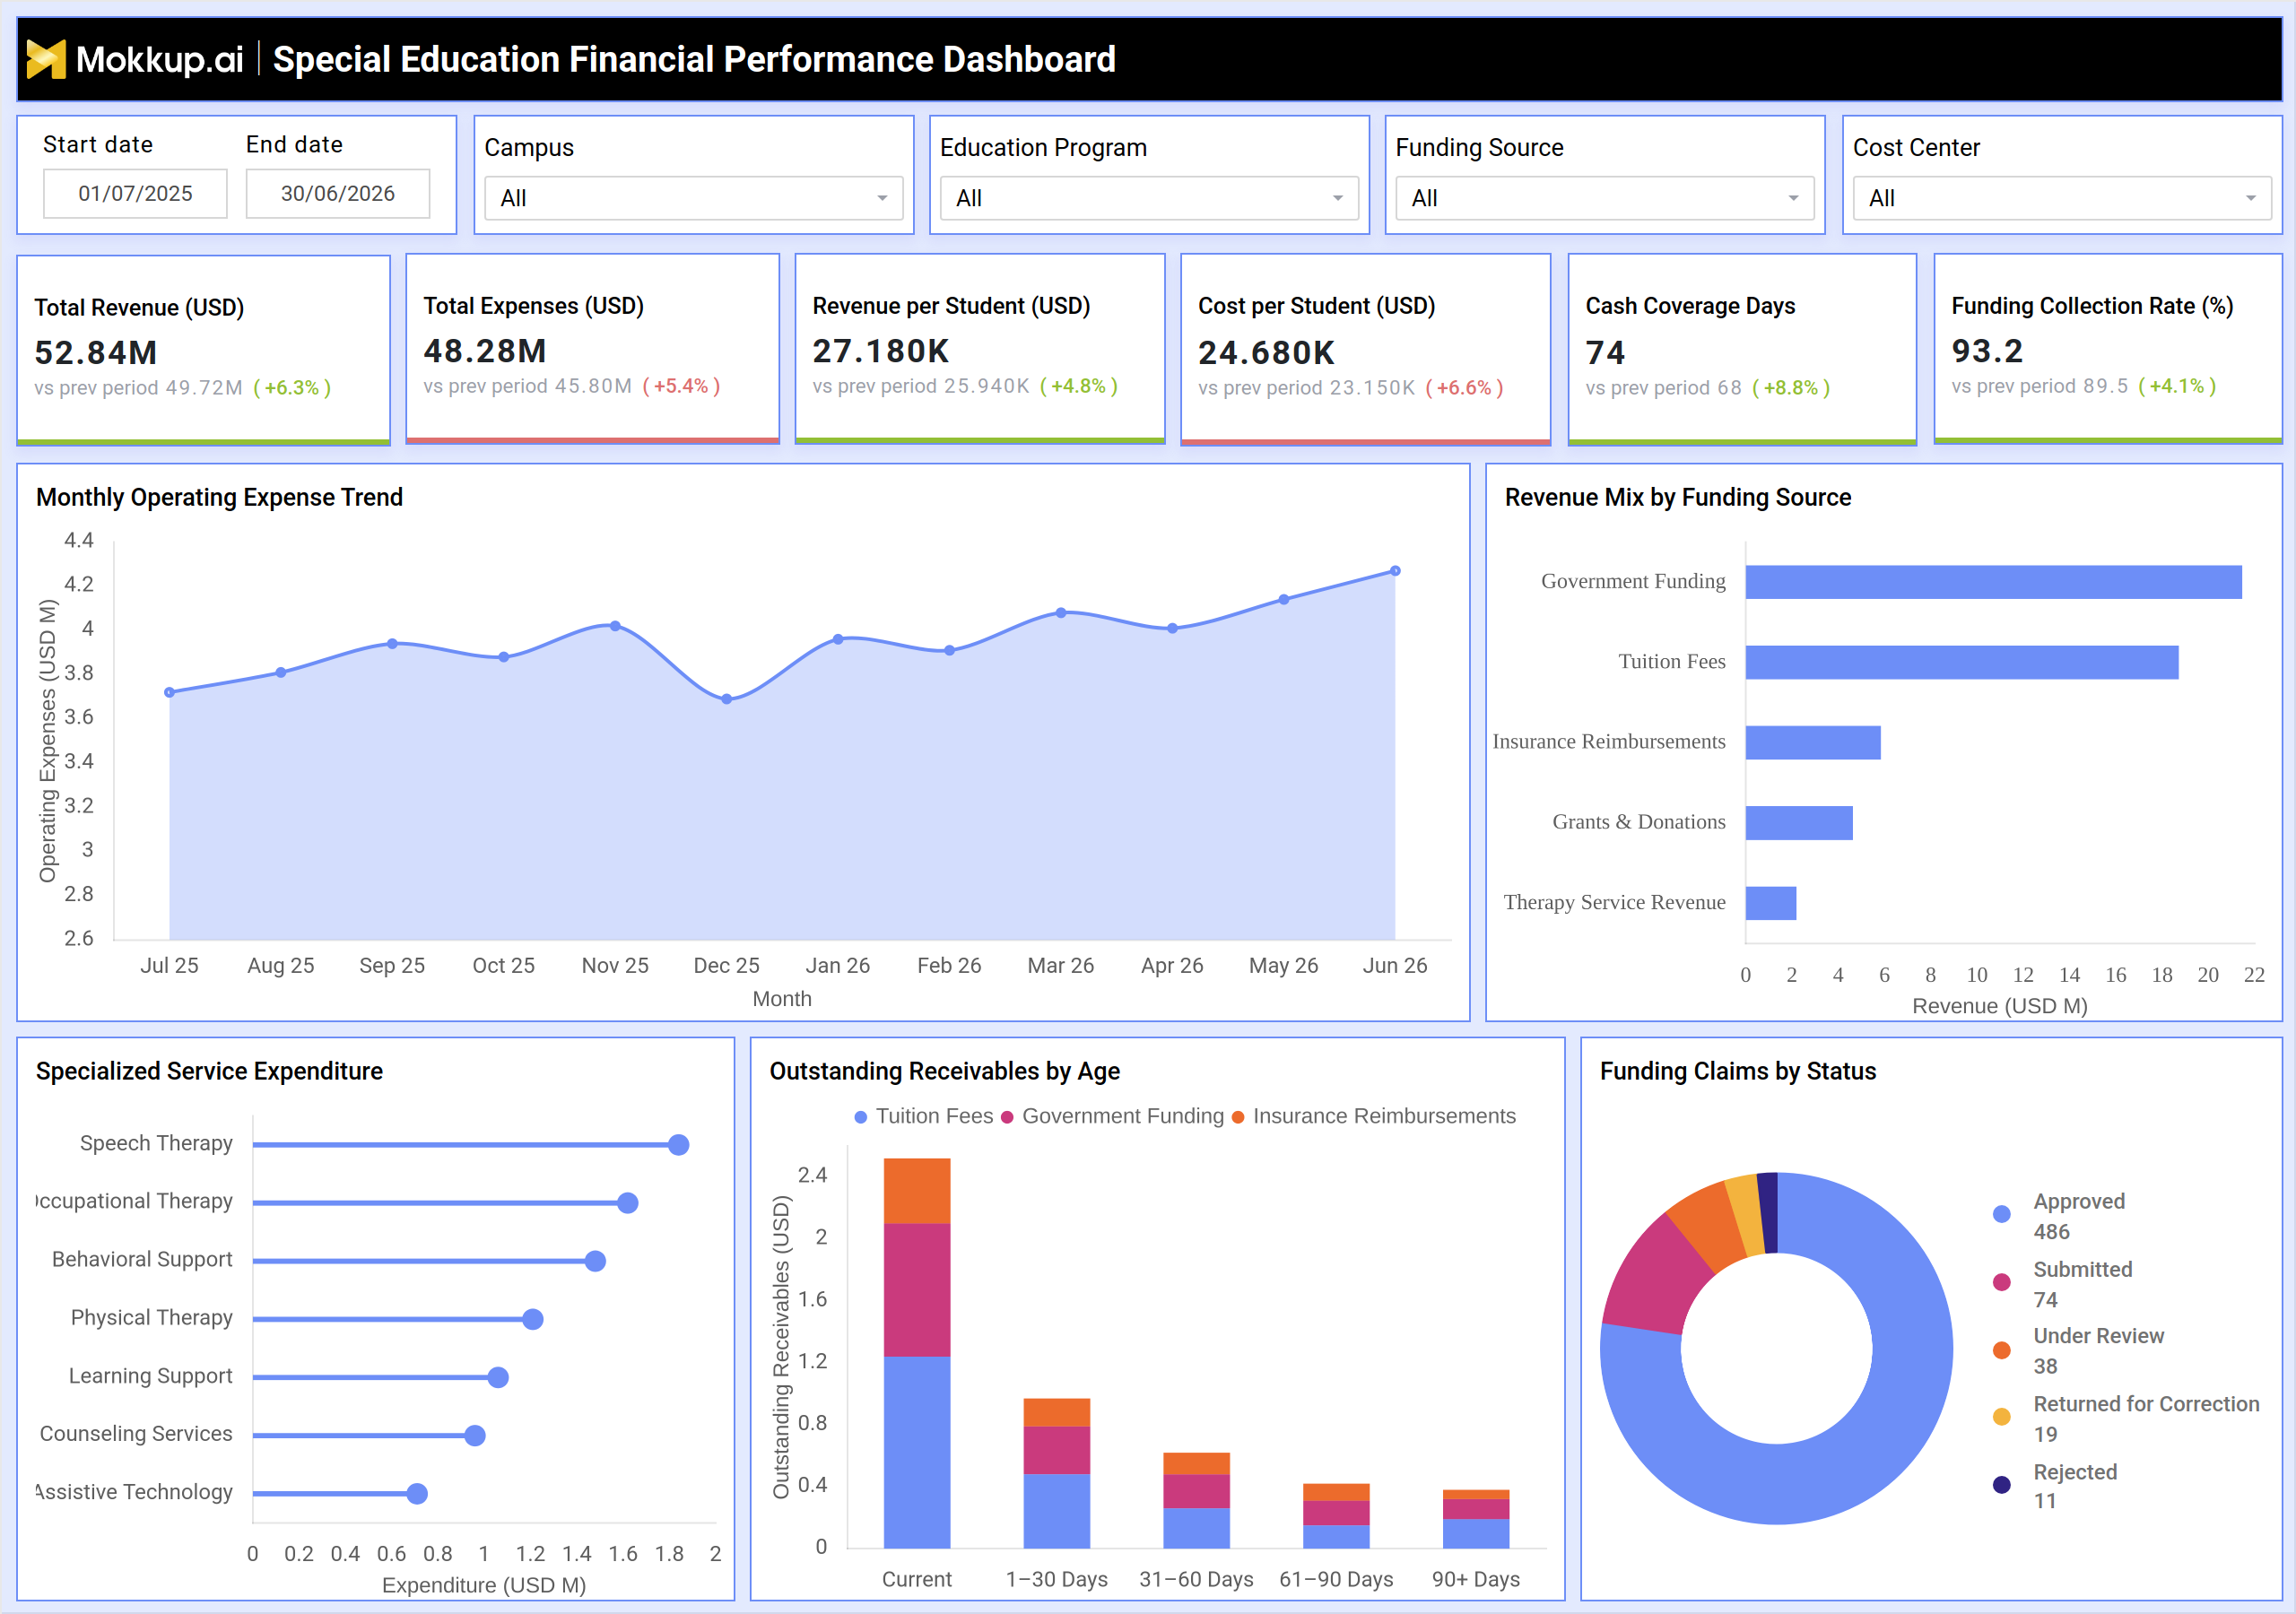
The Special Education Financial Performance Dashboard gives special education administrators and finance teams one connected view of revenue, expenses, and funding health across every campus and program. It brings together total revenue, total expenses, revenue per student, cost per student, cash coverage days, and funding collection rate, supporting special education school financial performance tracking without pulling data from separate tuition, government, and insurance spreadsheets. Because special education programs depend on multiple funding streams, the dashboard connects revenue mix by funding source with specialized service expenditure, so finance teams can compare spend on speech therapy, occupational therapy, behavioral support, physical therapy, learning support, counseling services, and assistive technology against the revenue collected to support it. Filters for campus, education program, funding source, and cost center let a single-campus program lead or a district finance director narrow the view to the segment they own, which is exactly what special education funding claims tracking requires when claims move through government and insurance channels at different speeds.
How to Create a Special Education Financial Performance Dashboard
You don't need to build your report from scratch—just start with a ready-to-use dashboard template from Mokkup. Add in your data and export it however you like. Here's how to do it:
1. Create or Log in to Your Mokkup Account
Start by signing up on Mokkup.ai using your email. If you already have an account, just log in, and you'll be good to go.
2. Choose and Customize Your Dashboard Template
Find the Special Education Financial Performance Dashboard Template in the Templates section. Use the drag-and-drop editor to adjust KPIs, edit filters, or add elements based on your data.
3. Export to Your BI Tool
Once your dashboard wireframe is ready, use the BI Tool Export feature to send it directly to Power BI or Tableau for further analysis and enhancements. You can also download the dashboard as a PDF, PNG, or JPEG, embed it on a platform, or invite your team to collaborate.
Note: This is a Pro template. You'll need a Pro subscription on Mokkup to use and customize this dashboard wireframe. Upgrade anytime to unlock full access.
Special Education Financial Performance Dashboard Example
A special education finance director opens this dashboard at the start of a budget cycle to understand whether revenue collection is keeping pace with rising program costs. The filter row lets them isolate a single campus, education program, funding source, or cost center before reviewing anything else, so the numbers that follow always reflect the segment they are accountable for that day. On the overview, leadership can compare how total revenue and total expenses are trending against the prior period and gauge school funding collection rate tracking to see whether outstanding claims are being converted into cash quickly enough to keep operations funded. Finance teams can also track cash coverage days to judge how many days of expenses the school would sustain if incoming funding slowed, which shapes decisions on when to draw down reserves versus press funding agencies for faster payment.
Deeper in the dashboard, program administrators can identify which specialized services are consuming the largest share of the budget and weigh that against the funding sources paying for them, prioritizing where to renegotiate insurance reimbursement rates or seek additional grant support. Planners can also review outstanding receivables aging analysis for schools by funding source, so a claim sitting in the 60-90 day bucket gets escalated before it becomes a bad debt risk, and they can watch funding claims move from submitted through approved so bottlenecks in the review or correction stage get addressed early. Together, these views help special education finance teams move from reactive bookkeeping to proactive funding management, giving them the visibility to protect service delivery for students while keeping the school financially sustainable across every funding source it depends on.
How to Analyze Data in a Special Education Financial Performance Dashboard
Here is how you can analyze data from this dashboard:
- Compare Revenue vs. Expenses: Review monthly revenue and expenses together to confirm the school is operating within its funding limits.
- Analyze Revenue Mix: Break down revenue by funding source to understand the balance between government funding and tuition fees.
- Monitor Operating Expenses: Track monthly expense trends to identify cost spikes before they compound across the fiscal year.
- Analyze Therapy Service Expenditure: Compare spending across speech, occupational, physical, and behavioral support services.
- Segment Outstanding Receivables: Review receivables by age and funding source to identify claims approaching the 90+ day risk window.
- Track Funding Claims by Status: Identify where claims are getting delayed between submission, review, and approval.
- Filter by Campus / Program / Funding Source: Isolate financial performance for a specific campus, education program, funding source, or cost center.
- Compare Revenue vs. Cost per Student: Track both metrics together to assess whether program economics are improving.
Benefits of a Special Education Financial Performance Dashboard
The following are the benefits of using this dashboard:
- Centralizes Revenue Data: Brings tuition, government funding, insurance, grants, and therapy revenue into one financial view.
- Monitors Revenue per Student: Tracks special education revenue per student to help leaders assess program-level economics.
- Analyzes Specialized Service Costs: Breaks down therapy and support service costs by category to guide budget decisions.
- Improves Funding Collection: Highlights aging receivables early to reduce the risk of write-offs.
- Supports Role-Based Analysis: Gives campus, program, funding source, and cost center owners a filtered view tailored to their responsibilities.
- Strengthens Funding Requests: Helps finance teams support grant and reimbursement requests with clear revenue and expenditure data.
- Reduces Manual Reconciliation: Minimizes the effort required to reconcile multiple funding spreadsheets and claim trackers.
- Creates a Shared Financial View: Provides campus leaders and district finance teams with a consistent reference point for financial performance.
KPIs to Track in a Special Education Financial Performance Dashboard
The following key KPIs can be tracked by using this dashboard:
- Total Revenue (USD): combined income from tuition, government funding, insurance, grants, and therapy services.
- Total Expenses (USD): all operating costs incurred to deliver special education programs and services.
- Revenue per Student (USD): average revenue generated for each enrolled student, core to special education revenue per student monitoring.
- Cost per Student (USD): average operating cost incurred per enrolled student across all programs.
- Cash Coverage Days: number of days current cash reserves would sustain operations without new funding inflow.
- Funding Collection Rate (%): share of billed or claimed funding that has been successfully collected, central to school funding collection rate tracking.
Frequently Asked Questions
1. What does this dashboard help special education schools track?
It tracks revenue, expenses, funding collection, and specialized service costs in one place, supporting special education school financial performance tracking across campuses and programs.
2. Can it show which funding claims are stuck in review?
Yes, the funding claims by status view breaks claims into approved, submitted, under review, returned for correction, and rejected, which is central to special education funding claims tracking.
3. Does the dashboard cover therapy and support service spending?
Yes, specialized service expenditure is broken out by category including speech therapy, occupational therapy, and behavioral support, enabling school therapy service expenditure analysis.