
What is an International School Financial Performance Dashboard
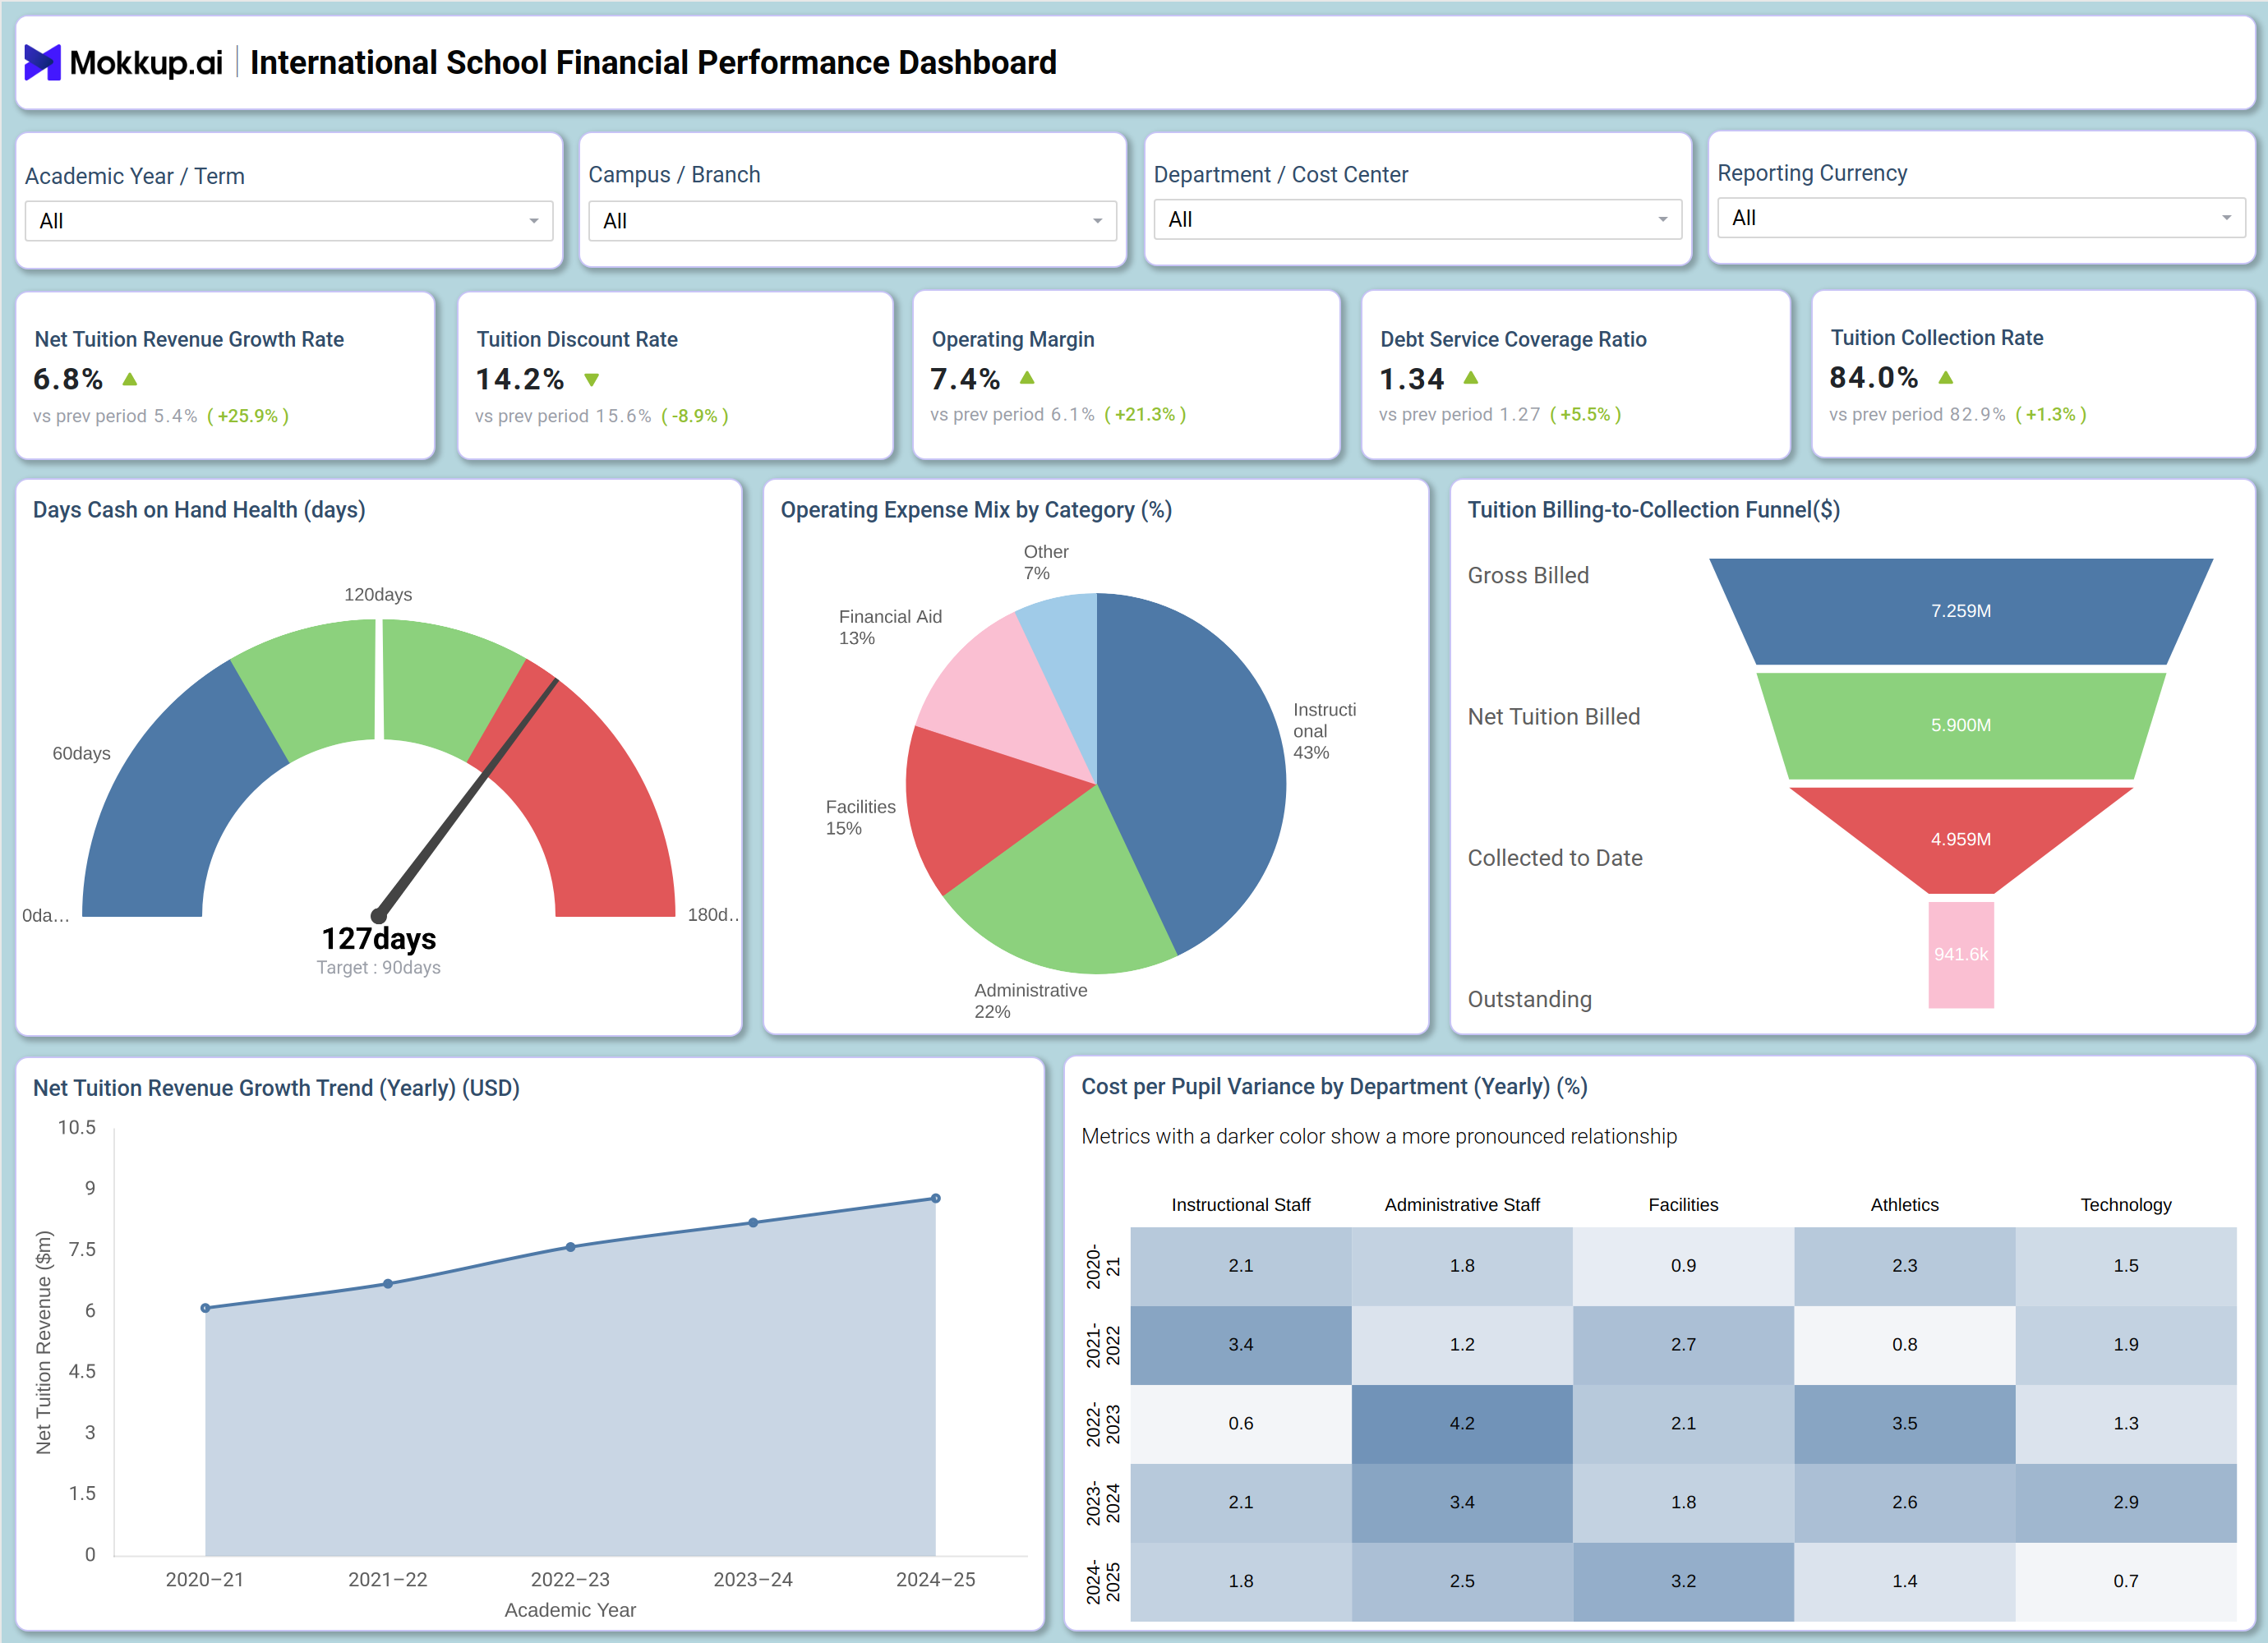
An international school financial performance dashboard gives finance leaders and school administrators a single view into how tuition revenue, operating costs, and cash reserves are trending across an academic year. Rather than piecing together figures from separate spreadsheets, finance teams can filter by academic year or term, campus or branch, department or cost center, and reporting currency to see how each unit of the school network is performing.
The International School Financial Performance Dashboard consolidates net tuition revenue growth, discount rates, collection performance, and expense composition into one workspace, so business officers spend less time compiling numbers and more time interpreting them. Teams increasingly treat the dashboard as a net tuition revenue growth rate tracking tool, since it shows immediately whether enrollment and pricing changes are converting into real revenue gains. Because international schools often operate across multiple campuses and currencies, a centralized dashboard makes it easier to compare units consistently and spot funding gaps early.
How to Create an International School Financial Performance Dashboard
You don't need to build your report from scratch-just start with a ready-to-use dashboard template from Mokkup. Add your data and export it as needed. Here's how to do it:
1. Create or Log in to Your Mokkup Account
Start by signing up on Mokkup.ai using your email. If you already have an account, just log in, and you'll be good to go.
2. Choose and Customize Your Dashboard Template
Find the International School Financial Performance Dashboard template in the Templates section. Use the drag-and-drop editor to adjust KPIs, edit filters, or add elements based on your data.
3. Export to Your BI Tool
Once your dashboard wireframe is ready, use the BI Tool Export feature to send it directly to Power BI or Tableau for further analysis and enhancements. You can also download the dashboard as a PDF, PNG, or JPEG, embed it on a platform, or invite your team to collaborate.
Note: This is a Pro template. You'll need a Pro subscription on Mokkup to use and customize this dashboard wireframe. Upgrade anytime to unlock full access.
International School Financial Performance Dashboard Example
A school business officer or CFO at an international school network typically opens this dashboard at the start of a budget review cycle or whenever leadership asks how tuition collections are tracking against expectations. The first question is usually whether revenue growth is keeping pace with enrollment and fee changes and whether the discount rate offered to families is trending in a sustainable direction. By filtering to a specific campus or academic term, the finance team can isolate where collections are slipping or where discounting is eating into net revenue faster than planned.
From there, attention shifts to liquidity and expense structure. Finance leaders use the dashboard for days cash on hand tracking for international schools, confirming reserves can cover operating expenses without relying on short-term borrowing, and to see how spending is distributed across instructional, administrative, facilities, and financial aid categories. If one category is consuming a disproportionate share of the budget relative to prior years, department heads can be asked to explain the shift before it becomes a recurring issue.
The billing-to-collection view lets the finance team trace how much tuition was originally billed against how much has actually been collected, making it straightforward to size the outstanding balance that still needs to be chased down. Combined with the year-over-year cost-per-pupil variance by department, planners can compare which departments are running above or below their historical spending pattern and decide where budget conversations need to happen first. Ultimately, this dashboard helps international school finance teams move from reactive reporting to proactive financial management, with the visibility to protect margins, manage cash reserves, and defend budget decisions with evidence.
How to Analyze Data in an International School Financial Performance Dashboard
Here is how you can analyze data from this dashboard:
- Filter by academic year, term, campus, or department to narrow the view to the unit under review.
- Review the tuition billing-to-collection funnel analysis dashboard section to trace revenue from gross billed down to what still sits outstanding.
- Rely on tuition collection rate monitoring for schools to see how much billed revenue actually converts to cash.
- Watch the discount rate against the collection rate together to judge whether pricing strategy is working as intended.
- Cross-reference operating expense mix with cost-per-pupil variance to spot departments drifting from historical spending patterns.
- Use the net tuition revenue growth rate tracking tool view alongside enrollment data to separate volume-driven growth from fee-driven growth.
Benefits of an International School Financial Performance Dashboard
The following are the benefits of using this dashboard:
- Consolidates tuition, expense, and cash metrics into one operating margin analysis for school finance view instead of scattered spreadsheets.
- Surfaces outstanding tuition balances early so collections teams can act before receivables age further.
- Gives leadership a currency- and campus-agnostic way to compare financial health across the network.
- Supports days cash on hand tracking for international schools so liquidity risk is visible before it becomes a crisis.
- Reduces the manual effort finance teams spend assembling board-ready financial summaries.
- Flags expense categories and departments drifting from historical spending patterns before budgets are finalized.
KPIs to Track in an International School Financial Performance Dashboard
The following key KPIs can be tracked by using this dashboard:
- Net Tuition Revenue Growth Rate: measures how much tuition revenue increased after discounts and aid, showing whether pricing and enrollment are trending upward.
- Tuition Discount Rate: shows the percentage of gross tuition given up to discounts and financial aid, signaling whether affordability programs are staying within budget.
- Operating Margin: the core metric for operating margin analysis for school finance, showing what share of revenue remains after covering operating expenses.
- Debt Service Coverage Ratio: indicates whether operating income is sufficient to cover debt obligations, a key signal for lenders and bondholders.
- Tuition Collection Rate: shows what percentage of billed tuition has actually been collected, the basis for tuition collection rate monitoring for schools.
Frequently Asked Questions
1. What does the International School Financial Performance Dashboard track?
It brings together tuition revenue growth, discount rate, operating margin, debt service coverage, tuition collection rate, cash reserves, and expense composition into one financial performance dashboard. Filters let you view results by academic year, campus, department, or reporting currency.
2. How often should finance teams review this dashboard?
Most schools review cash and collection metrics monthly, and margin and expense mix trends quarterly. Board and audit cycles typically call for a deeper review at the close of each academic term.
3. Can I customize this dashboard for my school's own chart of accounts?
Yes, the dashboard template is built in Mokkup.ai, so KPIs, filters, and the tuition billing to collection funnel analysis dashboard section can all be adjusted to match your school's needs. Once customized, it can be exported to Power BI, Tableau, or as a static file.