
What is a Special Education Facility Management Dashboard?
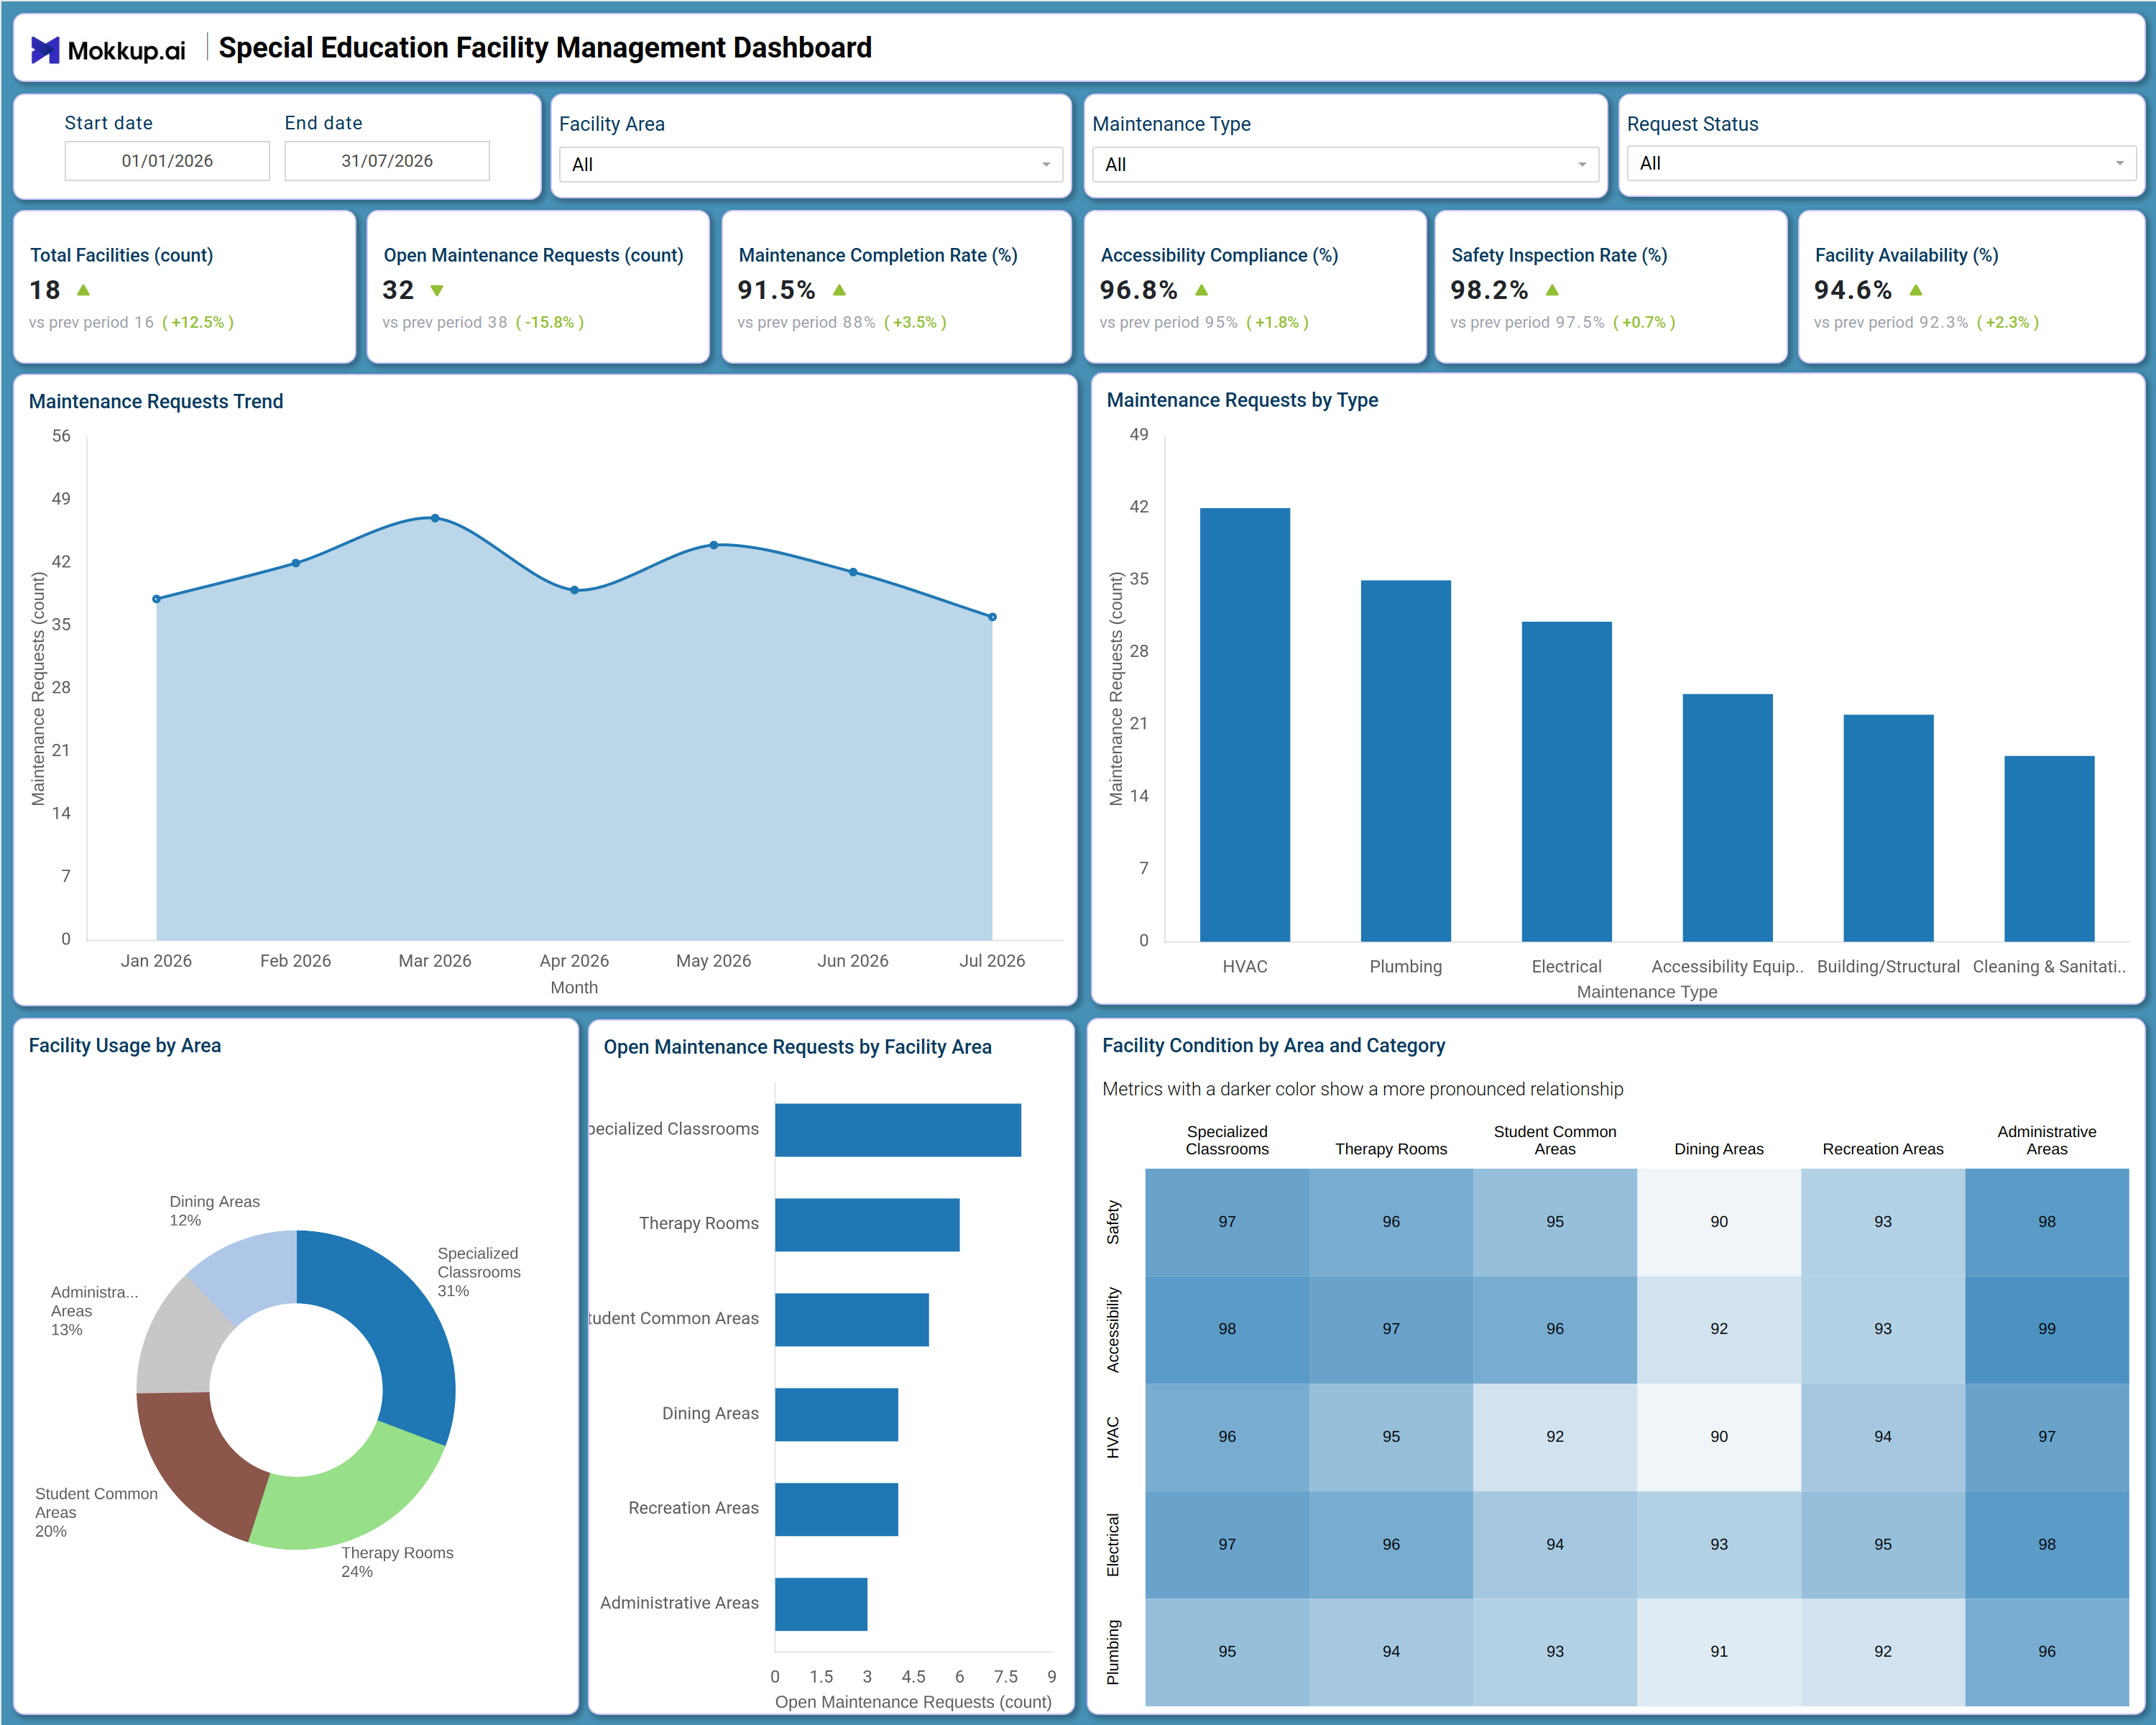
The Special Education Facility Management Dashboard gives facility operations teams and school administrators a consolidated view of how buildings, classrooms, and support spaces serving special education students are maintained and utilized. It tracks facility counts, open maintenance requests, completion rates, accessibility compliance, safety inspections, and space availability across areas such as specialized classrooms, therapy rooms, student common areas, dining areas, recreation areas, and administrative areas. Built as a facility condition score dashboard template, it pulls maintenance activity, accessibility metrics, and safety data into one wireframe so facility managers do not have to reconcile separate maintenance logs and inspection reports. Teams use this special education facility management dashboard to confirm that classrooms, therapy rooms, and shared spaces stay safe, accessible, and operational for students with diverse needs.
How to Create a Special Education Facility Management Dashboard
You don't need to build your report from scratch—just start with a ready-to-use dashboard template from Mokkup. Add in your data and export it however you like. Here's how to do it:
1. Create or Log in to Your Mokkup Account
Start by signing up on Mokkup.ai using your email. If you already have an account, just log in, and you'll be good to go.
2. Choose and Customize Your Dashboard Template
Find the Special Education Facility Management Dashboard template in the Templates section. Use the drag-and-drop editor to adjust KPIs, edit filters, or add elements based on your data.
3. Export to Your BI Tool
Once your dashboard wireframe is ready, use the BI Tool Export feature to send it directly to Power BI or Tableau for further analysis and enhancements. You can also download the dashboard as a PDF, PNG, or JPEG, embed it on a platform, or invite your team to collaborate.
Note: This is a Pro template. You'll need a Pro subscription on Mokkup to use and customize this dashboard wireframe. Upgrade anytime to unlock full access.
Special Education Facility Management Dashboard Example
A facility operations manager at a special education school opens this dashboard each week to check whether maintenance backlogs are growing or shrinking and whether accessibility and safety standards are holding steady across every area of the campus. Filtering by facility area, maintenance type, or request status lets the manager narrow the view down to a single wing or a single category, such as HVAC or accessibility equipment, before deciding where a technician should be dispatched first. On this dashboard, the manager can identify which maintenance categories are generating the most requests and whether those requests are concentrated in specialized classrooms, therapy rooms, or other high-use areas.
By reviewing the monthly trend alongside the breakdown of open requests by facility area, planners can prioritize repairs in spaces that directly affect student instruction and therapy sessions, and they can perform a maintenance requests by type analysis to decide whether a category needs a longer-term fix rather than a one-off repair. The area-by-category condition view lets teams compare safety, accessibility, HVAC, electrical, and plumbing condition side by side across every space, so a specialized classroom with a weaker accessibility rating gets attention before it becomes a compliance issue. Used this way, the dashboard helps facility and administrative teams keep every classroom, therapy room, and shared space ready for students, reduce the time facilities sit in an open or unresolved state, and demonstrate that safety and accessibility standards are consistently met across the school.
How to Analyze Data in a Special Education Facility Management Dashboard
Here is how you can analyze data from this dashboard:
- Use the Facility Area filter to isolate maintenance activity for specialized classrooms, therapy rooms, or administrative areas.
- Apply the Maintenance Type filter to run a maintenance requests by type analysis before assigning technicians.
- Filter by Request Status to separate open requests from completed ones and gauge response speed.
- Monitor the Maintenance Requests Trend to spot months where request volume climbs faster than completion.
- Review Maintenance Requests by Type to identify which category, such as HVAC or plumbing, drives the most tickets.
- Compare Facility Usage by Area against Open Maintenance Requests by Facility Area to see if high-traffic spaces are also high-maintenance spaces.
- Use the Facility Condition by Area and Category heatmap to find the weakest safety, accessibility, or HVAC score in any single space.
- Track Maintenance Completion Rate and Accessibility Compliance together to confirm repairs are not slowing down compliance.
Benefits of a Special Education Facility Management Dashboard
The following are the benefits of using this dashboard:
- Centralizes facility counts, maintenance activity, accessibility, and safety metrics for a special education campus in one dashboard template.
- Functions as a maintenance completion rate tracking dashboard that shows whether repair turnaround is improving or slipping.
- Works as a safety inspection rate tracking dashboard so schools can confirm inspection scores stay above target every month.
- Reduces manual comparison of maintenance logs by grouping requests by type, area, and status in a single wireframe.
- Functions as an accessibility compliance monitoring tool that flags areas falling below acceptable accessibility scores.
- Highlights facility areas, such as therapy rooms or specialized classrooms, that need the most maintenance attention.
- Gives facility managers and administrators a shared view of maintenance backlog, safety, and facility availability.
KPIs to Track in a Special Education Facility Management Dashboard
The following key KPIs can be tracked by using this dashboard:
- Total Facilities (count): Tracks the number of buildings and spaces covered by this special education facility management dashboard, forming the baseline for all other metrics.
- Open Maintenance Requests (count): Measures how many maintenance tickets remain unresolved at any point, signaling where backlog is building.
- Maintenance Completion Rate (%): A maintenance completion rate tracking dashboard metric that shows the share of requests closed within the reporting period.
- Accessibility Compliance (%): Quantifies how well classrooms, therapy rooms, and common areas meet accessibility standards for students with diverse needs.
- Safety Inspection Rate (%): Reflects the percentage of facility areas passing scheduled inspections, key to a safety inspection rate tracking dashboard view.
- Facility Availability (%): Measures the share of time facilities remain open and usable for instruction and therapy without interruption.
- Facility Condition Score by Area and Category: Acts as a facility condition score dashboard template metric, scoring safety, accessibility, HVAC, electrical, and plumbing condition for every facility area.
Frequently Asked Questions
1. What is the Special Education Facility Management Dashboard used for?
It helps facility managers and school administrators track maintenance, accessibility, and safety across special education campuses. Teams use it as an accessibility compliance monitoring tool while also watching maintenance backlog and safety inspection outcomes.
2. Can this dashboard track maintenance requests by facility area?
Yes. The Open Maintenance Requests by Facility Area chart breaks down open tickets by specialized classrooms, therapy rooms, dining areas, recreation areas, and administrative areas so teams can prioritize the busiest spaces first.
3. Does the dashboard support maintenance requests by type analysis?
Yes. The Maintenance Requests by Type chart groups tickets into categories like HVAC, plumbing, electrical, and accessibility equipment, making it easy to see which category needs attention.