What is a Restaurant Quality Control & Inspection Dashboard?
A restaurant quality control & inspection dashboard is a centralized analytics tool designed to monitor food safety, compliance, and operational efficiency in food service establishments. It consolidates inspection data, violation trends, and corrective actions into a single interface, enabling QA managers, restaurant owners, and food safety teams to track performance effectively. This food service inspection software for QA managers automates data collection from health inspections, internal audits, and customer complaints, reducing manual errors and improving decision-making. By analyzing trends through this dashboard, teams can identify hygiene violations, track corrective actions, and proactively address risks to maintain regulatory compliance and enhance customer trust in their food safety practices.
How to Create a Restaurant Quality Control & Inspection Dashboard
You don’t need to build your report from scratch, just start with a ready-to-use dashboard template from Mokkup. Add in your data and export it however you like. Here’s how to do it:
1. Create or Log in to Your Mokkup Account
Start by signing up on Mokkup.ai using your email. If you already have an account, just log in, and you’ll be good to go.
2. Choose and Customize Your Dashboard Template
Find the Restaurant Quality Control & Inspection Dashboard template in the Templates section. Use the drag and drop editor to adjust KPIs, edit filters, or add elements based on your data.
3. Export to Your BI Tool
Once your dashboard wireframe is ready, use the BI Tool Export feature to send it directly to Power BI or Tableau for further analysis and enhancements. You can also download the dashboard as a PDF, PNG, or JPEG, embed it on a platform, or invite your team to collaborate.
Note: This is a Pro template. You’ll need a Pro subscription on Mokkup to use and customize this dashboard wireframe. Upgrade anytime to unlock full access.
Restaurant Quality Control & Inspection Dashboard Example
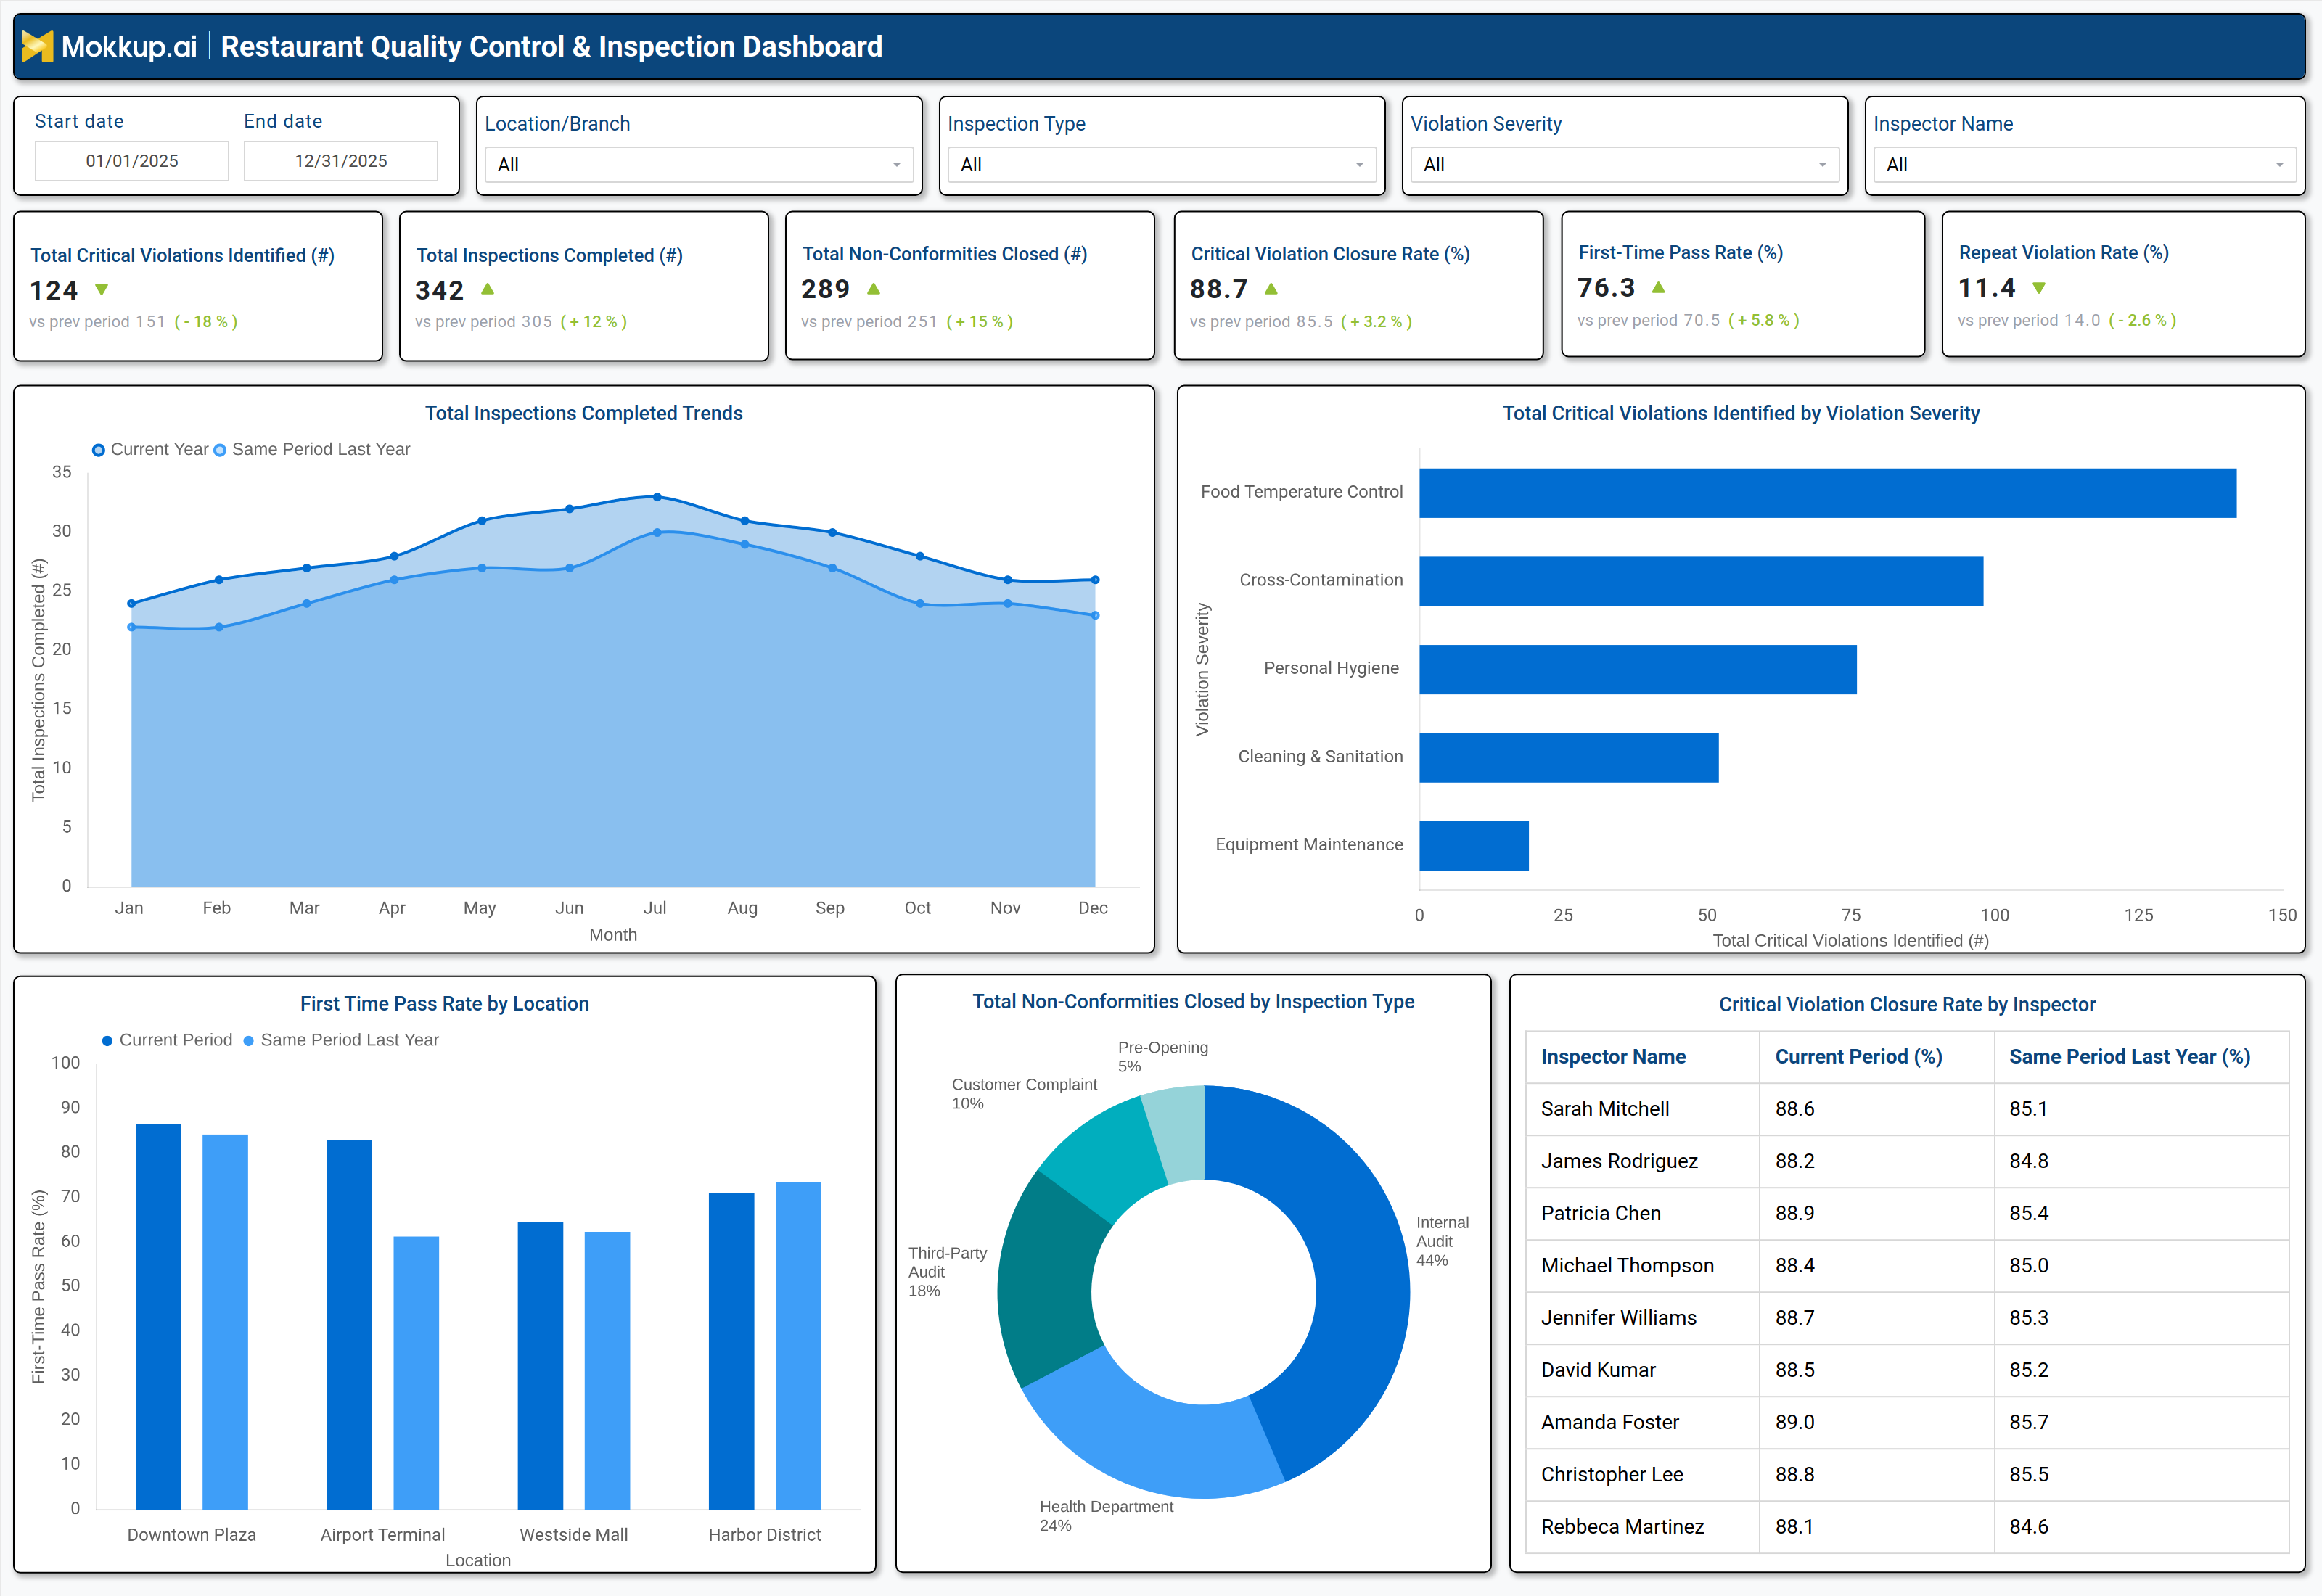
A typical restaurant quality control dashboard for food safety includes interactive filters for date range, location, inspection type, and violation severity. Key metrics displayed in performance tiles include the total number of critical violations identified, inspections completed, nonconformities closed, critical violation closure rate, first-time pass rate, and repeat violation rate. Trend charts compare current performance against previous periods, helping identify improvements or declines in compliance. A breakdown of total critical violations by severity highlights common issues such as food temperature control, cross-contamination, and personal hygiene. Location-based performance metrics show which branches excel or struggle with compliance, while inspector-level data tracks individual efficiency in resolving violations. Together, these components form a food safety compliance dashboard for restaurants, enabling data-driven improvements in food safety management.
How to Analyze Data in a Restaurant Quality Control & Inspection Dashboard
Here is how you can analyze data from this restaurant safety inspection monitoring dashboard:
- Track Total Critical Violations: Monitor the number of critical violations over time to uncover recurring food safety risks and high-risk operational areas.
- Monitor Inspection Completion Trends: Ensure inspections are conducted on schedule and consistently across all locations to maintain regulatory compliance.
- Compare Violation Closure Rates by Location: Evaluate how quickly different sites resolve violations to measure operational efficiency and accountability.
- Analyze First-Time Pass Rates: Assess how often locations pass inspections on the first attempt to gauge staff training effectiveness and preparedness.
- Review Repeat Violation Rates: Identify locations with recurring issues to detect systemic problems in food handling or process adherence.
- Break Down Violations by Severity: Categorize violations (e.g., temperature control, hygiene, cross-contamination) to prioritize corrective actions based on risk level.
- Assess Inspector Performance: Compare inspection patterns and findings to ensure consistent enforcement of food safety standards across inspectors.
Benefits of a Restaurant Quality Control & Inspection Dashboard
The following are the benefits of using this food service quality control reporting dashboard:
- Enhance Food Safety Compliance: Track violations and corrective actions in one place to ensure adherence to food safety regulations and internal standards.
- Reduce Operational Risks: Proactively monitor violations to identify potential issues early and prevent escalation into serious safety incidents.
- Improve Inspection Efficiency: Use automated data collection and reporting to minimize manual effort and accelerate inspection workflows.
- Identify High-Risk Violation Categories: Pinpoint the most common and severe violation types to focus food safety improvement initiatives where they matter most.
- Boost Customer Trust: Demonstrate transparent and consistent food safety practices that reinforce brand credibility and customer confidence.
- Optimize Staff Training: Highlight recurring compliance gaps to design targeted training programs and improve workforce readiness.
- Streamline Audit Preparation: Maintain centralized inspection and compliance records to simplify audits and reduce preparation time.
KPIs to Track in a Restaurant Quality Control & Inspection Dashboard
The following key KPIs can be tracked by using this automated restaurant quality assurance tracking tools dashboard:
- Total Critical Violations Identified (count): Measures the number of high-risk food safety breaches detected.
- Total Inspections Completed (count): Tracks the frequency of compliance checks.
- Nonconformities Closed (count): Indicates how many violations were resolved.
- Critical Violation Closure Rate (%): Shows the percentage of high-risk issues fixed.
- FirstTime Pass Rate (%): Evaluates how often inspections pass without violations.
- Repeat Violation Rate (%): Identifies recurring compliance failures.
Frequently Asked Questions
1. What is a restaurant quality control dashboard used for?
It helps restaurants monitor food safety compliance, track inspection results, and reduce operational risks.
2. Who should use a restaurant quality control & inspection dashboard?
QA managers, restaurant owners, food safety inspectors, and operations teams.
3. What data sources feed into this dashboard?
Health inspection reports, internal audits, customer complaints, and corrective action logs.