
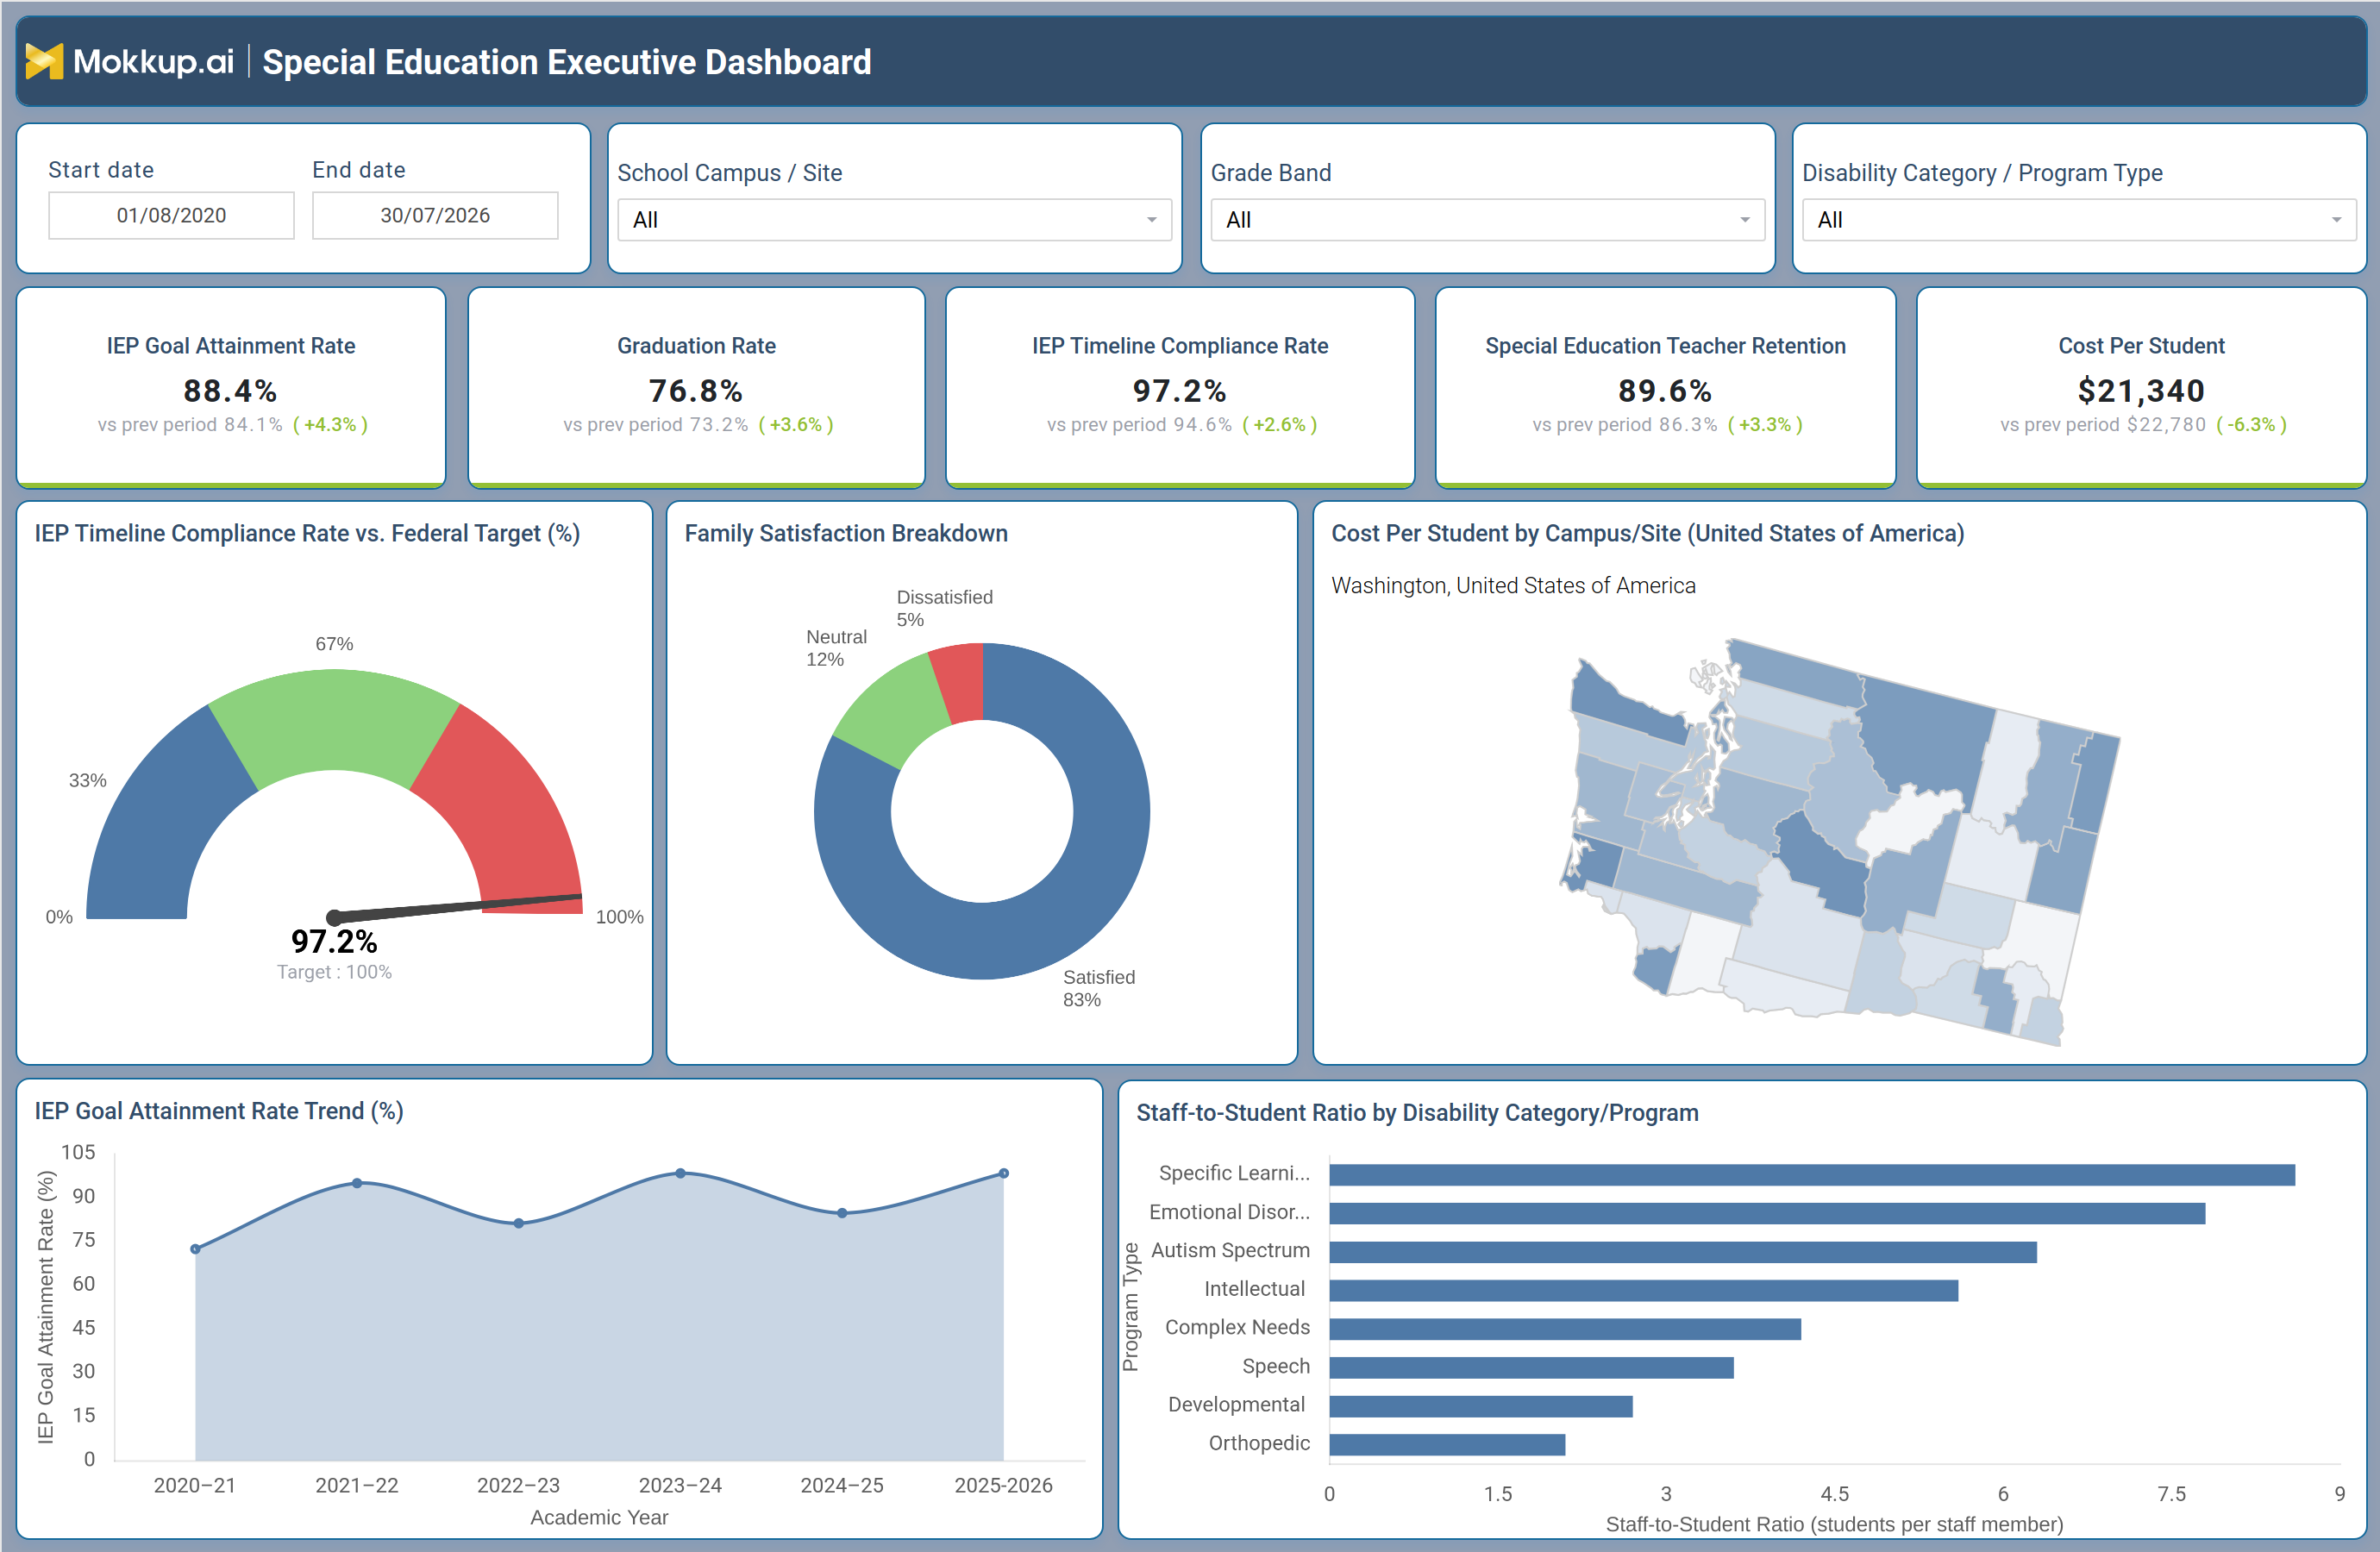
What is a Special Education Executive Dashboard
The Special Education Executive Dashboard gives school district leaders and special education directors a single view into how IEP programs, staffing, and student outcomes are performing across campuses. Built for executive-level oversight, this special education executive dashboard consolidates compliance, academic, and financial signals that are normally scattered across separate IEP management systems, HR records, and finance spreadsheets. Functioning as an IEP goal attainment rate tracking tool, it also lets teams compare current performance against prior academic years without exporting data into a separate spreadsheet. Leaders can filter by school campus or site, grade band, and disability category or program type to see how a specific segment of the student population is progressing without waiting on a manual data pull. Because IEP timeline compliance and staffing metrics sit on one screen, administrators preparing for a board meeting or a federal compliance review can move from question to answer within minutes.
How to Create a Special Education Executive Dashboard
You don't need to build your report from scratch—just start with a ready-to-use dashboard template from Mokkup. Add in your data and export it however you like. Here's how to do it:
1. Create or Log in to Your Mokkup Account
Start by signing up on Mokkup.ai using your email. If you already have an account, just log in, and you'll be good to go.
2. Choose and Customize Your Dashboard Template
Find the Special Education Executive Dashboard template in the Templates section. Use the drag-and-drop editor to adjust KPIs, edit filters, or add elements based on your data.
3. Export to Your BI Tool
Once your dashboard wireframe is ready, use the BI Tool Export feature to send it directly to Power BI or Tableau for further analysis and enhancements. You can also download the dashboard as a PDF, PNG, or JPEG, embed it on a platform, or invite your team to collaborate.
Note: This is a Pro template. You'll need a Pro subscription on Mokkup to use and customize this dashboard wireframe. Upgrade anytime to unlock full access.
Special Education Executive Dashboard Example
A special education director typically opens this dashboard ahead of a board update or a state compliance audit, looking to understand whether IEP timelines are being met and whether family sentiment toward the program is holding steady. Rather than pulling separate reports from the special education information system, HR platform, and finance ledger, the director scans one screen to see where attention is needed before the meeting starts.
From here, teams can identify whether goal attainment is improving or slipping compared to the prior period and whether that trend holds across every campus or is concentrated in a few sites. Program leaders can track how the gap between actual IEP timeline compliance and the federal target is narrowing or widening, and if a decline shows up, they can filter down to the specific grade band or disability category driving it. Staffing leaders can also compare teacher retention against the broader trendline to gauge whether turnover is beginning to threaten service delivery, and finance leaders can weigh spending against enrollment and outcomes to judge whether budget is translating into results.
The overall effect is that a district's special education leadership stops reacting to compliance findings after the fact and instead catches drift in IEP timelines, staffing, or family satisfaction early enough to correct course. A cost per student analysis for special education programs becomes part of the same conversation as outcomes, so budget decisions are grounded in what is actually happening on each campus rather than a lagging annual report.
How to Analyze Data in a Special Education Executive Dashboard
Here is how you can analyze data from this dashboard:
- Filter by Date / Campus / Grade Band / Program Type: Isolate performance by time period, school site, grade band, disability category, or program type.
- Track IEP Goal Attainment: Monitor goal attainment trends across academic years to identify sustained progress or plateaus.
- Monitor IEP Timeline Compliance: Track compliance rates against federal targets to identify potential issues before they become formal findings.
- Track Family Satisfaction: Review satisfaction levels to identify dissatisfied or neutral families before concerns escalate through surveys.
- Compare Cost per Student: Use the campus/site view to identify locations operating above or below the district average.
- Compare Staff-to-Student Ratios: Assess staffing levels by disability category or program to ensure resources align with student needs.
Benefits of a Special Education Executive Dashboard
The following are the benefits of using this dashboard:
- Centralizes Special Education Data: Brings IEP compliance, academic, staffing, and financial metrics into one executive view.
- Reduces Manual Reporting: Minimizes reliance on reports pulled from separate special education and finance systems.
- Identifies Campus / Program Variations: Highlights differences across campuses and programs before they become district-wide concerns.
- Supports Compliance Preparation: Speeds up preparation for board meetings and federal compliance reviews.
- Tracks Teacher Retention: Monitors special education teacher retention alongside academic and compliance performance.
- Supports Budget Decisions: Provides clear cost-per-student analysis to help leadership evaluate and justify special education program spending.
KPIs to Track in a Special Education Executive Dashboard
Key Performance Indicators (KPIs) are measurable values that track progress toward a program's most important goals; in this dashboard they translate IEP compliance, academic outcomes, staffing, and spending into signals leadership can act on.
- IEP Goal Attainment Rate (%): the share of individualized education program goals met within the tracked period, reflecting whether services are producing measurable student progress.
- Graduation Rate (%): the share of eligible special education students completing their program, a leading signal of whether long-term outcomes are on track.
- IEP Timeline Compliance Rate (%): how closely the district is meeting federally mandated IEP deadlines; this IEP timeline compliance rate monitoring tool tracks progress against a federal compliance target.
- Special Education Teacher Retention (%): the share of special education staff retained year over year, an early warning sign for service continuity that this special education teacher retention tracking dashboard flags before it affects caseloads.
- Cost Per Student ($): total program spending divided by enrolled students, used to judge whether budget is aligned with outcomes across campuses.
Frequently Asked Questions
1. What is a Special Education Executive Dashboard used for?
It gives special education directors and district leaders a consolidated view of IEP compliance, academic outcomes, staffing, and cost data. As a special education executive dashboard, it replaces manual reporting pulled from multiple systems with one screen leadership can review before a board meeting or compliance audit.
2. How is the IEP Timeline Compliance Rate calculated?
It measures the share of IEPs completed within federally mandated deadlines during the selected period. The dashboard compares this rate against a 100% federal target so gaps are visible before they become audit findings.
3. Can this dashboard track program-level differences, such as by disability category?
Yes. Filtering by Disability Category/Program Type and Grade Band shows staffing, compliance, and outcome differences across student segments, such as Autism Spectrum or Speech services, so leaders can see where additional support is needed.