What is a Solar Power Generation & Efficiency Dashboard?
A Solar Power Generation & Efficiency Dashboard template is a performance monitoring system used by electric utilities and renewable energy operators to track generation output, solar irradiance, equipment behavior, and operational efficiency. It consolidates key metrics, such as total energy generated, capacity utilization factor (CUF), performance ratio (PR), specific yield, irradiance, and reliability, into a unified interface.
As a solar power generation and efficiency performance dashboard, it helps technical teams monitor how effectively solar plants convert solar irradiance into usable energy. It also functions as a utility-scale solar plant output monitoring and analytics tool, providing advanced insights into plant performance across various regions, capacity ranges, and weather conditions. By visualizing trends for generation stability, loss patterns, and operational issues, this dashboard enables utilities to strengthen planning, reduce inefficiencies, and ensure higher renewable energy output.
How to Create a Solar Power Generation & Efficiency Dashboard
You don’t need to build your report from scratch, just start with a ready-to-use dashboard template from Mokkup. Add in your data and export it however you like. Here’s how to do it:
1. Create or Log in to Your Mokkup Account
Start by signing up on Mokkup.ai using your email. If you already have an account, just log in, and you’ll be good to go.
2. Choose and Customize Your Dashboard Template
Find the Solar Power Generation & Efficiency Dashboard template in the Templates section. Use the drag-and-drop editor to adjust KPIs, edit filters, or add elements based on your data.
3. Export to Your BI Tool
Once your dashboard wireframe is ready, use the BI Tool Export feature to send it directly to Power BI or Tableau for further analysis and enhancements. You can also download the dashboard as a PDF, PNG, or JPEG, embed it on a platform, or invite your team to collaborate.
Note: This is a Pro template. You’ll need a Pro subscription on Mokkup to use and customize this dashboard wireframe. Upgrade anytime to unlock full access.
Solar Power Generation & Efficiency Dashboard Example
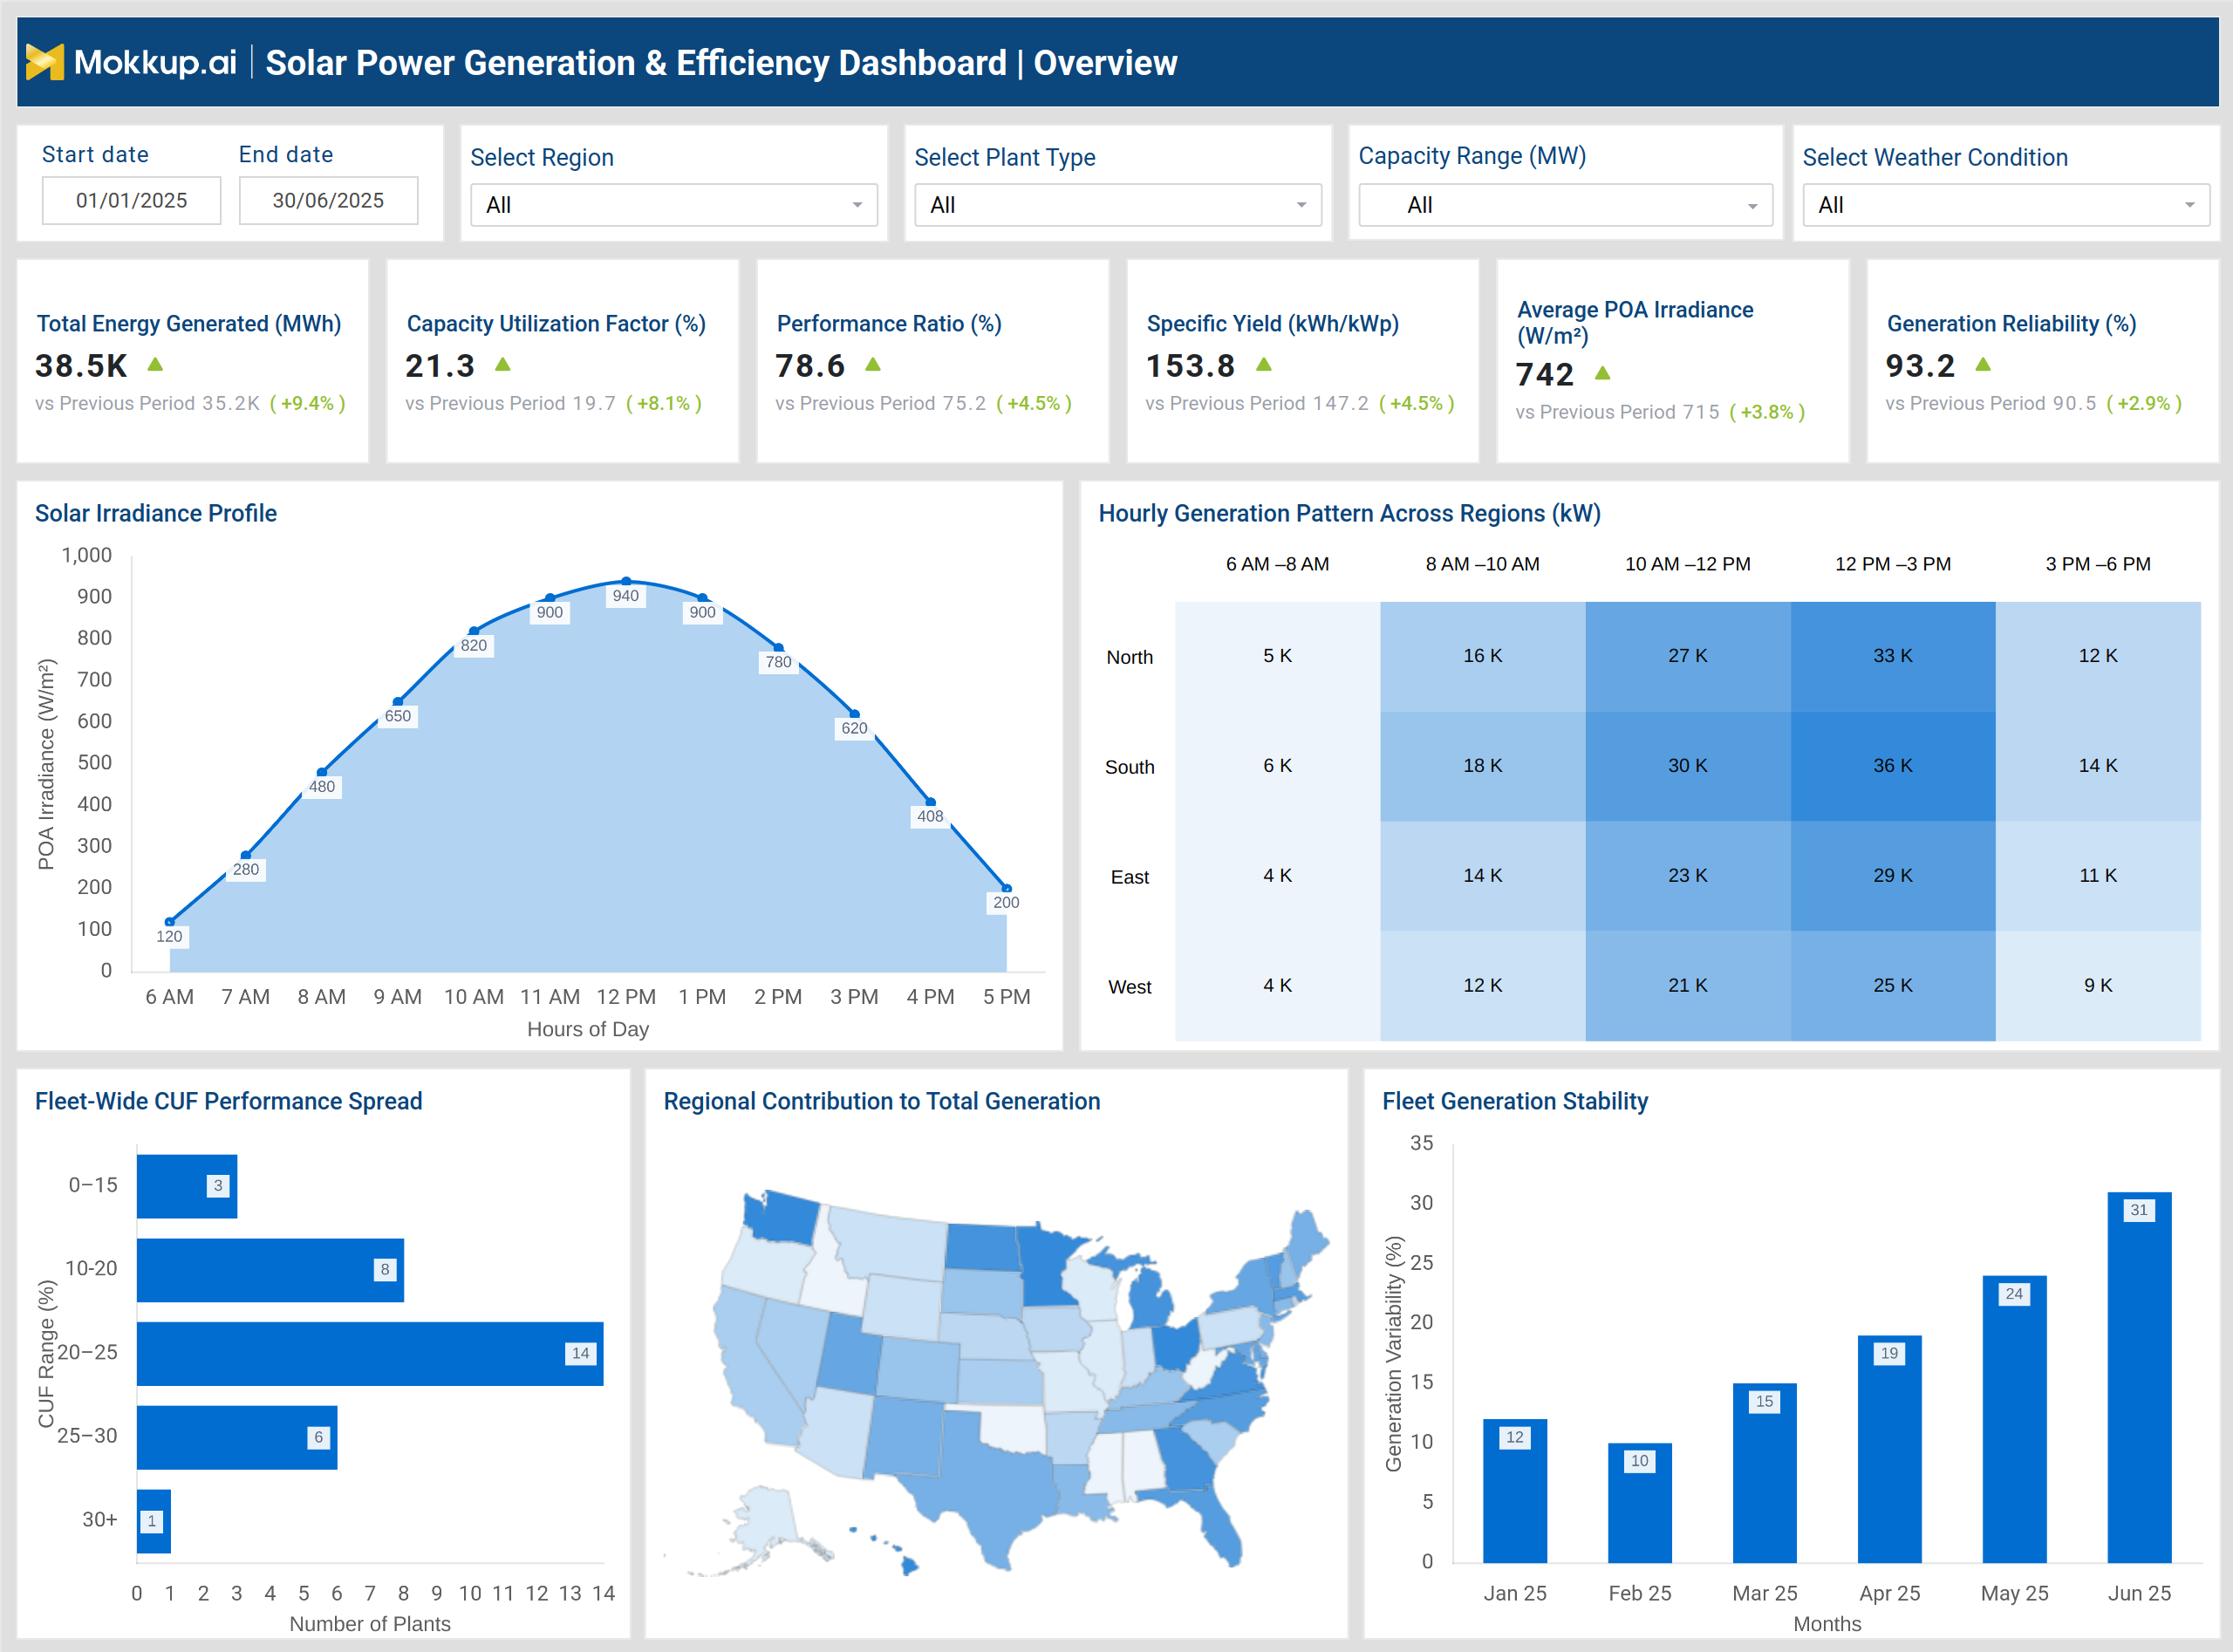
The example dashboard above provides a complete performance view of solar plants across a large utility network. It displays essential KPIs, including Total Energy Generated (MWh), Capacity Utilization Factor, Performance Ratio, Specific Yield, Average POA Irradiance, and Generation Reliability. These metrics help evaluate how well solar installations are performing relative to their installed capacity and environmental conditions.
Supporting visuals such as the Solar Irradiance Profile, Hourly Generation Pattern Across Regions, and Fleet-Wide CUF Performance Spread reveal how regional irradiance and weather variations shape output across the fleet. These insights align with the purpose of a renewable energy generation efficiency tracking dashboard, showing where solar plants overperform or underperform. The second section focuses on loss attribution and root-cause analysis. Charts such as Total Energy Lost, Technical Loss, Environmental Loss, Grid Curtailment, Component Failure Trend, Monthly Loss Trend by Source, and Equipment-Level Loss Contribution show detailed breakdowns of where energy is lost within the system.
This makes the dashboard effective as an electric utility generation performance and efficiency dashboard, helping operators detect inefficiencies caused by soiling, shading, temperature variations, inverter trips, wiring faults, transformer losses, or grid constraints. Component reliability charts also support solar inverter performance analytics and efficiency monitoring, enabling maintenance teams to take targeted corrective actions. Overall, the dashboard serves as a full power plant energy yield and operational efficiency dashboard, offering deep insights into generation behavior, operational issues, and recoverable loss opportunities.
How to Analyze Data in Solar Power Generation & Efficiency Dashboard
Start by reviewing how generation performance, efficiency metrics, and loss patterns influence total solar output across the entire fleet:
- Track Total Energy Generated: Compare actual vs. expected output across all plants.
- Review CUF (Capacity Utilization Factor): Identify plants underutilizing installed capacity.
- Evaluate Performance Ratio (PR): Measure real-world energy conversion efficiency.
- Analyze Specific Yield (kWh/kWp): Compare plant productivity independent of capacity.
- Use Hourly Generation Heatmaps: Identify morning, noon, and evening output patterns by region.
- Review Irradiance Curves: Check whether generation follows expected irradiance levels.
- Assess Fleet-Wide CUF Spread: Detect high-performing vs. low-performing plants.
- Analyze Environmental Losses: Evaluate soiling, shading, temperature effects, and weather impacts.
- Track Technical Losses: Monitor inverter failures, wiring issues, and transformer inefficiencies.
- Evaluate Grid Curtailment: Understand how grid limitations restrict energy export.
- Monitor Component Failure Patterns: Identify recurring issues with equipment reliability.
- Review Recoverable Losses: Prioritize maintenance actions that deliver maximum energy recovery.
Benefits of Solar Power Generation & Efficiency Dashboard
These dashboards enable solar operators to understand plant performance, minimize losses, and optimize returns across their entire solar fleet:
- Provides Generational Visibility: Tracks output and efficiency across regions and plant types.
- Identifies Performance Gaps: Uses CUF, PR, irradiance, and yield data to highlight issues.
- Reduces Operational Inefficiencies: Reveals environmental and technical loss sources.
- Enables Predictive Maintenance: Detects recurring inverter and component failures early.
- Improves Asset Reliability: Monitors variability and deviations in generation performance.
- Enhances Grid Integration: Supports planning through hourly and seasonal output trends.
- Strengthens Operational Decisions: Helps adjust strategy across weather, capacity, and plant conditions.
- Increases ROI: Maximizes asset productivity by reducing avoidable losses.
KPIs to Track in Solar Power Generation & Efficiency Dashboard
Use these KPIs to consistently evaluate solar plant performance, efficiency, and reliability:
- Total Energy Generated (MWh): Measures total solar output across all plants.
- Capacity Utilization Factor (CUF%): Evaluates the efficiency of capacity usage.
- Performance Ratio (PR %): Measures system-level conversion efficiency under actual conditions.
- Specific Yield (kWh/kWp): Tracks plant productivity independent of capacity size.
- Average POA Irradiance (W/m²): Indicates available solar resource.
- Generation Reliability (%): Indicates the consistency of uptime for PV systems.
- Environmental Loss (%): Measures soiling, shading, temperature, and weather-related losses.
- Technical Loss (%): Captures inverter, wiring, transformer, and equipment inefficiencies.
- Component Failure Count: Highlights the frequency of equipment failures.
- Grid Curtailment (Hours): Measures energy lost due to grid export limitations.
- Recoverable Loss (MWh): Indicates energy that can be regained through corrective action.
- Loss Contribution by Equipment: Highlights which components drive the highest energy loss.
Frequently Asked Questions
Q1. Who uses a Solar Power Generation & Efficiency Dashboard?
Utility operators, solar asset managers, performance engineers, renewable energy analysts, and O&M teams.
Q2. Can it track multiple solar plants across regions?
Yes, it can monitor individual plants, clusters, and fleet-wide portfolios.
Q3. How does it help improve plant performance?
By highlighting inefficiencies, component failures, environmental losses, and recoverable energy.
Q4. Does the dashboard support predictive maintenance?
Yes. Component failure trends and loss source analytics help identify future equipment issues.