
What is a Solar Export & Curtailment Performance Dashboard?
A Solar Export & Curtailment Performance Dashboard is a detailed analytics tool used by utility-scale solar operators, grid planners, and power utilities to track how much solar energy is successfully exported to the grid and how much is curtailed due to grid constraints. This dashboard helps teams understand export stability, identify peak curtailment periods, analyze transmission limitations, and measure the operational impact of grid availability. By combining real-time export data, curtailment ratios, grid availability metrics, and event-level root cause insights, it supports accurate decision-making for performance optimization. It functions as a comprehensive solar export and curtailment performance monitoring dashboard, enabling power utilities to minimize losses, enhance grid integration, and optimize renewable energy output.
How to Create a Solar Export & Curtailment Performance Dashboard
You don't need to design your dashboard from scratch. Simply begin with a pre-built Solar Export & Curtailment Performance Dashboard template from Mokkup. Customize it with your specific data and export it for use. Here’s how:
1. Create or Log in to Your Mokkup Account
Start by signing up on Mokkup.ai using your email. If you already have an account, just log in, and you’ll be good to go.
2. Choose and Customize Your Dashboard Template
Find the Solar Export & Curtailment Performance Dashboard template in the Templates section. Use the drag-and-drop editor to adjust KPIs, edit filters, or add elements based on your data.
3. Export to Your BI Tool
Once your dashboard wireframe is ready, use the BI Tool Export feature to send it directly to Power BI or Tableau for further analysis and enhancements. You can also download the dashboard as a PDF, PNG, or JPEG, embed it on a platform, or invite your team to collaborate.
Note: This is a Pro template. You’ll need a Pro subscription on Mokkup to use and customize this dashboard wireframe. Upgrade anytime to unlock full access.
Solar Export & Curtailment Performance Dashboard Example
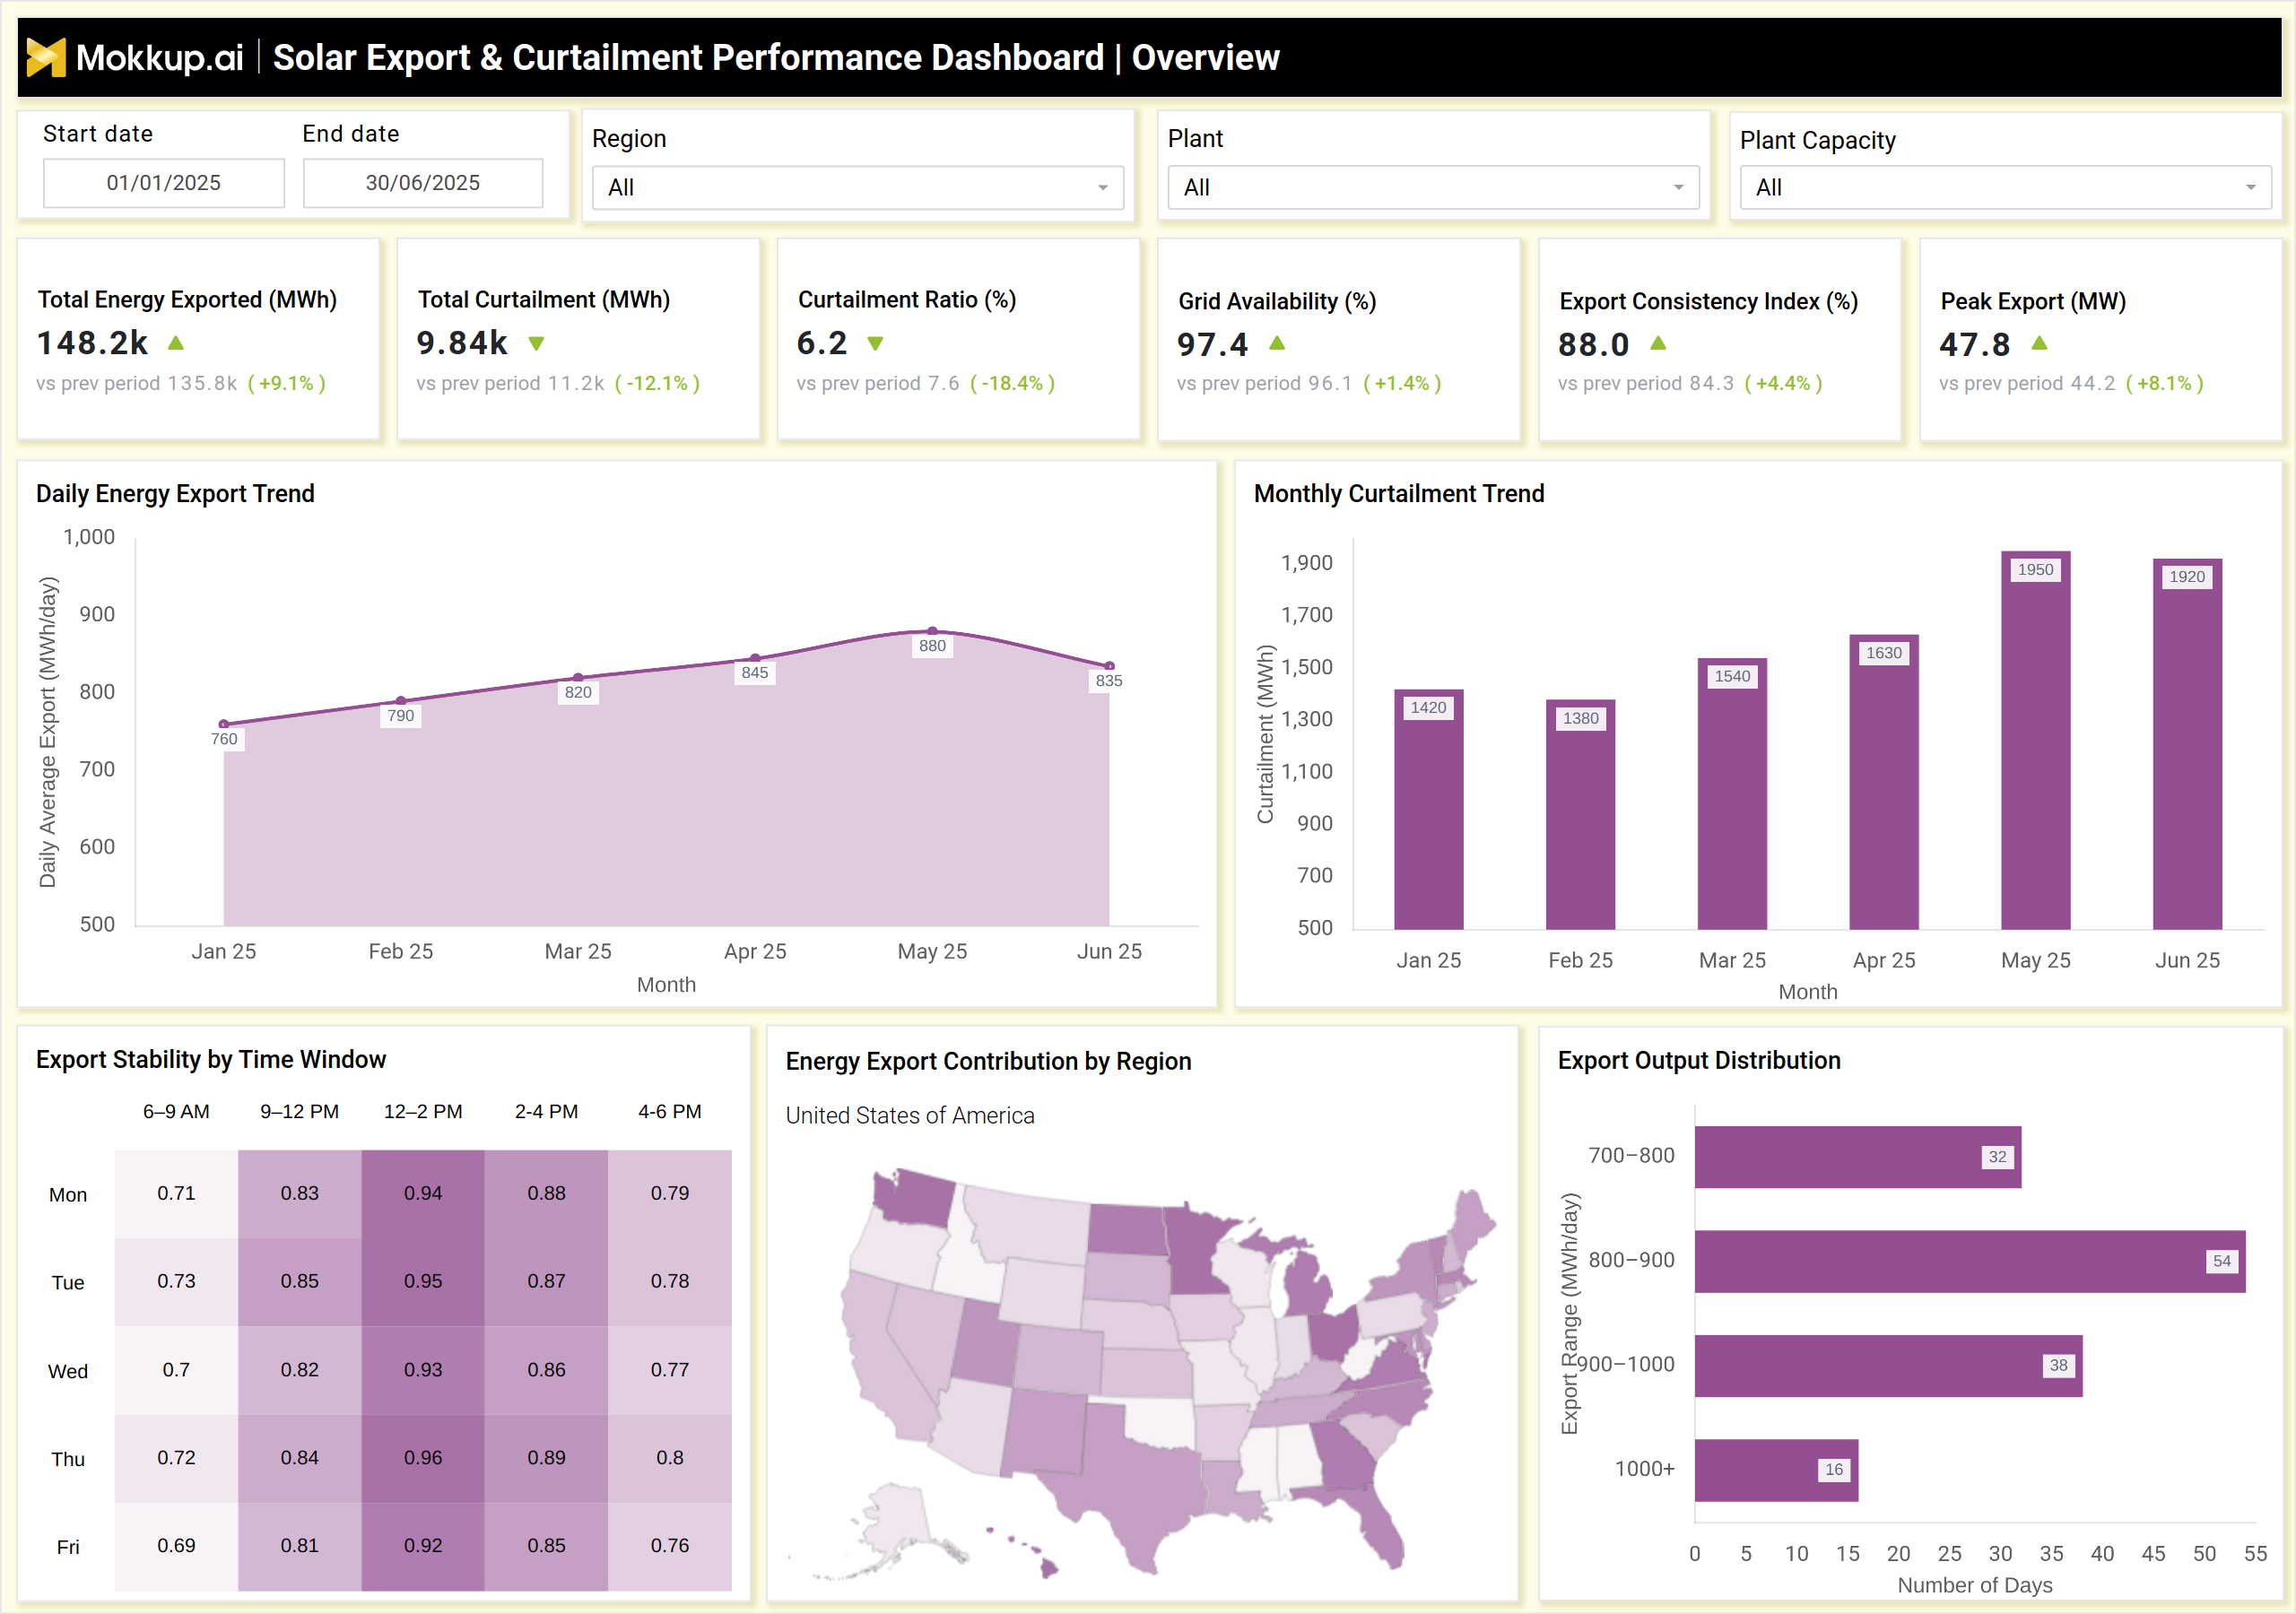
The example dashboard displays a full view of solar export performance with KPIs such as Total Energy Exported (MWh), Total Curtailment, Curtailment Ratio (%), Grid Availability (%), Export Consistency Index (%), and Peak Export (MW). Line and bar trends illustrate monthly export behavior and curtailment patterns, while regional maps show where export limitations occur nationwide. Additional visuals include Export Stability by Time Window, Regional Export Contribution, and Export Output Distribution, enabling operators to evaluate hourly export stability and daily energy distribution.
The second section serves as a utility-scale solar export limitation and curtailment analysis tool, highlighting the primary causes of curtailment events, including grid congestion, overvoltage, frequency control, and grid outages. Heatmaps reveal hourly curtailment intensity, while stacked bar charts show weather-driven curtailment impacts, including cloud cover, temperature haze, and storm influence. Tables listing incident-level details provide transparency into root causes, energy lost, severity, and fix duration. Together, these views form a complete solar plant grid export vs curtailment performance analytics solution that helps utilities diagnose losses and optimize grid export operations.
How to Analyze Data in Solar Export & Curtailment Performance Dashboard
Here is how you can analyze data from this renewable energy export curtailment tracking and loss evaluation dashboard:
- Track daily and monthly export trends to identify peak export periods.
- Compare export stability across time windows to detect variability during specific hours.
- Measure curtailment ratios to quantify energy losses caused by grid restrictions.
- Analyze regional export distribution to identify areas with higher grid acceptance levels.
- Review curtailment drivers to understand grid congestion, over-voltage, or equipment issues.
- Evaluate the weather's influence on connecting irradiance fluctuations with export reduction.
- Monitor export consistency and grid availability metrics to assess the reliability of plant infrastructure.
- Utilize incident-level details to enhance operational planning and minimize repeat curtailment events.
Benefits of Solar Export & Curtailment Performance Dashboard
The solar power curtailment root cause and grid limitation analysis platform has following advantages:
- Improves visibility into export efficiency across all grid regions.
- Reduces energy losses by identifying the drivers of frequent curtailment and their impact.
- Helps utilities optimize grid integration for large-scale solar plants.
- Supports planning for infrastructure upgrades based on regional constraint patterns.
- Enhances forecasting accuracy using export stability and variability trends.
- Strengthens decision-making with real-time comparisons of export vs. curtailment.
- Accelerates root-cause detection for curtailment events using detailed incident logs.
- Increases operational uptime through better scheduling and grid coordination.
KPIs to Track in Solar Export & Curtailment Performance Dashboard
The following key KPIs can be tracked by using this dashboard:
- Total Energy Exported (MWh): Measures the total solar output delivered to the grid.
- Total Curtailment (MWh): Quantifies the energy lost due to grid restrictions.
- Curtailment Ratio (%): Indicates the percentage of potential generation curtailed.
- Grid Availability (%): Indicates the frequency at which the grid is ready to accept solar power.
- Export Consistency Index (%): Measures stability and performance across time intervals.
- Peak Export (MW): Identifies maximum export capacity achieved during the period.
- Monthly Curtailment Trend (MWh): Highlights curtailment fluctuations over time.
- Export Stability by Time Window: Evaluates performance during key daily intervals.
- Curtailment Events (Count): Tracks the frequency of grid-driven export limitations.
- Major Curtailment Drivers: Breakdowns caused by congestion, outages, or voltage issues.
- Weather-Driven Curtailment (%): Shows the proportion of curtailment caused by climate factors.
- Recoverable Export Potential (MWh): Estimates the energy that could be exported with mitigation.
Frequently Asked Questions
1. What causes solar curtailment in utility-scale plants?
Common causes include grid congestion, overvoltage, scheduled maintenance, storms, and limited transmission capacity.
2. Why is export consistency important?
Consistency ensures stable grid operations and reduces power fluctuations that affect system reliability.
3. Can curtailment be avoided altogether?
Not entirely, but optimized grid planning, storage integration, and predictive maintenance can significantly reduce it.