What is a Coal Power Plant Grid Reliability Dashboard?
A Coal Power Plant Grid Reliability Dashboard is an integrated analytics solution designed to monitor and improve grid stability, minimize downtime, and ensure efficient power distribution. It combines outage data, performance metrics, and fault analysis to give operators a detailed view of the power system’s operational health. This power generation reliability analytics dashboard consolidates data across transmission, generation, and distribution units. It enables teams to identify patterns in outages, calculate restoration efficiency, and track performance deviations that may affect electricity supply reliability. By utilizing advanced visualization tools, the dashboard enables energy managers to proactively manage grid operations, balance energy loads, and maintain compliance with reliability standards, thereby ensuring an uninterrupted power supply and enhanced system resilience.
How to Create a Coal Power Plant Grid Reliability Dashboard
You don’t need to build your report from scratch—just start with a ready-to-use dashboard template from Mokkup. Add in your data and export it however you like. Here’s how to do it:
1. Create or Log in to Your Mokkup Account
Start by signing up on Mokkup.ai using your email. If you already have an account, just log in, and you’ll be good to go.
2. Choose and Customize Your Dashboard Template
Find the Coal Power Plant Grid Reliability Dashboard template in the Templates section. Use the drag-and-drop editor to adjust KPIs, edit filters, or add elements based on your data.
3. Export to Your BI Tool
Once your dashboard wireframe is ready, use the BI Tool Export feature to send it directly to Power BI or Tableau for further analysis and enhancements. You can also download the dashboard as a PDF, PNG, or JPEG, embed it on a platform, or invite your team to collaborate.
Note: This is a Pro template. You’ll need a Pro subscription on Mokkup to use and customize this dashboard wireframe. Upgrade anytime to unlock full access.
Coal Power Plant Grid Reliability Dashboard Example
You can create a Coal Power Plant Grid Reliability Dashboard that unifies multiple analytics layers for complete operational visibility. The Outage & Reliability Analytics Dashboard captures key indicators such as SAIDI (System Average Interruption Duration Index) and SAIFI (System Average Interruption Frequency Index). These help in quantifying grid reliability by showing outage frequency and duration. It categorizes outages by type, including planned, unplanned, or emergency, and identifies fault causes such as equipment failure, human error, or adverse weather conditions. Visual elements, such as outage type distribution, reliability trends, and fault cause analysis, make it easier to identify recurring issues and refine response strategies.
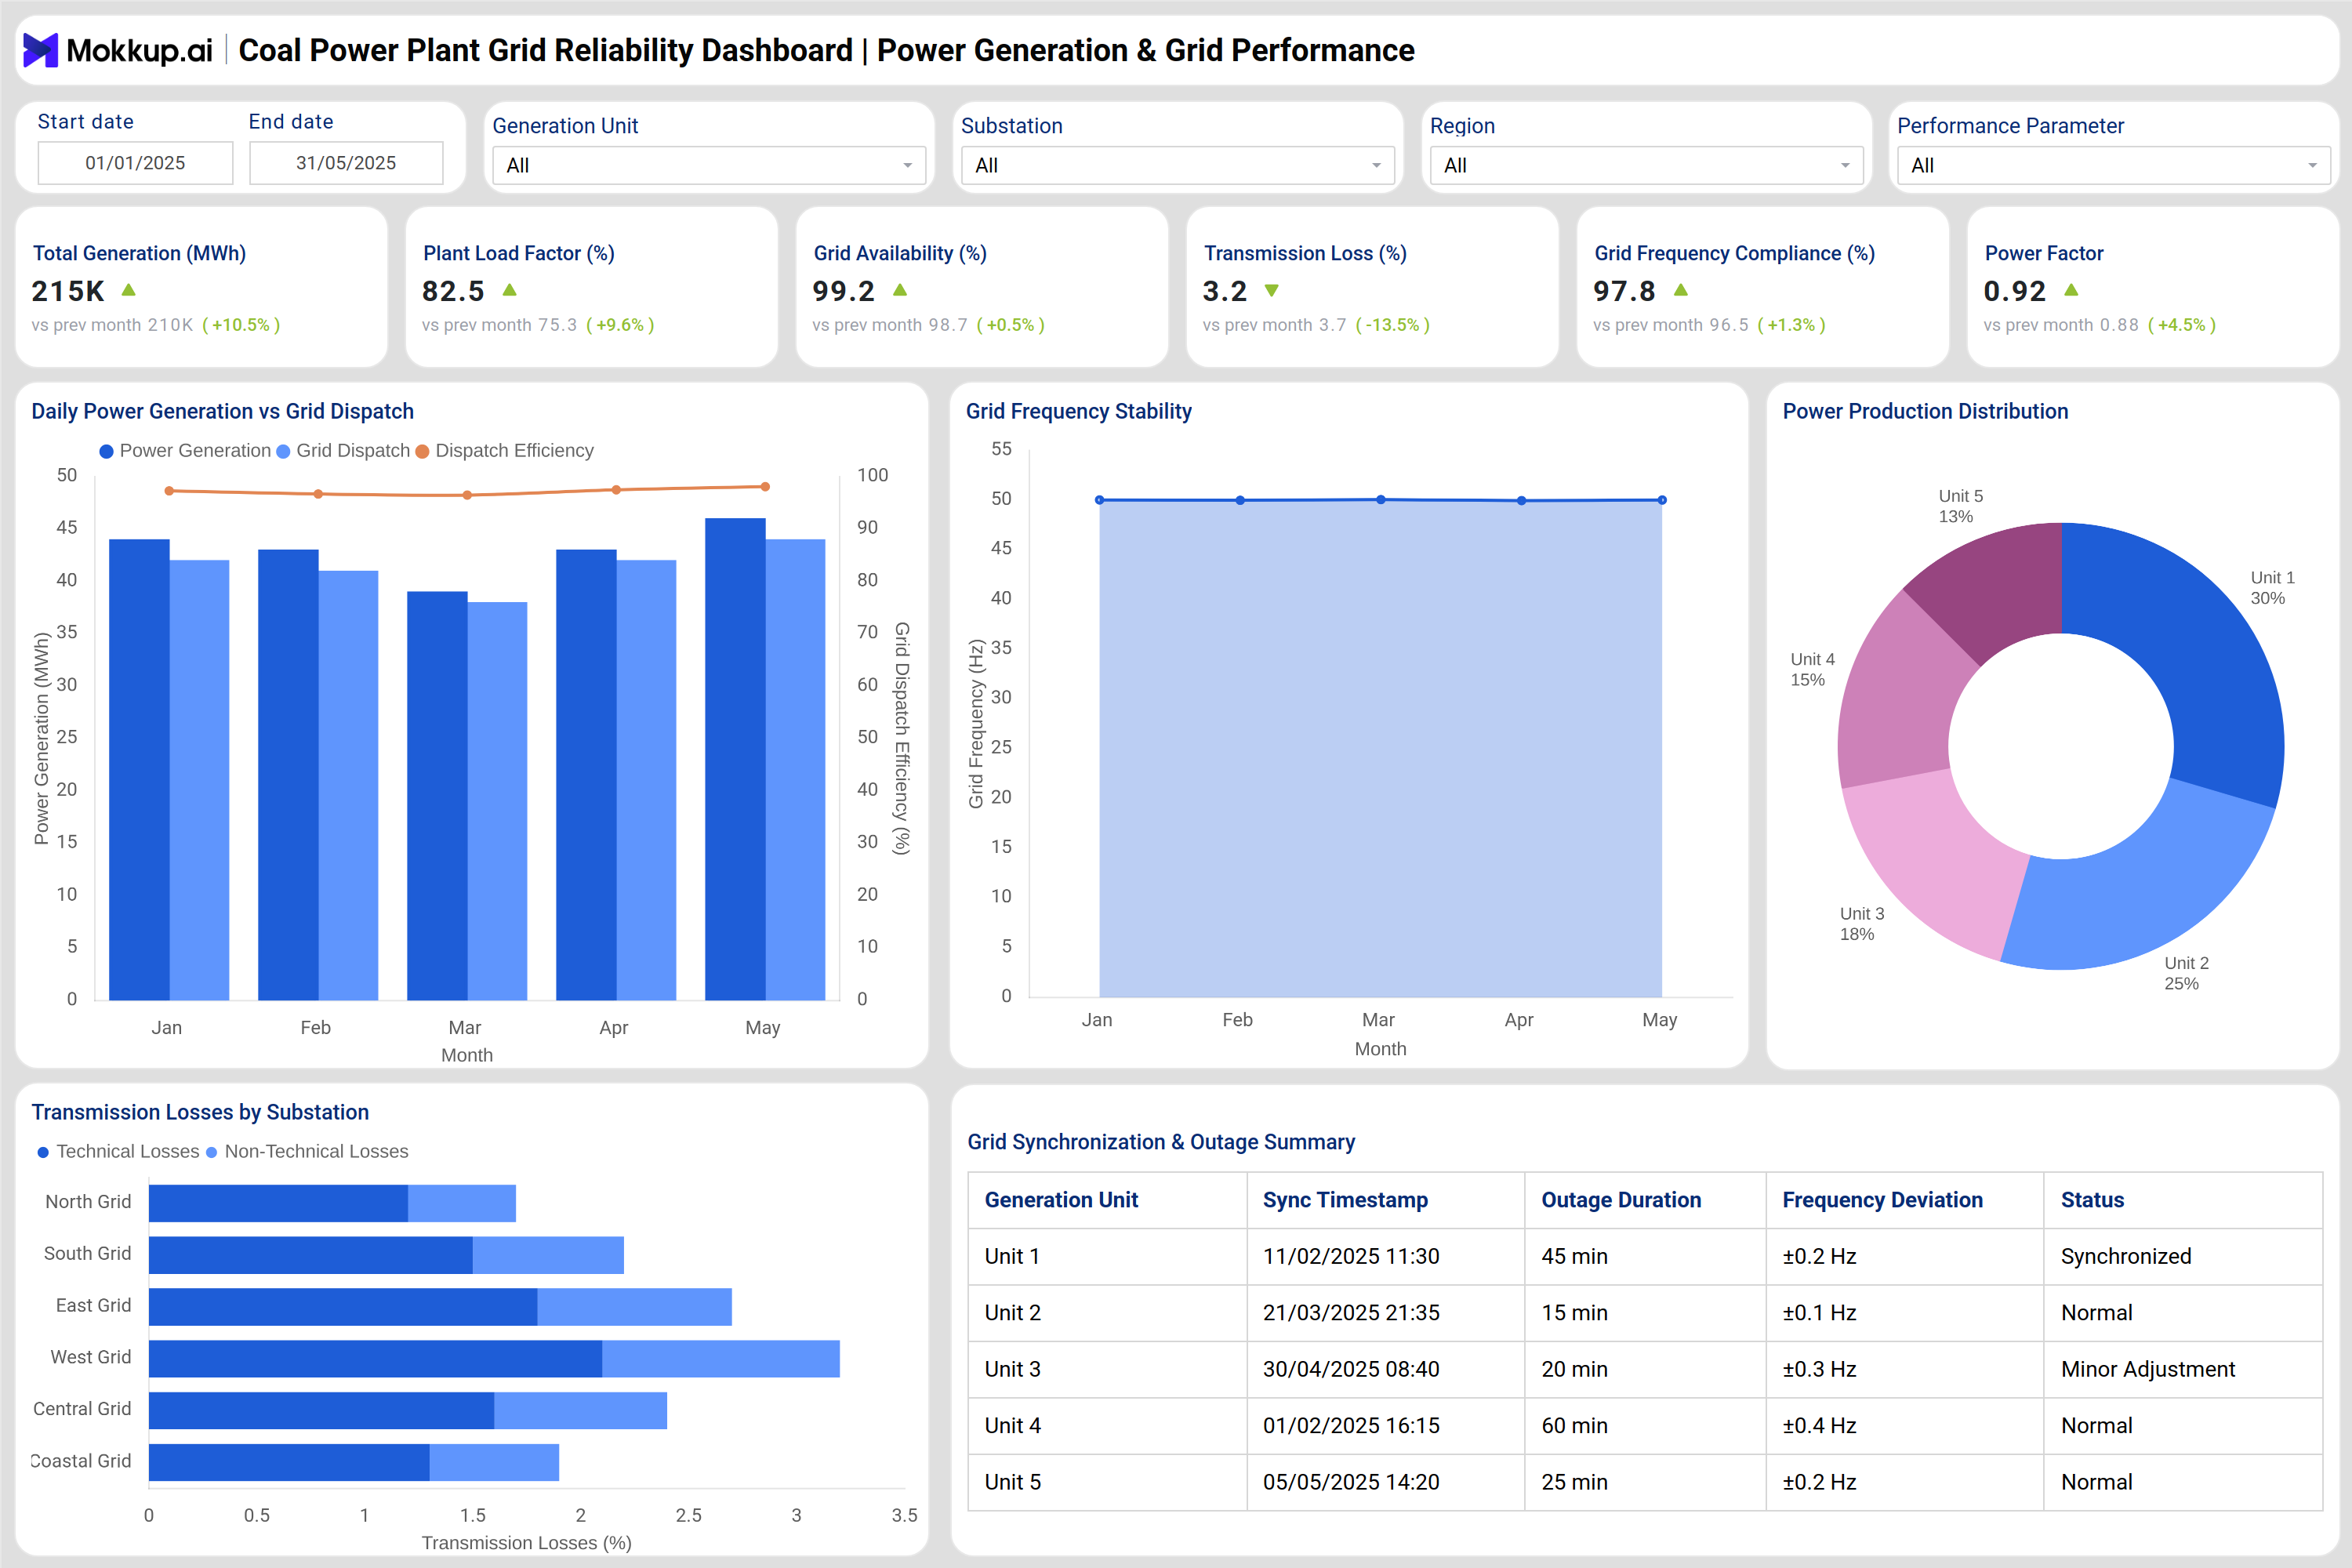
The Power Generation & Grid Performance Dashboard measures grid availability, frequency compliance, and power production distribution. It provides visibility into generation versus dispatch efficiency, transmission losses by substation, and frequency deviation during synchronization. This coal plant grid performance monitoring system ensures efficient coordination between power generation and distribution units, maintaining balance and stability across the grid. Together, these dashboards create a unified energy distribution reliability reporting tool, helping utilities analyze the causes of downtime, monitor recovery times, and maintain grid performance under varying operational loads.
How to Analyze Data in Coal Power Plant Grid Reliability Dashboard
Here is how you can analyze data from this dashboard:
- Monitor SAIDI and SAIFI Trends: Evaluate reliability performance by tracking outage duration and frequency over time.
- Identify Fault Causes: Categorize incidents by cause (equipment, weather, or operational) to implement targeted maintenance.
- Analyze Energy Loss by Region: Compare energy losses across grids to locate inefficiencies in transmission and distribution.
- Evaluate Grid Availability and Power Factor: Ensure optimal utilization and load balance across all substations.
- Track Outage Performance Logs: Use regional outage data to analyze downtime patterns and restoration efficiency.
- Review Synchronization and Frequency Data: Monitor generation unit synchronization and deviation stability for grid safety.
- Correlate Maintenance Schedules: Align fault data with preventive maintenance to minimize unexpected downtimes.
Benefits of Coal Power Plant Grid Reliability Dashboard
- Enhanced Grid Stability: Supports grid stability and downtime analysis to minimize disruptions and ensure consistent power delivery.
- Centralized Outage Management: Combines outage reporting, performance metrics, and reliability indicators in a single view for better outage management.
- Improved Operational Efficiency: Provides actionable insights for optimizing generation and reducing transmission losses.
- Data-Driven Decision Making: Empowers utilities with historical and performance data for predictive planning.
- Optimized Maintenance Scheduling: Helps identify high-risk equipment and plan maintenance to prevent large-scale failures.
- Transparent Reliability Reporting: Enables clear visibility across units through an integrated power utilities outage tracking dashboard.
- Sustainability and Compliance Support: Aligns power reliability with energy efficiency standards and environmental goals.
- Reduced Downtime Costs: Minimizes outage-related losses through faster fault detection and recovery time management.
KPIs to Track in Coal Power Plant Grid Reliability Dashboard
- SAIDI (System Average Interruption Duration Index) – Measures total outage time per customer over a defined period.
- SAIFI (System Average Interruption Frequency Index) – Tracks how often customers experience outages.
- Grid Availability (%) – Indicates uptime and operational readiness of the power distribution system.
- Transmission Loss (%) – Differentiates between technical and non-technical losses by substation or region.
- Grid Frequency Compliance (%) – Measures adherence to grid frequency standards for stable operation.
- Power Factor – Evaluates energy efficiency and utilization rate across units.
- Mean Time to Restore (hours) – Monitors average response time to restore service after an outage.
- Fault Clearance Efficiency (%) – Reflects the speed and effectiveness of issue resolution.
- Energy Loss by Cause (MWh) – Quantifies losses due to maintenance, equipment failure, or weather conditions.
- Plant Load Factor (%) – Assesses how effectively the plant’s capacity is being utilized.
Frequently Asked Questions
1. What is the purpose of a Coal Power Plant Grid Reliability Dashboard?
It is used to monitor power distribution performance, identify outage causes, and ensure stable and reliable grid operations.
2. How does this dashboard help utilities reduce downtime?
By providing outage analytics and grid stability and downtime analysis, it helps utilities detect issues early and speed up restoration.
3. What role does this play in energy efficiency?
It helps track transmission losses and power factors, supporting efficient energy generation and delivery.