
What is a Solar Asset Reliability & Maintenance Dashboard?
A Solar Asset Reliability & Maintenance Dashboard is a specialized analytics system that helps utility-scale solar operators track equipment reliability, maintenance performance, component failures, and operational risks. It consolidates real-time and historical data from SCADA, CMMS, and inverter systems to provide a unified view of fleet health. The dashboard supports structured O&M planning, corrective action tracking, and predictive maintenance.
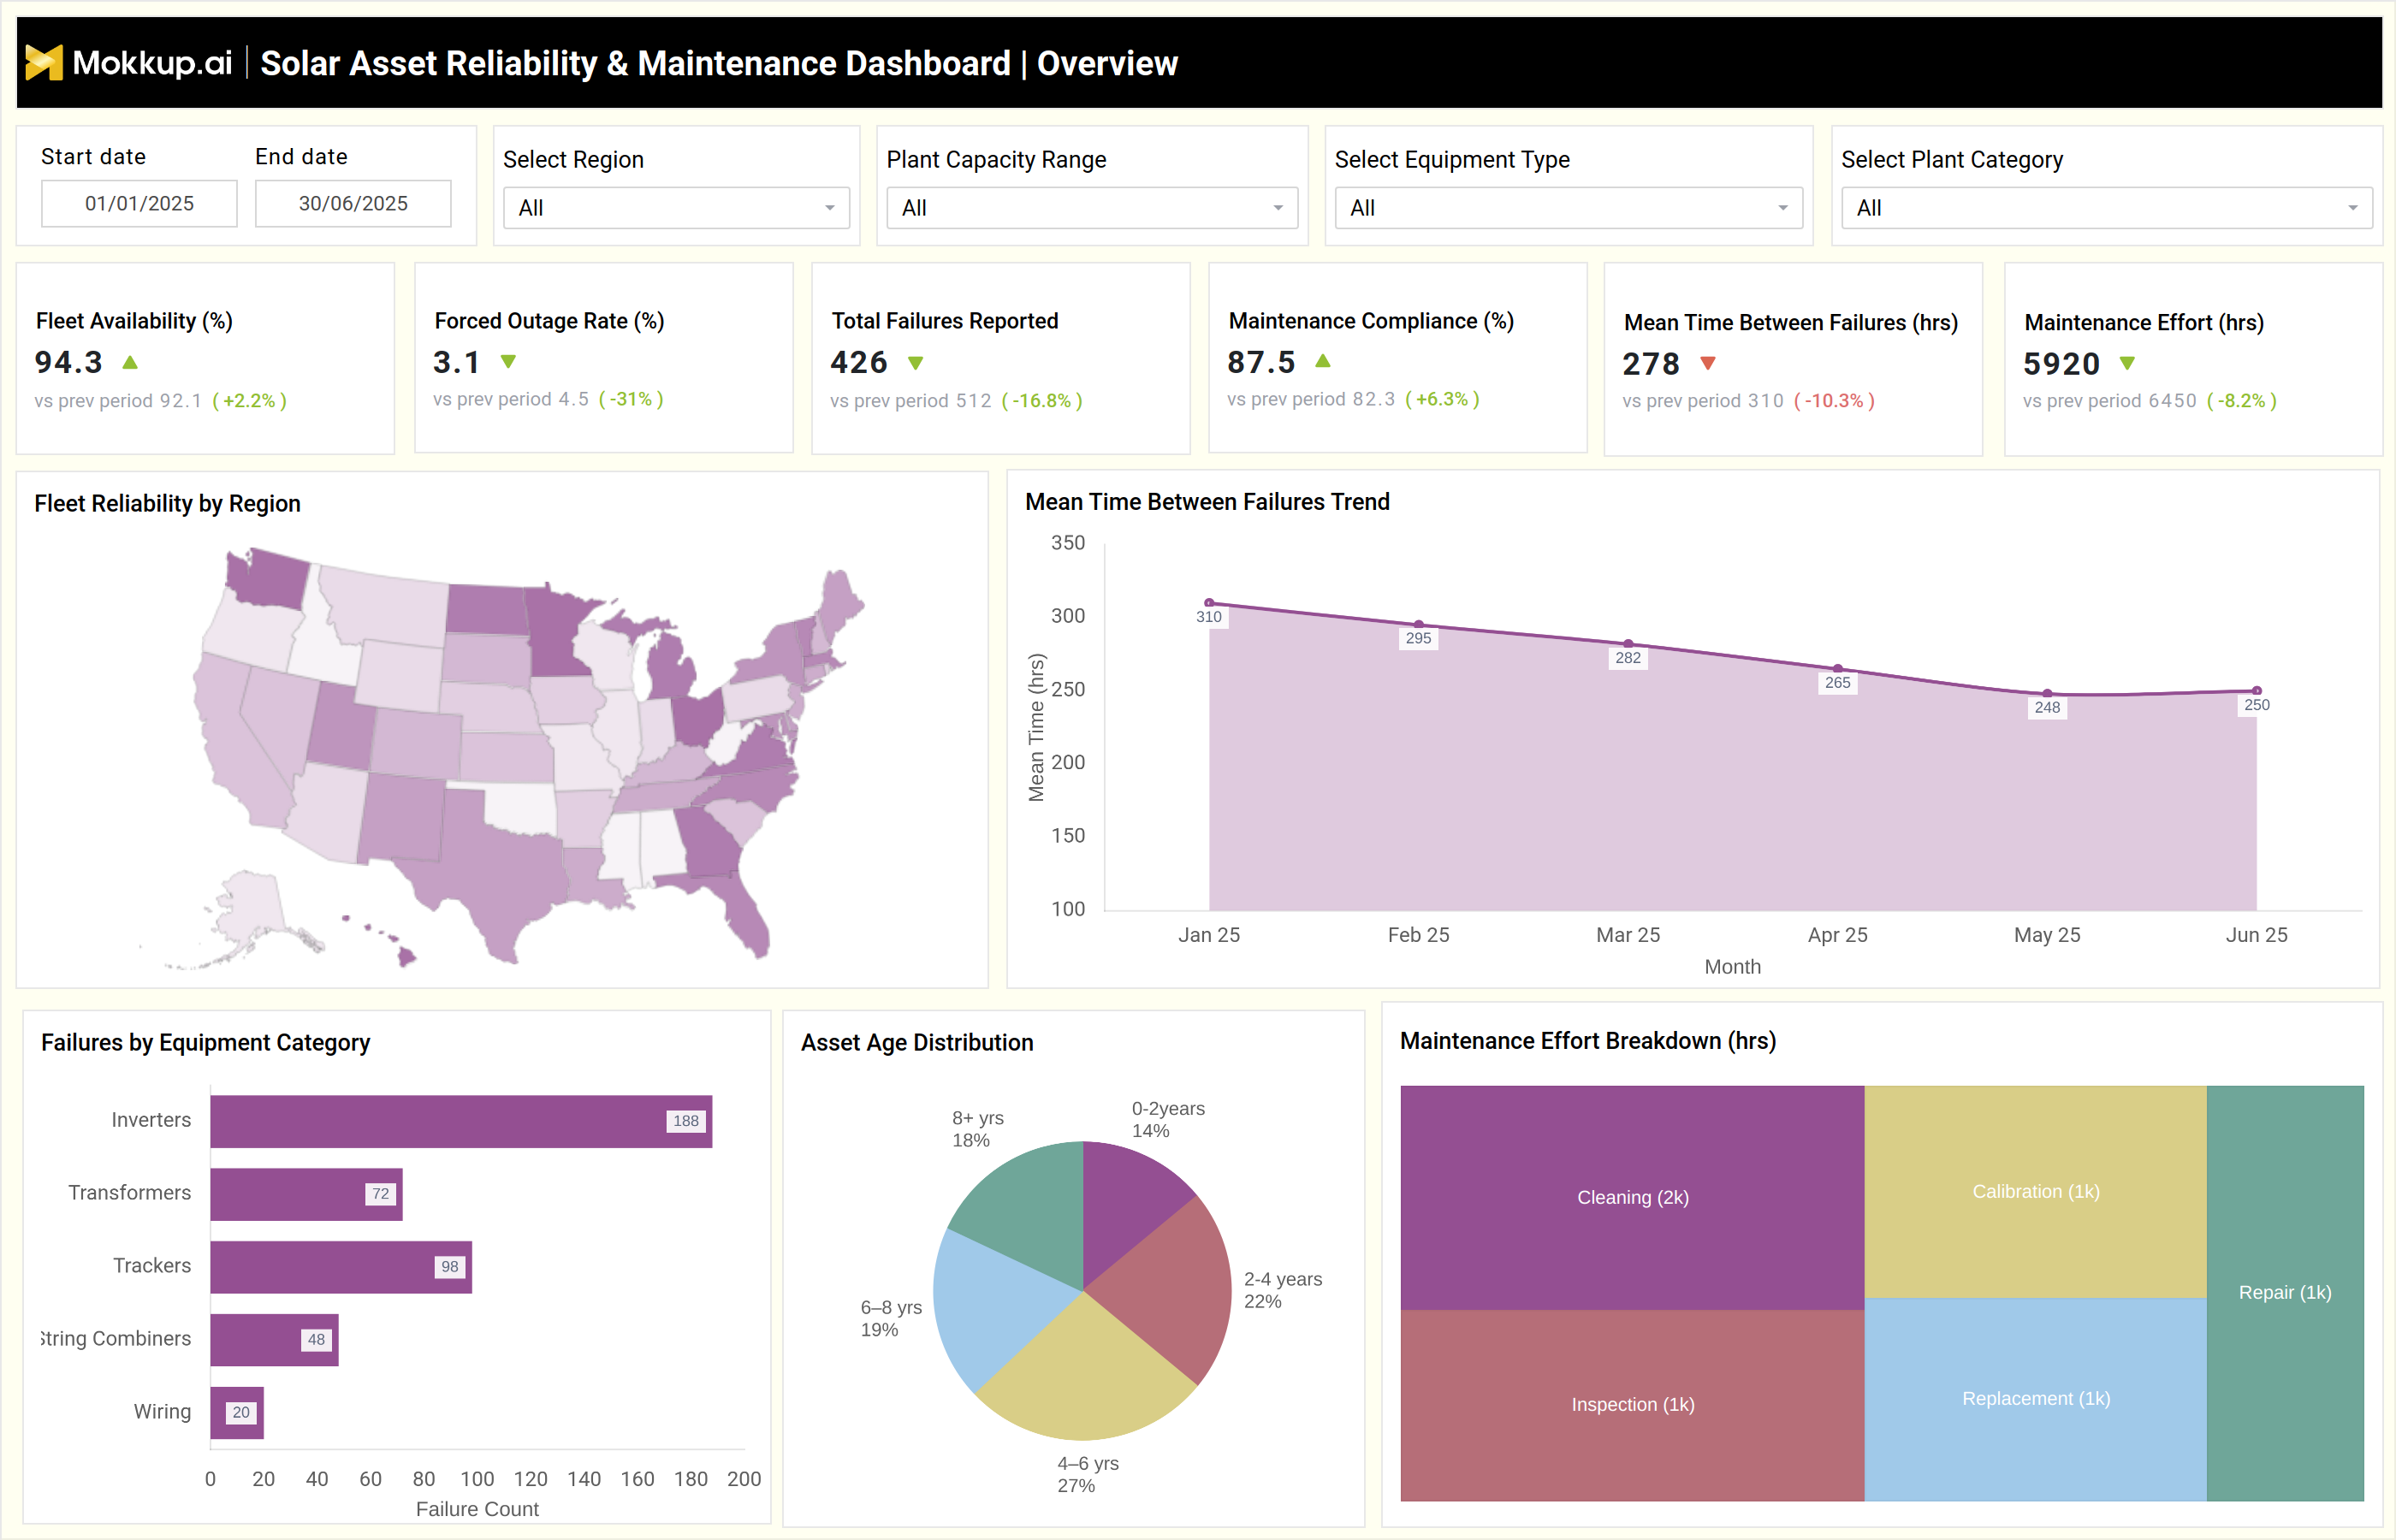
Metrics such as fleet availability, forced outage rate, failure count, MTBF, and maintenance compliance help identify where reliability gaps exist. By integrating insights from a solar asset reliability and maintenance performance dashboard with work order data, equipment age, and failure trends, operators can reduce downtime, optimize maintenance schedules, and extend asset life. This makes it a critical tool for monitoring and analyzing the reliability of utility-scale solar plants at both the plant and fleet levels.
How to Create a Solar Asset Reliability & Maintenance Dashboard
You don’t need to build your report from scratch, just start with a ready-to-use dashboard template from Mokkup. Add in your data and export it however you like. Here’s how to do it:
1. Create or Log in to Your Mokkup Account
Start by signing up on Mokkup.ai using your email. If you already have an account, just log in, and you’ll be good to go.
2. Choose and Customize Your Dashboard Template
Find the Solar Asset Reliability & Maintenance Dashboard template in the Templates section. Use the drag-and-drop editor to adjust KPIs, edit filters, or add elements based on your data.
3. Export to Your BI Tool
Once your dashboard wireframe is ready, use the BI Tool Export feature to send it directly to Power BI or Tableau for further analysis and enhancements. You can also download the dashboard as a PDF, PNG, or JPEG, embed it on a platform, or invite your team to collaborate.
Note: This is a Pro template. You’ll need a Pro subscription on Mokkup to use and customize this dashboard wireframe. Upgrade anytime to unlock full access.
Solar Asset Reliability & Maintenance Dashboard Example
The example dashboard above provides a comprehensive view of solar plant equipment health and O&M performance across multiple regions. The first screen displays high-level fleet reliability metrics, including Fleet Availability, Forced Outage Rate, Total Failures Reported, Maintenance Compliance, Mean Time Between Failures (MTBF), and Total Maintenance Effort. Visualizations, such as the Fleet Reliability by Region map, the Failure by Equipment Category bar chart, and the MTBF Trend chart, help operators assess where reliability issues are concentrated. Additional components, such as Asset Age Distribution and Maintenance Effort Breakdown, give deeper context about aging equipment and O&M workload patterns.
The second screen focuses on maintenance operations, including preventive and corrective action performance, as well as failure root cause analysis. Charts like Maintenance Risk Contribution Across Asset Groups, Major Failure Drivers, and Preventive Maintenance Completion provide insight into operational weaknesses. The dashboard also includes Spare Part Stock-out tracking and a Corrective Maintenance Action Summary, making it a complete renewable energy asset maintenance tracking and downtime dashboard. With these visuals, solar operators can analyze inverter reliability, failure trends, part shortages, and maintenance efficiency through a solar equipment failure analysis and predictive maintenance platform.
How to Analyze Data in Solar Asset Reliability & Maintenance Dashboard
You can analyze data in the solar plant maintenance scheduling and work order tracking dashboard in the following ways:
- Identify regions with low fleet availability using the geographic heatmap.
- Review MTBF trends to detect worsening reliability patterns.
- Analyze the failure distribution by equipment type (e.g., inverters, transformers, trackers).
- Compare planned vs. completed preventive maintenance activities.
- Track spare part stock-outs to understand operational bottlenecks.
- Examine major failure drivers to determine root causes of downtime.
- Evaluate maintenance backlog levels to prioritize high-impact assets.
- Review corrective action timelines and the impact of downtime associated with repairs.
- Cross-reference asset age distribution with failure counts to plan replacements.
- Monitor recoverable reliability gains to measure improvements in maintenance efficiency.
Benefits of Solar Asset Reliability & Maintenance Dashboard
Here are the benefits of using this solar inverter reliability performance monitoring dashboard:
- Improves uptime by accurately monitoring forced outages and equipment failures.
- Supports predictive maintenance by identifying early indicators of failure.
- Reduces revenue loss through faster issue detection and quicker repair actions.
- Optimizes maintenance workload with clear visibility of planned vs. completed tasks.
- Enhances inverter reliability performance monitoring across fleet-wide systems.
- Prevents operational disruptions caused by stockouts of spare parts.
- Improves asset lifecycle planning with equipment age and health insights.
- Strengthens decision-making using a power plant asset health and reliability analytics dashboard.
- Reduces repeat failures by identifying root causes and operational patterns.
- Helps teams comply with O&M contracts by maintaining high maintenance compliance levels.
KPIs to Track in Solar Asset Reliability & Maintenance Dashboard
The Utility-scale solar plant reliability monitoring and analytics tool enables tracking KPIs like:
- Fleet Availability (%): Measures total operable plant capacity.
- Forced Outage Rate (%): Tracks unplanned downtime across equipment.
- Total Failures Reported: Counts component failures within the time period.
- Maintenance Compliance (%): Indicates adherence to scheduled maintenance tasks.
- Maintenance Effort (Hours): Total O&M labor hours spent on maintenance activities.
- Failure Count by Category: Tracks failures for inverters, transformers, trackers, etc.
- Maintenance Backlog (Count): Number of overdue maintenance tasks.
- Repeat Failure Incidents: Recurrent failures indicate underlying systemic issues.
- Spare Part Stock-outs (Count): Tracks shortage events causing repair delays.
- Major Failure Drivers: Identifies top causes such as cooling failure, dust intrusion, or loose connections.
- Preventive Maintenance Completion: Completed work versus scheduled activities.
- Recoverable Reliability Gain (%): Measures improvements achievable through corrective actions.
- Downtime Impact (Hours): Total energy production loss due to failures.
Frequently Asked Questions
1. Who uses a Solar Asset Reliability & Maintenance Dashboard?
Utility operators, O&M teams, asset managers, EPCs, IPPs, and reliability engineers.
2. What data sources feed into this dashboard?
SCADA logs, inverter monitoring systems, CMMS, weather stations, and maintenance work order records.
3. Can this dashboard help reduce downtime?
Yes. By identifying failure hotspots and monitoring MTBF and maintenance backlog, teams can address issues faster.
4. Does the dashboard support predictive maintenance?
Yes. Failure patterns, component age, and reliability trends help predict and prevent future outages.