
What is a Plant Maintenance Dashboard?
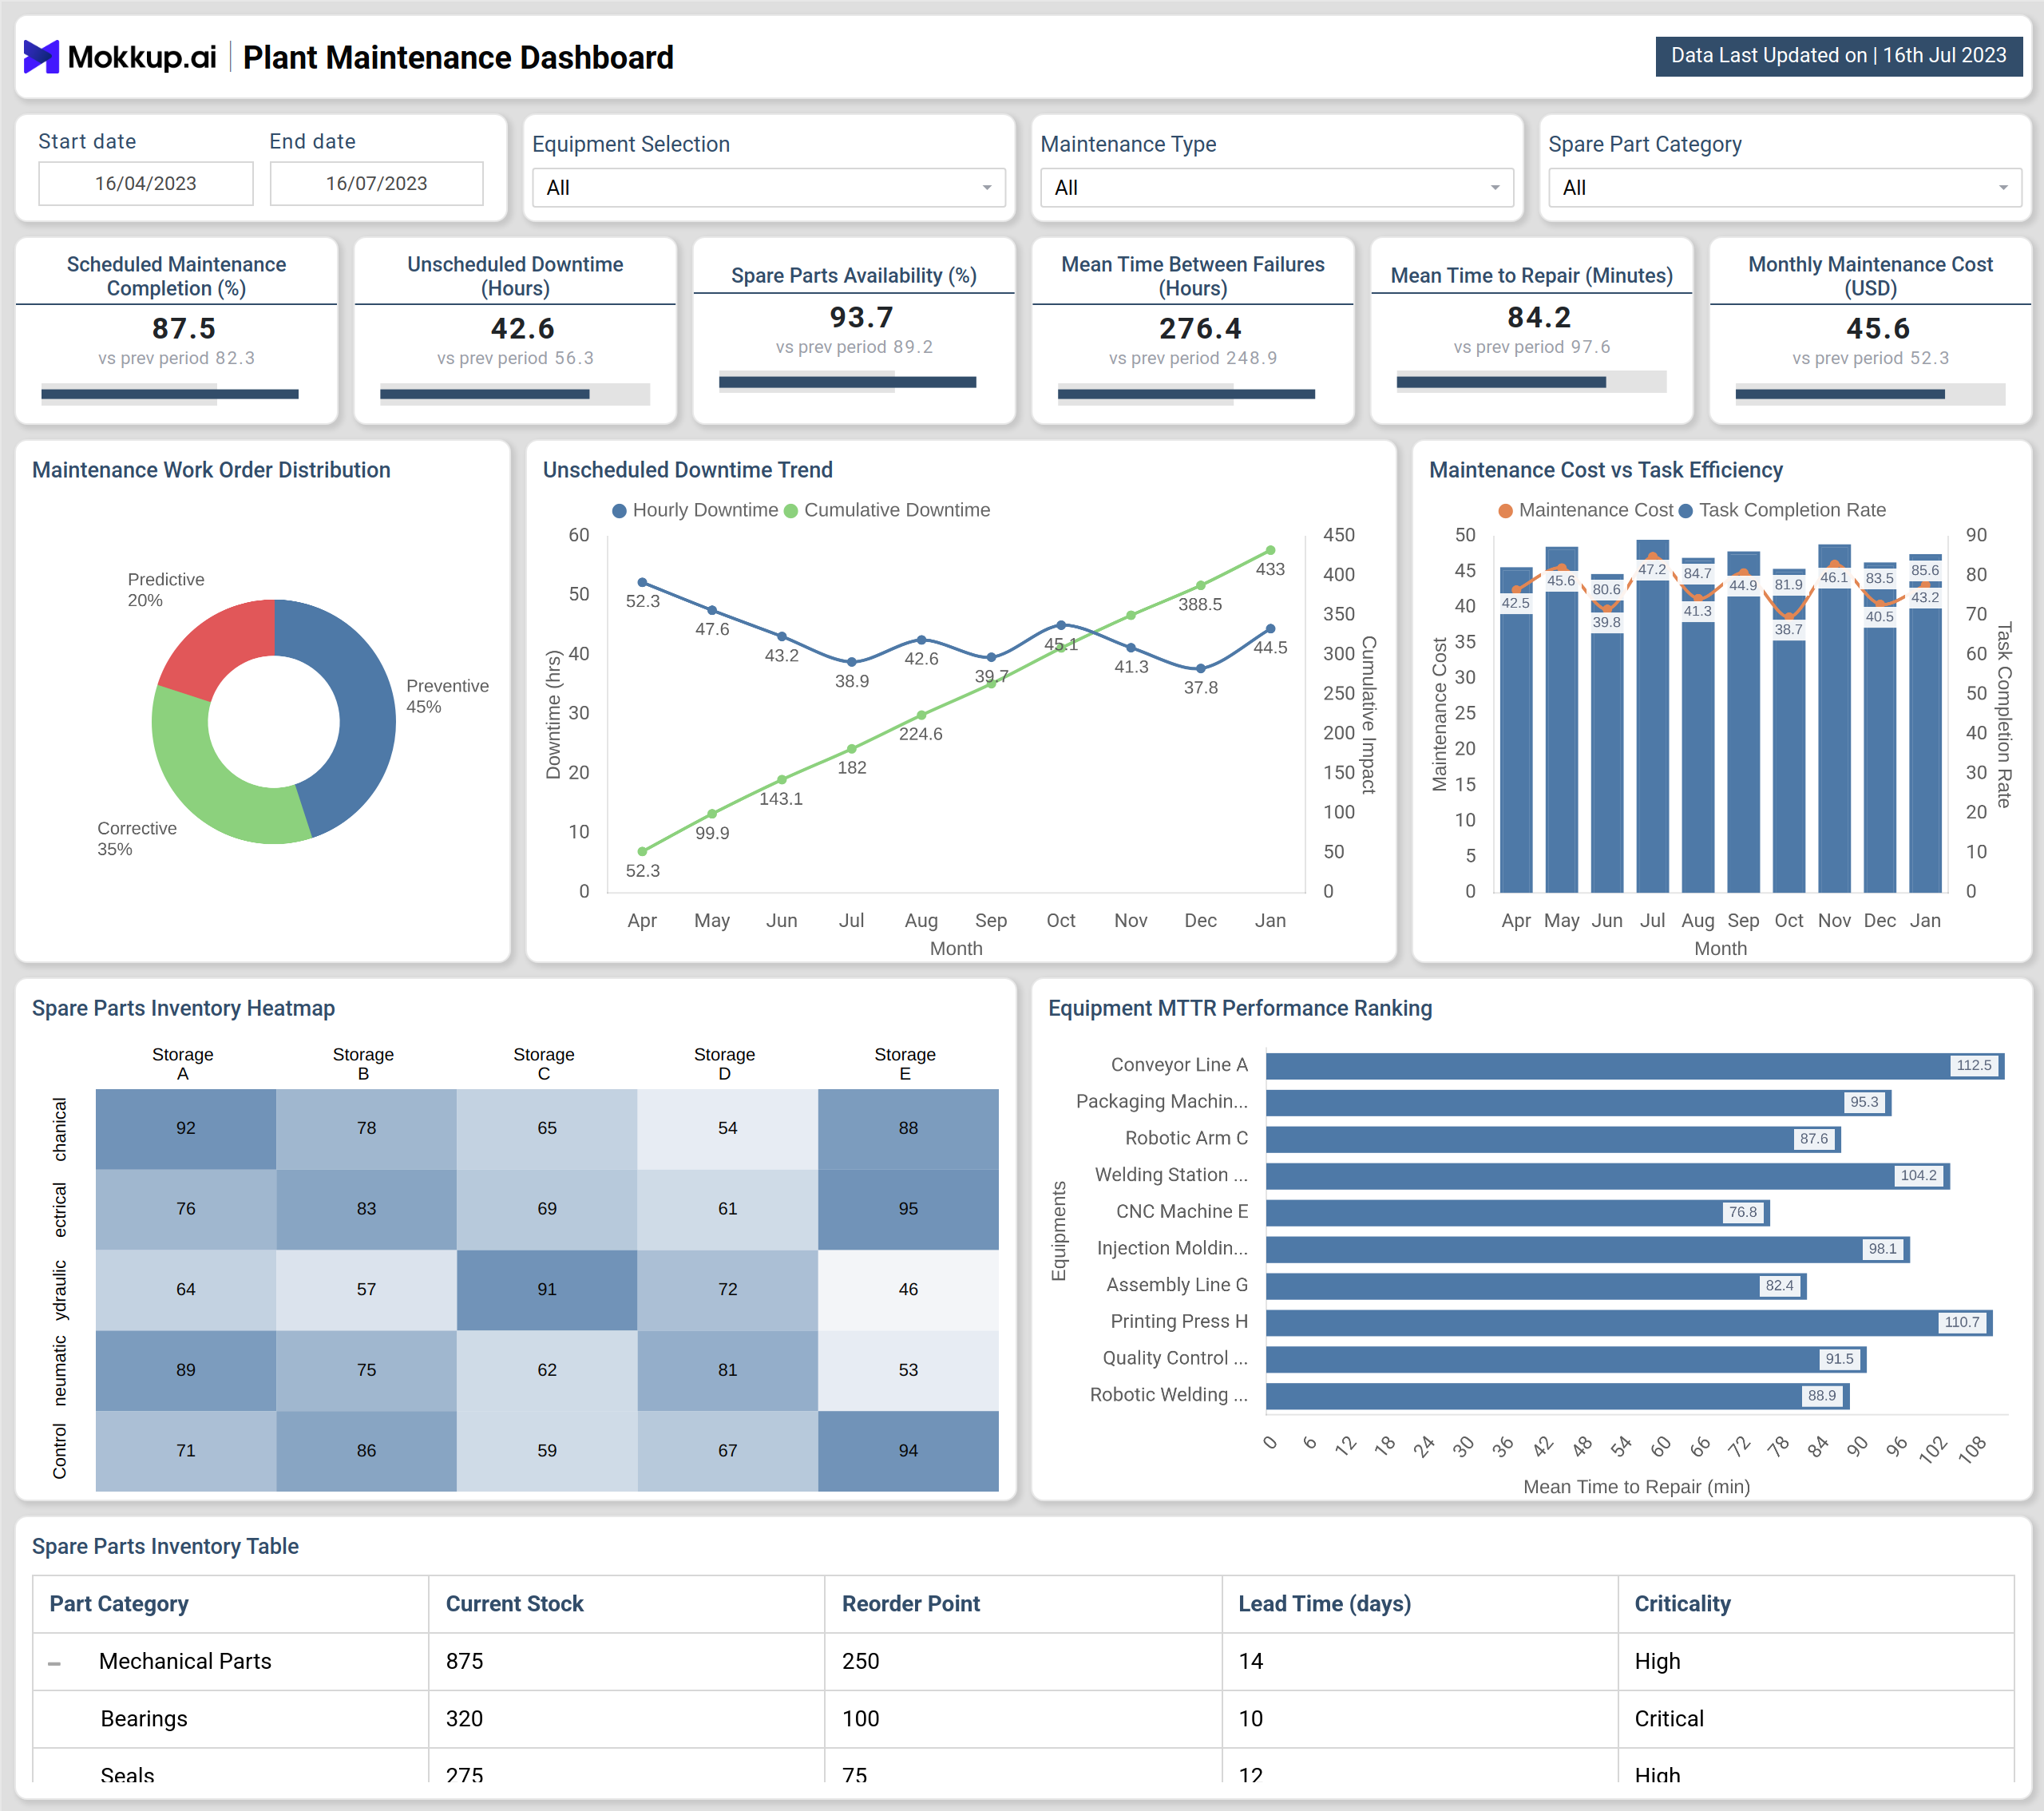
A Plant Maintenance Dashboard is a manufacturing analytics tool that centralizes maintenance KPIs in one view. It provides visibility into metrics such as Scheduled Maintenance Completion, Unscheduled Downtime, Spare Parts Availability, Mean Time Between Failures (MTBF), Mean Time to Repair (MTTR), and Monthly Maintenance Costs. This type of dashboard helps maintenance managers track efficiency, reduce unexpected breakdowns, and optimize equipment performance. By consolidating maintenance data, it becomes easier to make informed decisions and keep operations running smoothly.
Plant Maintenance Dashboard Example
Create your personalized maintenance KPI dashboard, bringing all essential metrics into one structured layout. The Mokkup Plant Maintenance Dashboard wireframe includes visualizations such as Maintenance Work Order Distribution, Unscheduled Downtime Trend, Maintenance Cost vs. Task Efficiency, Spare Parts Inventory Heatmap, MTTR Performance Ranking, and Spare Parts Inventory Tables. With filter options for date, equipment, maintenance type, and spare part category, the dashboard can be tailored to specific needs. Once populated with data, it can be exported to BI tools like Power BI or Tableau for further analysis, making it a practical solution for plant reliability and cost optimization.
How To Create Plant Maintenance Dashboards
You don’t need to build your report from scratch, just start with a ready-to-use sample Plant Maintenance Dashboard template from Mokkup. Plug in your own data and export it however you like. Here’s how to do it:
1. Create or Log in to Your Mokkup Account
Start by signing up on Mokkup.ai using your email. Already have an account? Just log in, and you’re good to go.
2. Choose and Customize Your Dashboard Template
Find the Plant Maintenance Dashboard template in the Templates section. Use the drag-and-drop editor to adjust KPIs, edit filters, or add elements based on your data.
3. Export to Your BI Tool
Once your dashboard is ready, use the BI Tool Export feature to send it directly to Power BI or Tableau for further analysis and enhancements. You can also download the dashboard as a PDF, PNG, or JPEG, embed it on a platform, or invite your team to collaborate.
Note: This is a Pro template. To use and customize this dashboard wireframe, you’ll need a Pro subscription on Mokkup. Upgrade anytime to unlock full access.
Benefits of Plant Maintenance Dashboard
A Plant Maintenance Dashboard provides multiple advantages for maintenance teams and plant managers:
- Reduce Downtime: Monitor and address equipment failures faster.
- Improve Efficiency: Track MTBF and MTTR to optimize repair cycles.
- Cost Control: Measure and compare monthly maintenance costs.
- Spare Parts Management: Use inventory heatmaps and tables to avoid stockouts.
- Transparency: Share performance metrics across teams with simple visualizations.
Overall, this dashboard makes it easier to implement preventive maintenance strategies and supports data-driven decisions to improve equipment reliability.
KPIs to Track in the Plant Maintenance Dashboard
Key KPIs include:
- Scheduled Maintenance Completion (%): Tracks adherence to planned maintenance schedules.
- Unscheduled Downtime (Hours): Measures unexpected stoppages that affect production.
- Spare Parts Availability (%): Ensures maintenance teams have the right parts when needed.
- Mean Time Between Failures (MTBF): Evaluates equipment reliability.
- Mean Time to Repair (MTTR): Measures the average time taken to fix equipment.
- Monthly Maintenance Cost (USD): Tracks overall maintenance spending.
By consolidating these KPIs, the dashboard provides a clear picture of maintenance performance and supports continuous improvement.
Frequently Asked Questions
1. Best platforms for plant maintenance dashboard creation
Mokkup is an effective platform for creating Plant Maintenance Dashboards. It offers customizable templates that can be exported to BI tools like Power BI and Tableau for deeper analysis.
2. How do you analyze data in a Plant Maintenance Dashboard?
In Mokkup, enter your data and adjust KPIs such as MTTR, MTBF, and downtime trends. Use filters for equipment, maintenance type, and spare parts to gain targeted insights. Export the dashboard to BI tools for advanced analytics.