
What is an Enterprise Asset Performance Dashboard?
An Enterprise Asset Performance Dashboard is a digital monitoring and analytics tool designed to help organizations manage and optimize their asset portfolios. It provides a unified, real-time view of asset utilization, condition, financial performance, and lifecycle health.
Using an enterprise asset performance monitoring dashboard, companies can track asset availability, maintenance costs, depreciation trends, and compliance risks across departments, locations, or regions. This dashboard acts as a central performance review platform, combining data from multiple systems to support decisions that extend asset lifespan, reduce downtime, and improve return on investment (ROI). With its detailed insights, it enables facility managers, finance teams, and maintenance departments to ensure reliability, compliance, and cost efficiency across all asset categories.
How to Create an Enterprise Asset Performance Dashboard
You don’t need to build your report from scratch—just start with a ready-to-use dashboard template from Mokkup. Add in your data and export it however you like. Here’s how to do it:
1. Create or Log in to Your Mokkup Account
Start by signing up on Mokkup.ai using your email. If you already have an account, just log in, and you’ll be good to go.
2. Choose and Customize Your Dashboard Template
Find the Enterprise Asset Performance Dashboard template in the Templates section. Use the drag-and-drop editor to adjust KPIs, edit filters, or add elements based on your data.
3. Export to Your BI Tool
Once your dashboard wireframe is ready, use the BI Tool Export feature to send it directly to Power BI or Tableau for further analysis and enhancements. You can also download the dashboard as a PDF, PNG, or JPEG, embed it on a platform, or invite your team to collaborate.
Note: This is a Pro template. You’ll need a Pro subscription on Mokkup to use and customize this dashboard wireframe. Upgrade anytime to unlock full access.
Enterprise Asset Performance Dashboard Example
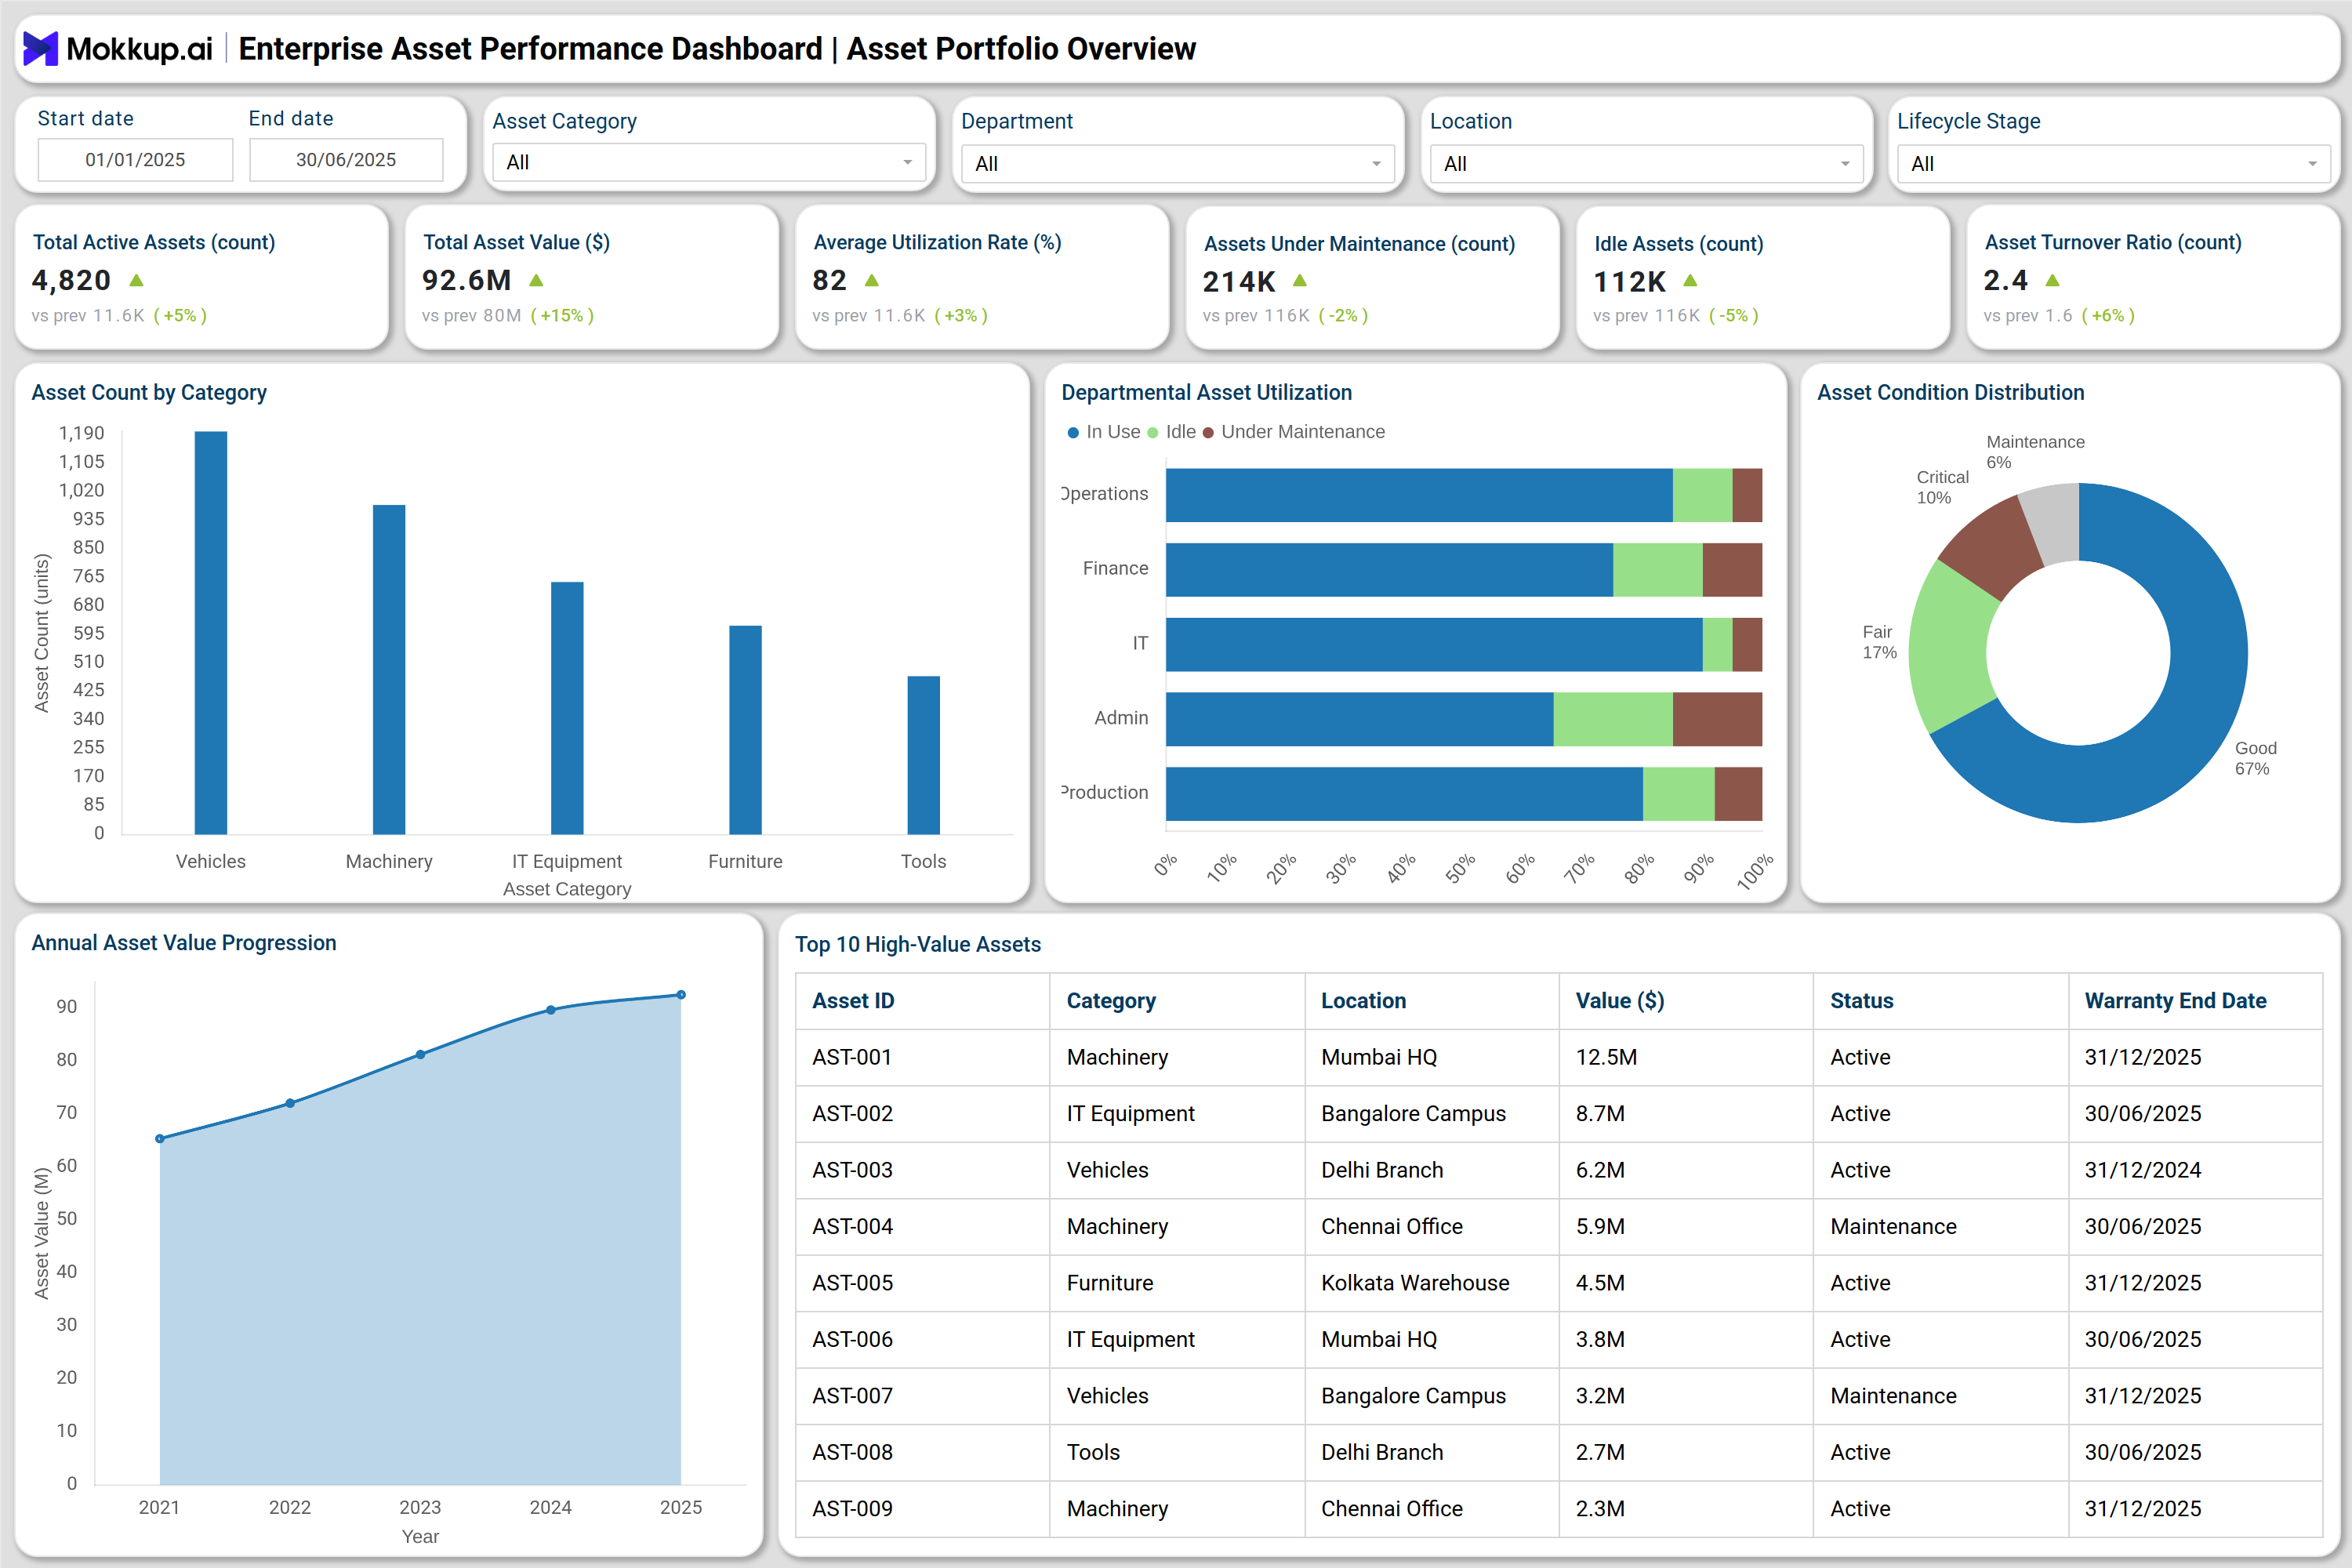
You can create your own enterprise asset performance and reliability dashboard using two connected views: Asset Portfolio & Utilization Overview and Performance, Risk & Financial Insights.
The Asset Portfolio & Utilization Overview screen provides a complete picture of how many assets exist, where they are located, and how efficiently they are being used. It tracks metrics such as total asset count, utilization percentage, idle assets, maintenance load, and turnover ratio. Visual components like category-wise bar charts, utilization rate comparisons, and asset condition donuts make it easy to identify underperforming departments or equipment categories. The table of top-value assets highlights critical items that need monitoring for warranty expiry or performance tracking.
The second screen, Performance, Risk & Financial Insights, focuses on operational efficiency and cost control. It analyzes asset ROI, maintenance spend, depreciation, and compliance health. The waterfall chart breaks down how each cost component affects asset value, while trend charts monitor ROI performance and audit compliance levels. The warranty and replacement tracker table helps plan upcoming replacements and ensures assets are renewed or retired on time.
Together, these two views form a complete enterprise asset performance analytics tool that blends operational monitoring with financial visibility.
How to Analyze Data in an Enterprise Asset Performance Dashboard
Here’s how you can effectively analyze data in an Enterprise Asset Performance Dashboard to optimize asset performance and ROI:
- Evaluate Utilization Rates: Compare asset usage across departments to identify idle or under-utilized categories.
- Track Condition & Maintenance Load: Use condition distribution charts to monitor assets in good, fair, or maintenance stages.
- Monitor Financial Impact: Review maintenance, depreciation, and replacement costs to determine total asset value change.
- Assess ROI Trends: Track ROI percentage month-to-month to ensure assets are generating expected returns.
- Ensure Compliance & Risk Control: Analyze compliance charts to maintain audit readiness and minimize operational risks.
- Forecast Replacements: Leverage warranty expiry and replacement due data to schedule proactive asset renewals.
Benefits of Enterprise Asset Performance Dashboard
Here are the key benefits of using an Enterprise Asset Performance Dashboard for your organization:
- Improved Asset Utilization: Optimize deployment and reduce idle equipment with real-time utilization tracking.
- Enhanced Maintenance Efficiency: Identify high-cost categories and plan preventive maintenance using historical data.
- Data-Driven Financial Planning: Analyze asset value trends, depreciation, and ROI to guide investment and budgeting decisions.
- Reduced Operational Risk: Monitor compliance health and ensure safety through timely audits and maintenance alerts.
- Better Lifecycle Management: Track asset performance from acquisition to disposal for improved longevity and reliability.
- Cross-Department Visibility: Centralize asset data across regions, departments, and facilities for unified decision-making.
KPIs to Track in Enterprise Asset Performance Dashboard
Main KPIs to track in an Enterprise Asset Performance Dashboard are:
- Total Active Assets: Measures the number of assets currently in operation or service.
- Average Utilization (%): Indicates how effectively assets are being used across departments.
- Asset Turnover Ratio: Evaluates how efficiently assets generate revenue.
- ROI on Assets (%): Tracks profitability from asset investments relative to cost.
- Maintenance Cost per Asset: Monitors recurring maintenance expenditure for each asset type.
- Depreciation YTD: Tracks total value reduction over time for accounting and lifecycle planning.
- Audit Compliance Rate (%): Shows adherence to maintenance schedules and regulatory requirements.
- Replacement Due Next Quarter: Highlights assets nearing end-of-life or due for replacement.
Frequently Asked Questions
Q1. Who can use an Enterprise Asset Performance Dashboard?
It is ideal for facility managers, finance teams, operations leaders, and maintenance engineers who need real-time insights into asset health and performance.
Q2. How does this dashboard improve ROI?
By tracking utilization, downtime, and cost performance, it helps allocate resources more efficiently and extend asset life, directly improving ROI.
Q3. Can it be integrated with existing ERP or CMMS systems?
Yes. Most enterprise asset performance review dashboard platforms can integrate with ERP, CMMS, or financial systems to unify asset data in one view.
Q4. What data sources does it use?
It typically combines data from asset registers, maintenance logs, financial records, and IoT sensors for accurate performance monitoring.
Q5. How often should asset performance be reviewed?
Monthly or quarterly reviews are recommended to maintain compliance, identify risks early, and optimize cost performance.