
What is an SMB Budget Report Dashboard?
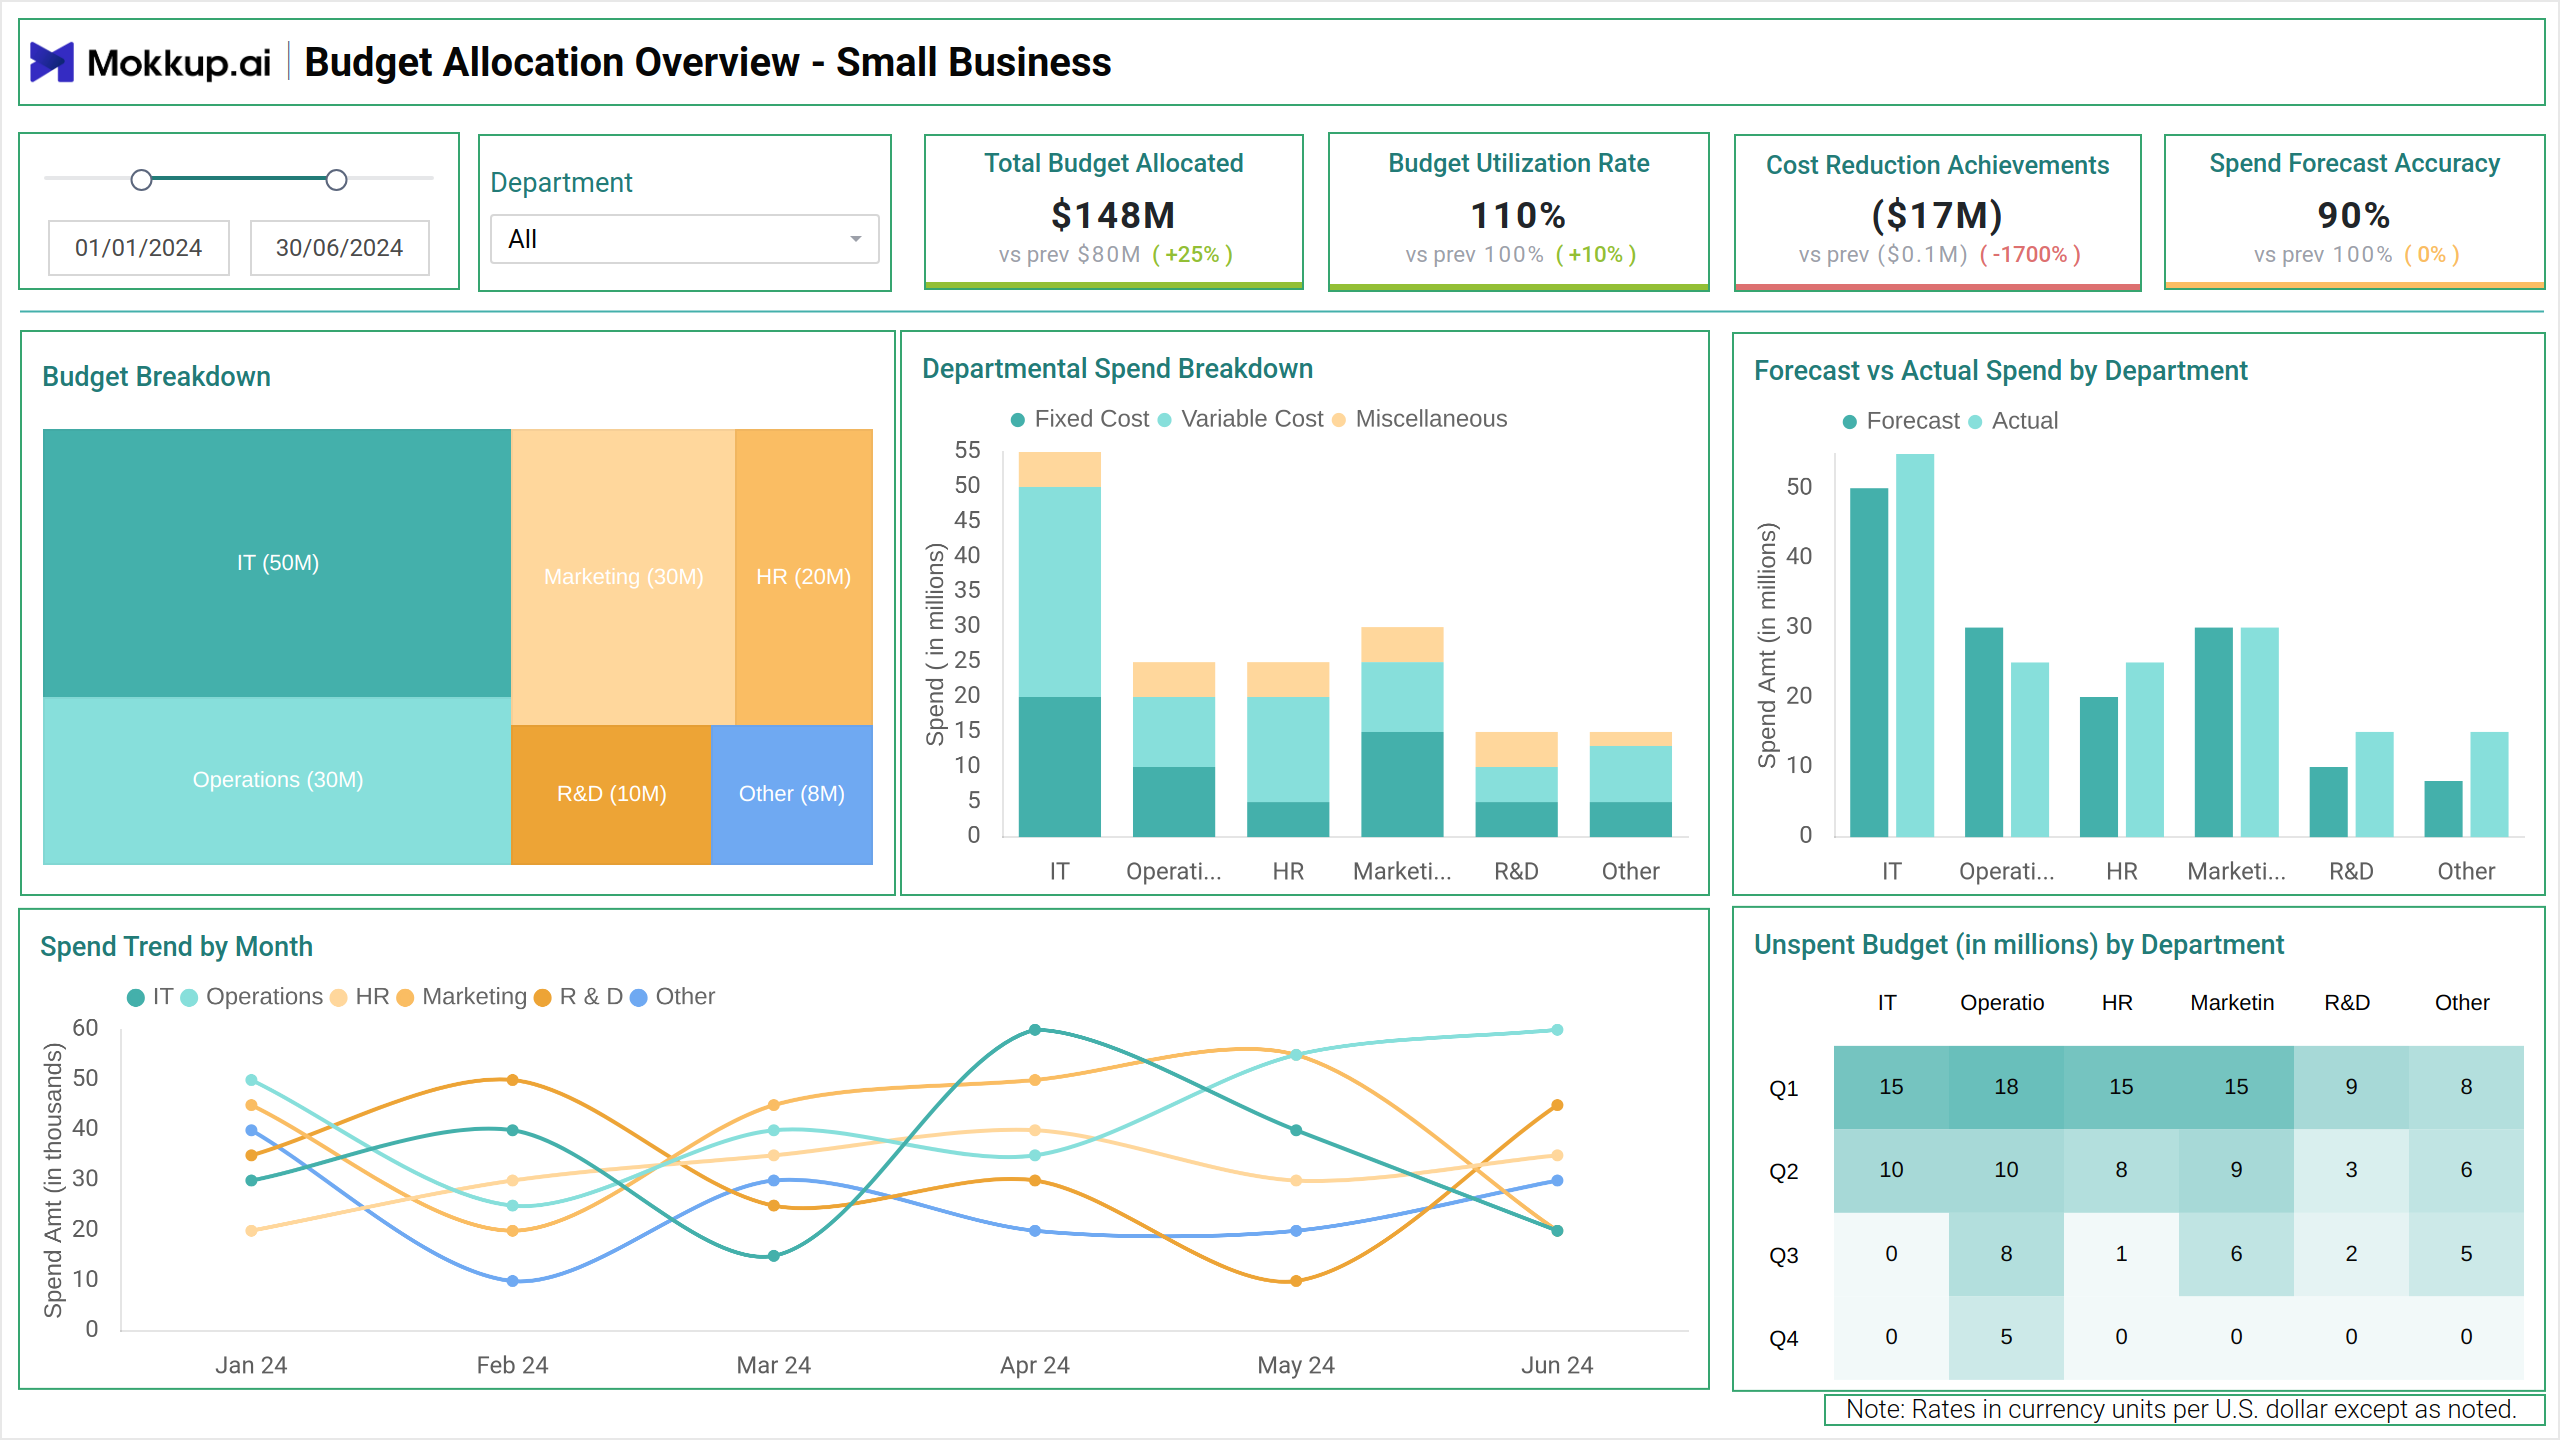
The SMB Budget Report Dashboard template provides a comprehensive analysis of budget distribution, spending trends, and forecast accuracy across departments in small businesses. It enables stakeholders to monitor financial efficiency, optimize resource allocation, and identify opportunities for cost reduction.
SMB Budget Dashboard Example
The SMB Budget Dashboard template provides small and medium-sized businesses with a clear picture of monthly and yearly financial performance. It displays key metrics like total budget, actual spend, variance, cost breakdown by category, and forecast accuracy, all in one interactive layout.
Designed for finance teams and business owners, this dashboard wireframe helps track expenses, identify overspending, and make informed decisions to align spending with strategic goals and improve budget efficiency.
How to Analyze Data in SMB Budget Dashboards
Analyzing the Mokkup.ai Budget Dashboard template helps small businesses manage spending more efficiently, reduce waste, and improve forecast accuracy. Here’s how to approach it:
- Track budget allocation vs actual spending to assess whether funds are being used as planned. Use stacked column charts to compare forecasts with real-time data and highlight overspending or underspending.
- Review department-wise spending trends using line charts and treemaps. This helps identify which teams are consuming the most resources and if that aligns with company priorities.
- Use heatmaps and summary cards to check unspent budgets and cost-saving metrics. Identify opportunities for reallocation and evaluate the impact of budget optimization strategies.
- Compare fixed and variable expenses across departments to understand cost structures. Use visual breakdowns to decide where spending can be reduced without hurting operations.
The small business financial tracker helps small business teams to monitor financial performance with clarity and precision. With real-time insights, they can plan smarter, reduce waste, and drive sustainable growth.
How to Create a Budget Dashboard for SMBs
You don’t need to build your report from scratch—just start with a ready-to-use sample SMB Budget Report Dashboard template from Mokkup. Add in your data and export it however you like. Here’s how to do it:
1. Create or Log in to Your Mokkup Account
Start by signing up on Mokkup.ai using your email. Already have an account? Just log in, and you’re good to go.
2. Choose and Customize Your Dashboard Template
Find the SMB Budget Report Dashboard in the Templates section. Use the drag-and-drop editor to adjust KPIs, edit filters, or add elements based on your data.
3. Export to Your BI Tool
Once your dashboard wireframe is ready, use the BI Tool Export feature to send it directly to Power BI or Tableau for further analysis and enhancements. You can also download the dashboard as a PDF, PNG, or JPEG, embed it on a platform, or invite your team to collaborate.
Note: This is a Pro template. To use and customize this dashboard wireframe, you’ll need a Pro subscription on Mokkup. Upgrade anytime to unlock full access.
Benefits of SMB Budget Dashboards
Small and medium-sized businesses often face challenges in managing limited resources efficiently. An SMB Budget Dashboard helps track, plan, and optimize financial performance across departments.
- Improves Financial Visibility: Offers a centralized view of budget allocations, spending trends, and departmental performance for better control.
- Enables Smarter Resource Allocation: Helps identify underused budgets or overspending, so businesses can reallocate funds where they’re most effective.
- Boosts Forecasting Accuracy: By comparing projected vs. actual spend, it improves budget planning and helps refine future forecasts.
- Supports Cost Optimization: Reveals unnecessary or excessive expenses, enabling businesses to cut costs and operate more efficiently.
- Increases Accountability: Encourages departmental accountability by making budget usage transparent and measurable.
With clear financial insights, SMBs can avoid surprises, plan better, and focus on what truly drives business growth.
KPIs to Track in SMB Budget Dashboards
Monitoring the right KPIs is crucial for small and medium businesses to maintain financial control, improve forecasting accuracy, and ensure efficient allocation of resources. These indicators provide actionable insights into budgeting performance and cost management across departments.
- Total Budget Allocated: This KPI represents the total amount of funds distributed across all departments within the organization.
- Budget Allocation Rate: This metric measures the percentage of the total budget that has been assigned to various departments.
- Cost Reduction Achievements: This tracks the total savings realized through efficiency initiatives or reduced expenditures.
- Spend Forecast Accuracy: This compares forecasted spending against actual expenditures for each department.
Frequently Asked Questions
Q1. Who uses the SMB Budget Dashboard?
Finance teams, department heads, and business owners in small and medium businesses use the dashboard to track spending, manage budgets, and improve forecast accuracy.
Q2. How does this dashboard help in cost optimization?
It highlights cost-saving opportunities by comparing budgeted vs actual spend, showcasing unutilized funds, and identifying areas of overspending across departments.
Q3. Can I track spending for individual departments?
Yes, the dashboard includes filters to drill down into department-level data, allowing you to view budget allocation, actual spend, and trends specific to each team.