
What is a Smart Water Workforce Productivity Dashboard?
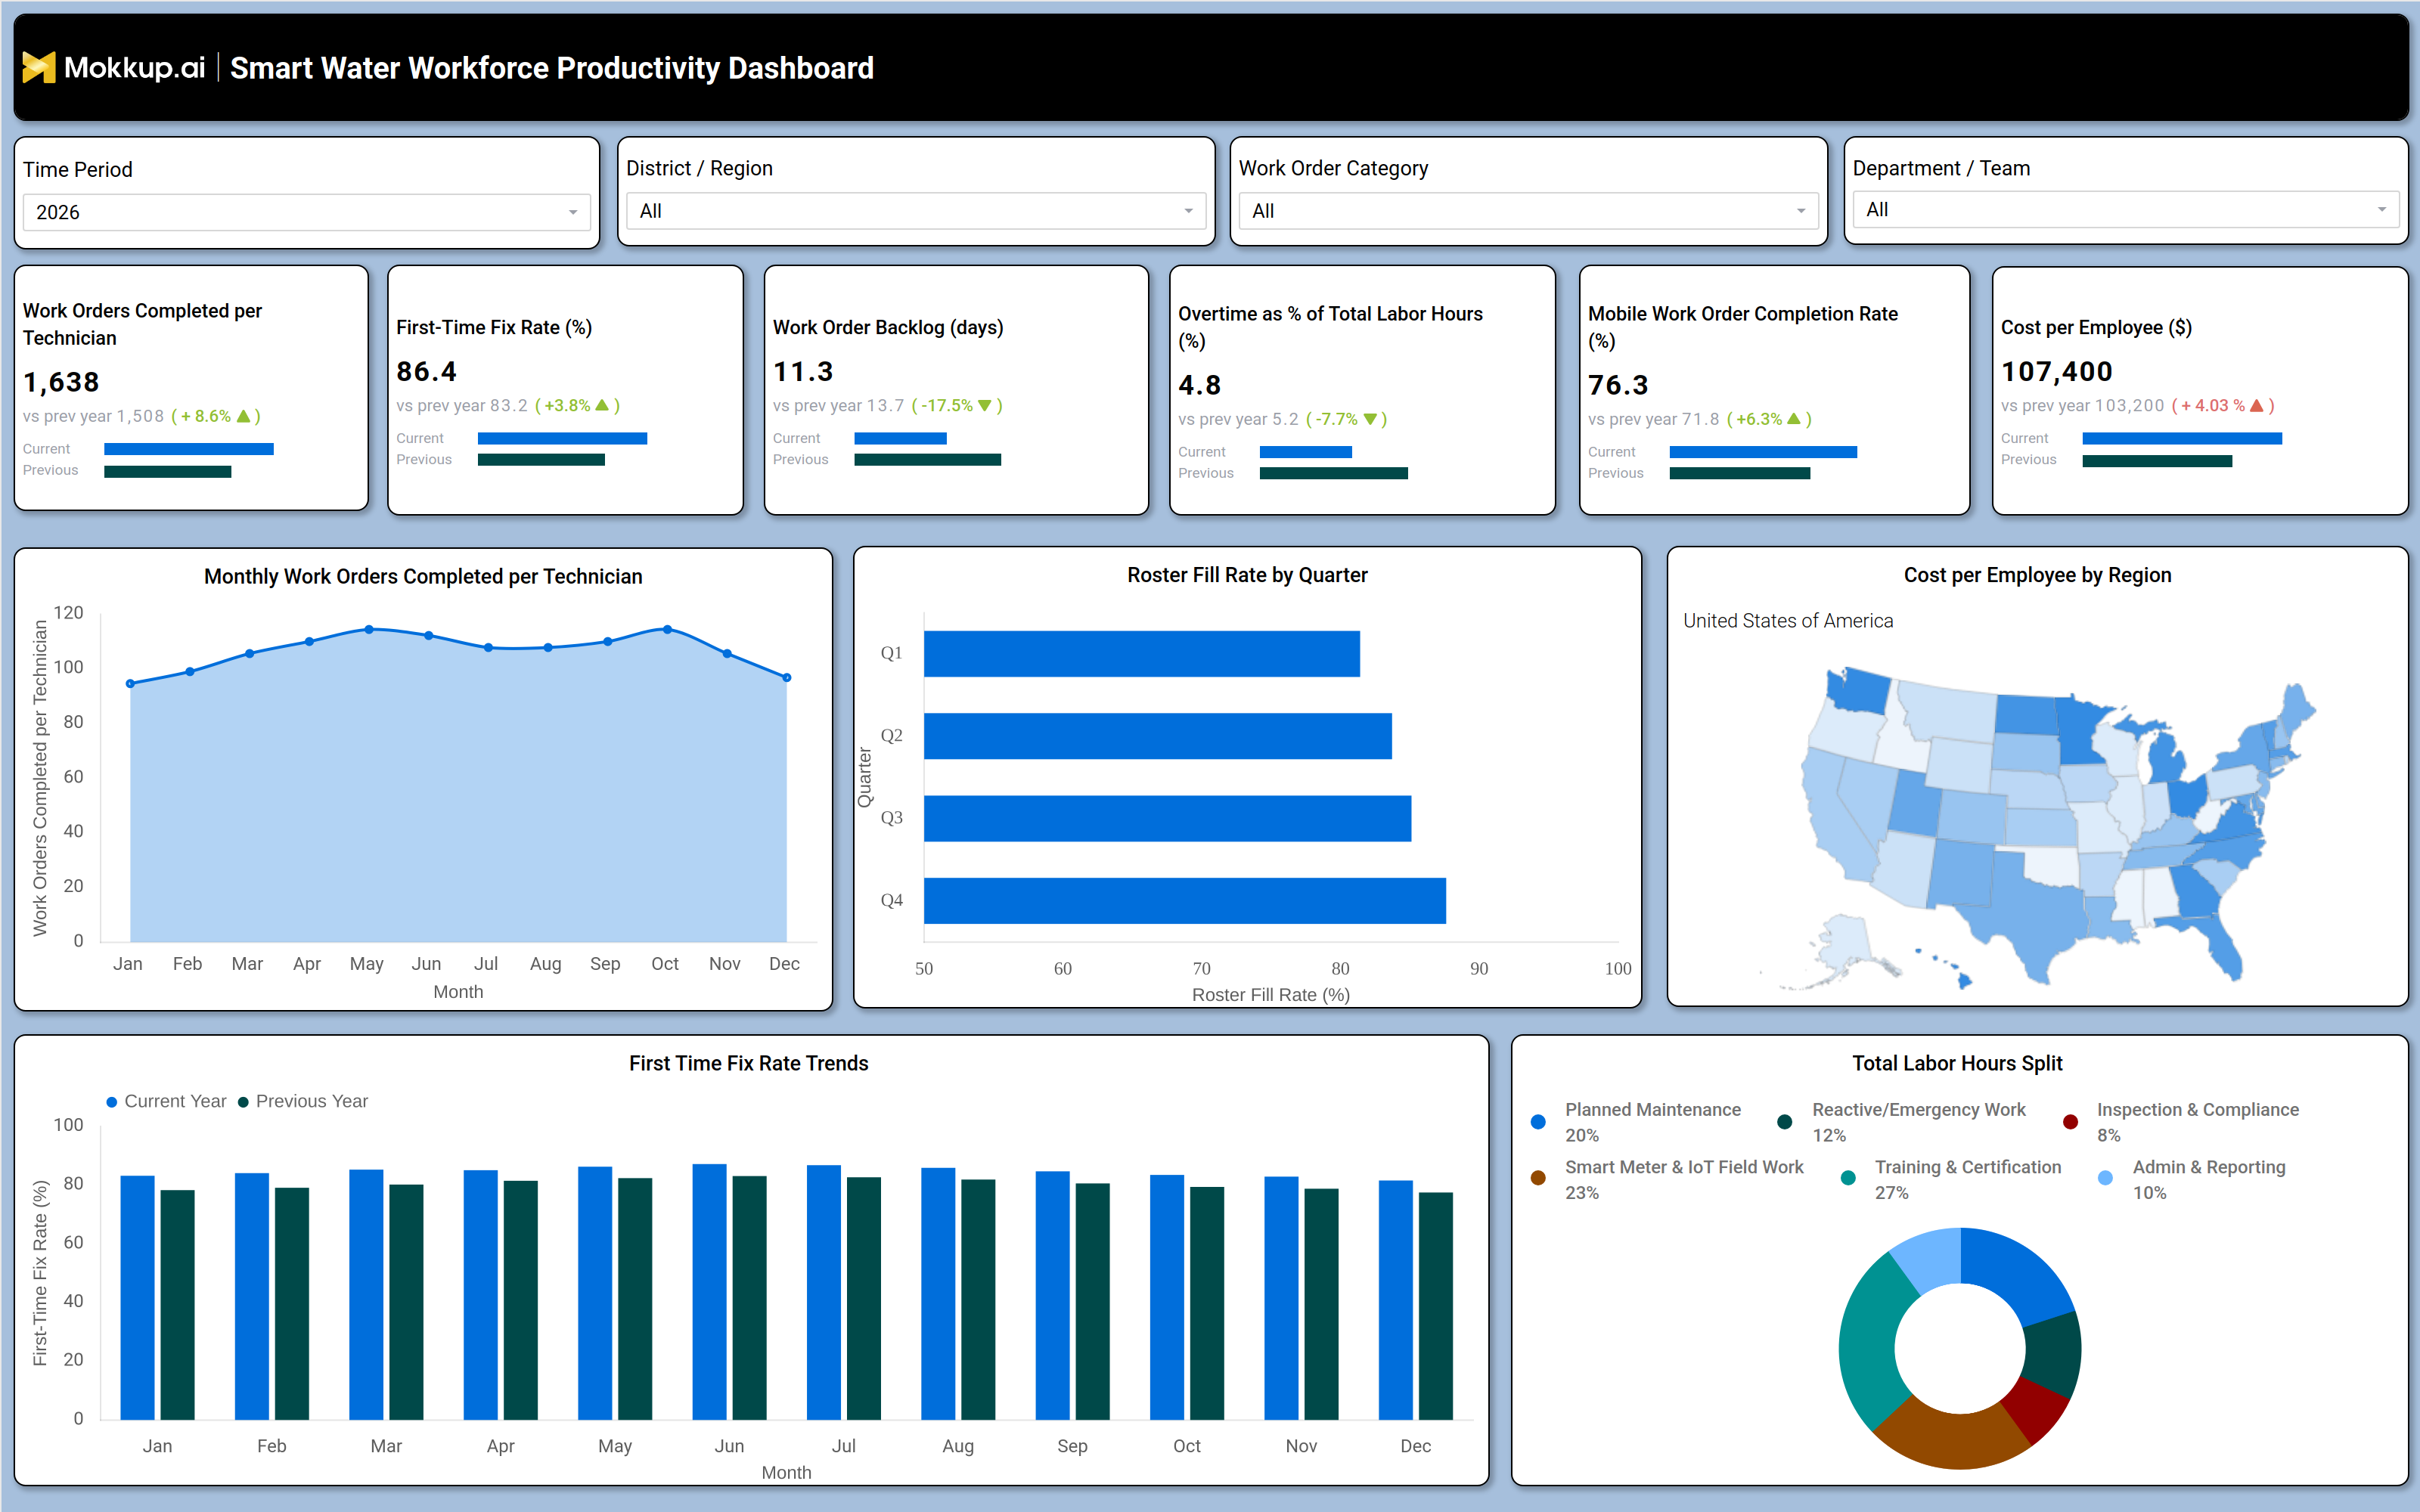
The Smart Water Workforce Productivity Dashboard is a reporting tool built for water utilities that need clear visibility into how their field workforce is performing. It consolidates operational data across technician output, work order management, labor cost, and staffing coverage into a single view. Operations managers, workforce planners, and utility directors use it to understand where productivity gaps exist, how staffing levels are holding against demand, and whether labor spend is within expected ranges. As utilities expand smart meter installations and IoT-enabled field work, water utility field technician performance metrics become more complex to manage without a dedicated tool. The smart water workforce productivity dashboard provides a consistent framework for measuring performance across districts, departments, and time periods.
How to Create a Smart Water Workforce Productivity Dashboard
You don't need to build your report from scratch; just start with a ready-to-use dashboard template from Mokkup. Add in your data and export it however you like. Here's how to do it:
1. Create or Log in to Your Mokkup Account
Start by signing up on Mokkup.ai using your email. If you already have an account, just log in, and you'll be good to go.
2. Choose and Customize Your Dashboard Template
Find the Smart Water Workforce Productivity Dashboard template in the Templates section. Use the drag-and-drop editor to adjust KPIs, edit filters, or add elements based on your data.
3. Export to Your BI Tool
Once your dashboard wireframe is ready, use the BI Tool Export feature to send it directly to Power BI or Tableau for further analysis and enhancements. You can also download the dashboard as a PDF, PNG, or JPEG, embed it on a platform, or invite your team to collaborate.
Note: This is a Pro template. You'll need a Pro subscription on Mokkup to use and customize this dashboard wireframe. Upgrade anytime to unlock full access.
Smart Water Workforce Productivity Dashboard Example
A workforce planning manager at a regional water utility opens this dashboard at the start of each week to get a clear picture of field team output. The first thing they scan is whether technician productivity is on track with historical benchmarks and whether work order backlog is growing beyond acceptable thresholds. If backlog days are trending upward, that signals either a staffing shortfall or an inefficiency in how work orders are being dispatched and closed. With filters for district, department, and work order category, managers can isolate the problem area rather than responding to a systemwide average.From the same view, planners can assess how labor hours are being distributed across activity types. The total labor hours split shows whether scheduled maintenance, smart meter and IoT field work, training, reactive work, and administrative tasks are balanced appropriately.
If reactive and emergency work is consuming a disproportionate share of hours, that points to a maintenance planning problem rather than a capacity problem. Roster fill rate data across quarters helps planners anticipate staffing gaps before they affect service delivery, making the roster fill rate water operations dashboard component critical for forward planning. Tracking the work order completion rate water utility teams achieve each quarter also reveals whether roster gaps are directly affecting throughput.Utility directors use the cost-per-employee breakdown by region to compare workforce spend across service areas and flag outliers. Combined with first-time fix rate trends over a 12-month period, this view allows leadership to evaluate whether higher-cost districts are also delivering better resolution rates. The smart water workforce productivity dashboard gives teams a structured way to connect labor investment with field outcomes, which is the foundation of any credible workforce performance review.
How to Analyze Data in a Smart Water Workforce Productivity Dashboard
Here is how you can analyze data from this dashboard:
- Filter by Time Period to compare current performance against prior periods and identify output trends
- Use the District / Region filter to isolate underperforming areas without skewing systemwide averages
- Review Monthly Work Orders Completed per Technician to assess output consistency across the year
- Analyze Roster Fill Rate by Quarter to identify staffing gaps before they affect work order completion rate, water utility targets
- Compare First Time Fix Rate Trends year-over-year using the first time fix rate water utility dashboard view to evaluate whether field quality is improving
- Use the Total Labor Hours Split donut chart to review whether hours across maintenance, IoT field work, training, and reporting align with operational priorities
- Monitor Cost per Employee by Region to flag high-spend districts — a direct application of a water utility labor cost tracking tool
- Apply the Department / Team filter to drill into specific team-level productivity rather than relying on aggregate data
Benefits of a Smart Water Workforce Productivity Dashboard
The following are the benefits of using this dashboard:
- Provides a single view of all critical water utility field technician performance metrics without switching between systems
- Helps operations managers identify backlog trends early and adjust dispatch planning before service levels degrade
- Supports data-driven staffing decisions by surfacing roster fill rate gaps across quarters on the roster fill rate water operations dashboard
- Enables cost accountability by connecting per-employee spend to regional output data through a water utility labor cost tracking tool
- Reduces time spent on manual reporting by consolidating technician productivity, labor hours, and fix rate data in one place
- Facilitates performance benchmarking across districts, departments, and work order categories
- Improves budget accuracy by tracking cost trends and linking them to measurable field outcomes
KPIs to Track in a Smart Water Workforce Productivity Dashboard
The following key KPIs can be tracked by using this dashboard:
- Work Orders Completed per Technician - measures individual technician output; a primary indicator of field productivity and dispatch efficiency
- First-Time Fix Rate (%) - tracks the percentage of work orders resolved on the first visit without a repeat call; reflects technician skill and job preparation quality
- Work Order Backlog (days) - measures the average age of unresolved work orders; indicates whether capacity is keeping pace with incoming demand
- Overtime as % of Total Labor Hours (%) - shows the proportion of labor hours worked beyond standard schedules; a signal of staffing pressure or workload imbalance
- Mobile Work Order Completion Rate (%) - measures the share of work orders completed and closed using mobile tools in the field; reflects digital adoption and process compliance
- Cost per Employee ($) - tracks total labor cost divided by headcount; used as a water utility labor cost tracking tool to compare spend efficiency across regions and departments
Frequently Asked Questions
1. What is a Smart Water Workforce Productivity Dashboard?
It is a reporting tool designed for water utilities to monitor field technician performance, work order management, labor costs, and staffing coverage in one view. It combines water utility field technician performance metrics with cost and scheduling data to support operational decisions.
2. How does the First-Time Fix Rate help water utility managers?
First-Time Fix Rate shows what percentage of work orders are resolved without a repeat visit, which directly affects cost and customer satisfaction. Tracking it over time on a first time fix rate water utility dashboard helps managers identify training gaps or recurring equipment issues.
3. Can this dashboard be filtered by region or department?
Yes. The dashboard includes filters for Time Period, District / Region, Work Order Category, and Department / Team. These allow managers to drill into specific service areas or teams rather than reviewing only systemwide averages.