
What is a Hydroelectric Power Plant Workforce Performance Dashboard?
A Hydroelectric Power Plant Workforce Performance Dashboard template is a centralized management tool designed for plant leadership, including plant managers, HR directors, operations chiefs, and maintenance supervisors. It provides a clear overview of workforce health, efficiency, and skill development.
This dashboard wireframe helps track key personnel metrics, including workforce availability, overtime, competency scores, certification compliance, and attrition rates. Unlike scattered reports, this dashboard consolidates Hydroelectric Power Plant Workforce Performance, enabling management to monitor workforce productivity, operational readiness, and safety compliance in one place.
How to Create a Hydroelectric Power Plant Workforce Performance Dashboard
You don't need to build your report from scratch—just start with a ready-to-use Hydroelectric power plant workforce performance dashboard template from Mokkup. Add in your data and export it however you like. Here’s how to do it:
1. Create or Log in to Your Mokkup Account
Start by signing up on Mokkup.ai using your email. If you already have an account, just log in, and you’ll be good to go.
2. Choose and Customize Your Dashboard Template
Find the Hydroelectric Power Plant Workforce Performance Dashboard template in the Templates section. Use the drag-and-drop editor to adjust KPIs, edit filters like shift type and department, or add elements based on your data.
3. Export to Your BI Tool
Once your dashboard wireframe is ready, use the BI Tool Export feature to send it directly to Power BI or Tableau for further analysis and enhancements. You can also download the dashboard as a PDF, PNG, or JPEG, embed it on a platform, or invite your team to collaborate.
Note: This is a Pro template. You’ll need a Pro subscription on Mokkup to use and customize this dashboard wireframe. Upgrade anytime to unlock full access.
Hydroelectric Power Plant Workforce Performance Dashboard Example
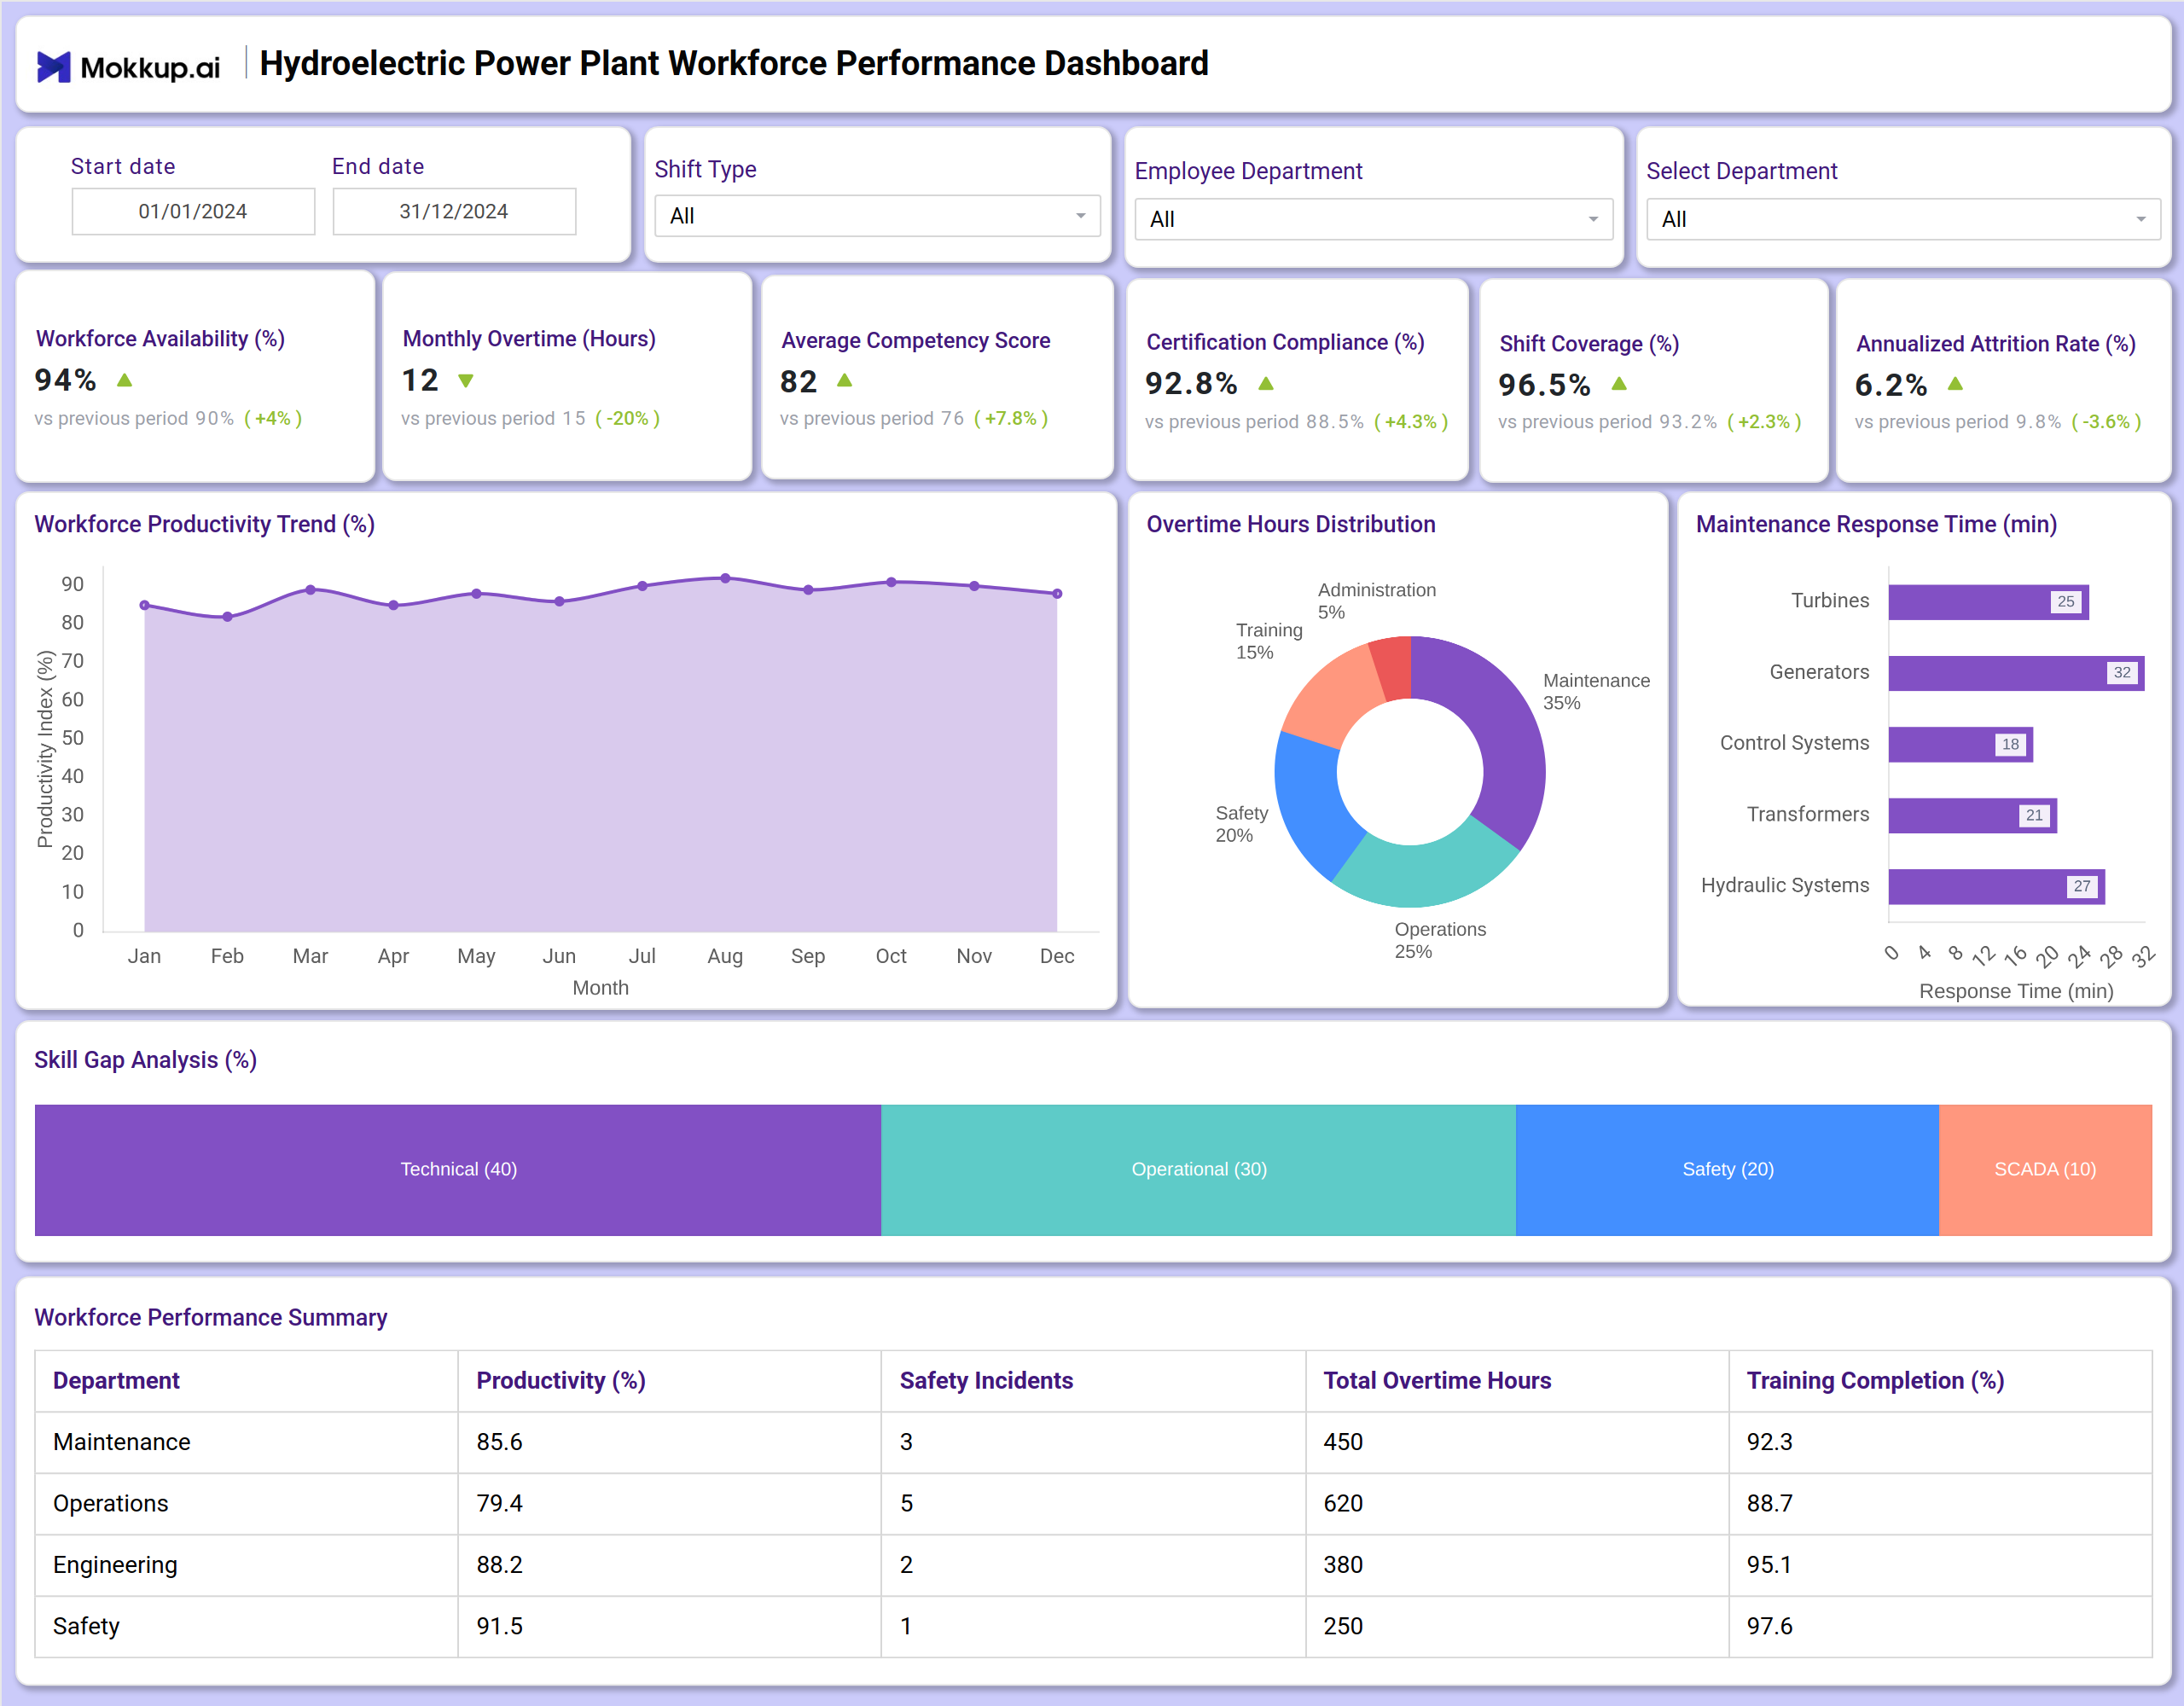
You can create a Hydroelectric Power Plant Workforce Performance Dashboard with a mix of KPI tiles and visualizations. At the top, KPI cards track key metrics, including Workforce Availability, Monthly Overtime, and Average Competency Score. Below that, charts show trends in workforce productivity over the year, the distribution of overtime hours across departments such as Maintenance and Operations, and maintenance response times for critical assets, including Turbines and Generators.
A skill gap analysis chart and a department performance summary table provide deeper insights. Together, this dashboard works as the definitive dashboard for tracking workforce metrics in the energy sector, ensuring leadership has full visibility into human capital effectiveness.
How to Analyze Data in Hydroelectric Power Plant Workforce Performance Dashboards
Here’s how plant managers can make the most of the data available on the Hydroelectric Power Plant Workforce Performance Dashboard:
- Monitor Workforce Health: Track Workforce Availability and Annualized Attrition Rate to gauge overall staff stability and retention success.
- Manage Operational Costs: Analyze Monthly Overtime hours and their distribution to control labor costs and identify departmental pressures.
- Assess Skill Proficiency: Review the Average Competency Score and Skill Gap Analysis to identify training needs and ensure a qualified workforce.
- Ensure Regulatory Readiness: Check Certification Compliance percentages to avoid operational shutdowns and ensure all personnel are properly certified.
- Evaluate Operational Efficiency: Use Shift Coverage and Maintenance Response Times to assess how well-staffed shifts are and the speed of addressing critical equipment issues.
- Compare Departmental Performance: Use the performance summary table to compare Productivity, Safety Incidents, and Training Completion across departments like Maintenance, Operations, and Engineering.
Benefits of Hydroelectric Power Plant Workforce Performance Dashboards
This dashboard helps hydro plant leaders monitor workforce reliability, skills, compliance, and operational readiness in one place:
- Improved Workforce Visibility: Clear KPIs across availability, competency, and compliance.
- Operational Cost Control: Tracks overtime trends to help manage labor budgets effectively.
- Enhanced Skill Management: Identifies skill gaps and training completion rates for proactive workforce development.
- Increased Operational Reliability: Monitors shift coverage and maintenance response times to ensure plant reliability.
- Informed Strategic Planning: Provides the data needed for strategic workforce planning and resource allocation.
- Safety and Compliance Assurance: Tracks safety incidents and certification status, making it an essential workforce analytics and compliance dashboard for hydro plants.
Together, these elements provide leadership with a comprehensive view of their workforce's contribution to plant performance, making it easier to align human resources with operational goals. That’s why many plant managers call it the best workforce performance dashboard for hydroelectric facilities.
KPIs to Track in Hydroelectric Power Plant Workforce Performance Dashboards
These KPIs provide a comprehensive view of workforce readiness, safety, capability, and operational contribution:
- Workforce Availability (%): The percentage of the workforce that is present and ready to work, indicating overall staff reliability.
- Monthly Overtime (Hours): The total number of overtime hours worked in a month, a key indicator of workload and labor cost control.
- Average Competency Score: A quantified measure of the workforce's average skill and proficiency level.
- Certification Compliance (%): The percentage of employees with up-to-date required certifications, critical for safety and regulatory adherence.
- Shift Coverage (%): Measures how well-staffed each shift is in relation to required levels, impacting operational continuity.
- Annualized Attrition Rate (%): The projected annual rate at which employees are leaving the company, a vital metric for retention strategies.
- Maintenance Response Time (min): The average time taken to respond to maintenance issues on key plant assets.
- Skill Gap Analysis (%): A visual breakdown of where the largest skill deficiencies exist across technical, operational, and safety domains.
Frequently Asked Questions
Q1. Who should use a Hydroelectric Power Plant Workforce Performance Dashboard?
Plant managers, HR directors, operations managers, and maintenance supervisors are responsible for developing workforce strategies and monitoring plant performance.
Q2. Can this dashboard help control operational costs?
Yes. By monitoring overtime hours and analyzing productivity trends, leadership can make informed decisions to optimize labor costs and improve efficiency.
Q3. How does it support workforce development?
It combines competency scores, skill gap analysis, and training completion rates to help identify development needs and track progress.
Q4. Is this dashboard useful for compliance?
Yes, because a hydro plant workforce analytics and compliance dashboard tracks essential metrics like certification compliance and safety incidents, supporting governance and audit reporting.